VOLUME 40, ARTICLE 29, PAGES 835
-
864
PUBLISHED 9 APRIL 2019
https://www.demographic-research.org/Volumes/Vol40/29/ DOI: 10.4054/DemRes.2019.40.29
Research Material
Costa Rican mortality 1950–2013:
An evaluation of data quality and trends
compared with other countries
Dana A. Glei
Magali Barbieri
Carolina Santamaría-Ulloa
© 2019 Dana A. Glei, M. Barbieri & C. Santamaría-Ulloa.
This open-access work is published under the terms of the Creative Commons Attribution 3.0 Germany (CC BY 3.0 DE), which permits use, reproduction, and distribution in any medium, provided the original author(s) and source are given credit.
1 Introduction 836
2 Data and methods 841
2.1 The Human Mortality Database protocol to construct life tables 841 2.2 Assessing data reliability through internal consistency checks 842 2.3 Assessing data reliability through external consistency checks 844
3 Evaluation of data quality 844
3.1 Age misreporting 844
3.1.1 Age heaping 844
3.1.2 Age exaggeration 847
3.2 Relative completeness 848
3.3 Comparing Costa Rica mortality estimates across all sources 850
4 Mortality trends compared with other countries 853
4.1 Life expectancy at birth (e0) 853
4.2 Life expectancy at age 80 (e80) 854
4.3 Relationship between child and older-age mortality 856 4.4 Pattern of mortality at higher ages in comparison with Sweden 857 5 Intercountry comparisons with LAMBdA life tables 857
6 Conclusion and discussion 858
7 Acknowledgements 859
Costa Rican mortality 1950–2013:
An evaluation of data quality and trends compared with
other countries
Dana A. Glei1 Magali Barbieri2 Carolina Santamaría-Ulloa3
Abstract
BACKGROUND
Mortality estimates from various sources suggest that Costa Ricans experience record-high life expectancy at birth in Latin America and record-higher longevity than the populations of many high-income countries, although there is some uncertainty as to the reliability of those estimates.
OBJECTIVE
We construct a life table series for Costa Rica to assess the quality of national demographic statistics for the period 1950–2013 and to determine whether reliable mortality estimates can be directly calculated from this data.
METHODS
We apply the methods from the Human Mortality Database (HMD) to national statistics to construct the Costa Rica life table series without adjusting for data quality. We also validate our results through internal consistency by evaluating the plausibility of the mortality patterns and its change over time and through external consistency by comparing our results with those from other sources.
RESULTS
Our mortality estimates for Costa Rica tend to be lower than others, especially for the period before 1970. They also produce a suspicious age pattern of mortality, with low adult and old-age mortality relative to the infant and child mortality, casting doubt on the quality of national demographic data.
1 Georgetown University, Washington, DC, USA, and University of California, Berkeley, USA.
Email:[email protected].
2 University of California, Berkeley, USA, and Institut national d’études démographiques (INED), Paris,
France.
CONCLUSIONS
Other organizations have produced mortality estimates for Costa Rica that are higher than our unadjusted estimates, but it is difficult to evaluate the accuracy of the available estimates.
CONTRIBUTION
This analysis provides a more thorough evaluation of data quality issues regarding Costa Rica mortality than previously available. Unadjusted life tables by sex for 1950– 2013 are included as supplemental material, together with the raw data upon which those life tables are based and with links to the detailed methods protocol implemented.
1. Introduction
Costa Ricans are among the longest-lived people in Latin America. Based on the United Nations Population Division (UNPD) estimates for 2010–2015, life expectancy at birth (e0,both sexes combined) in Costa Rica was 79.2 years, far higher than for Central America as a whole (75.8) and surpassed by no other country within the Latin American and Caribbean (LAC) region (United Nations, Department of Economic and Social Affairs, Population Division 2017). The UNPD estimates suggest thate0in Costa Rica also exceeds that of the US population (78.9). This situation would be quite remarkable if it were accurate. How much credence we can give to such comparisons depends on the reliability of the estimates and the quality of the underlying data. Our purpose in this paper is to determine the degree of reliability of the mortality indicators derived from national demographic statistics using direct estimation methods, that is without adjustment.
only Cuba and Uruguay consistently outperformed Costa Rica in terms of census coverage throughout the period since 1950 (Borges and Sacco 2016).
One indicator of data quality is the degree of uncertainty in mortality estimates. Here we consider variations in mortality indicators for Costa Rica over the whole age range (i.e., estimates of life expectancy at birth, e0) and at high ages (i.e., life expectancy at age 80,e80), where many problems of data quality are concentrated (both in terms of coverage and accuracy, regarding age, for instance). We know of five different sets of life table series for Costa Rica. They have been produced by the
Instituto Nacional de Estadística y Censos in collaboration with the Centro
Centroamericano de Población at the Universidad de Costa Rica (INEC-CCP); the
United Nations Population Division (UNPD); the Latin American Mortality Database (LAMBdA); the World Health Organization (WHO); and the Institute for Health Metrics and Evaluation-Global Burden of Disease program (GBD). While the INEC-CCP estimates are directly constructed from vital statistics and census-based population data using classic demographic techniques, the LAMBdA and GBD estimates are indirectly estimated using a complex set of methods developed by demographers at LAMBdA (Beltrán-Sánchez et al. 2018) and by statisticians at the GBD (Wang et al. 2016).
The estimates for Costa Rica published by the UNDP were prepared by the Latin American and Caribbean Demographic Centre (CELADE) at the Economic Commission for Latin America and the Caribbean, which is the Latin American office of the United Nations. CELADE constructed abridged life tables by sex for all census years using the census population combined with birth and death counts from the vital statistics system. Life tables for each five-year period were estimated by linear interpolation on the probabilities of dying at each age from the life tables centered on the censuses. Postcensal life tables were built by interpolation between the last census-based mortality estimates (those for 2011 in the case of Costa Rica) and a ‘life limit table’ believed to represent the mortality pattern that will be achieved by 2050 (see Latin America and the Caribbean Demographic Observatory 2007: 239–242, for a detailed description of the methods used by CELADE for their mortality estimates and projections).
for completeness of death registration using the Synthetic Extinct Generation method, and, finally, correcting for age misstatement assuming a systematic pattern of overstatement; and 3) Mortality estimates for ages below 5 derived from the first step were combined with mortality estimates for ages 5 and above derived from the second step to produce a full set of age-specific death rates and from those, complete life tables.
The methodological procedures followed by other producers of life table estimates for Costa Rica (namely WHO and the GBD) are poorly documented. What the documentation suggests is that all appear to have used the same source of raw data, meaning vital statistics and population estimates or census data published by INEC-CCP. The general process followed within the GBD relies on statistical modeling following the Bayesian approach, but the specific model implemented was too poorly documented for reproducibility at the time this article was prepared. The rest of this paper will thus place greater emphasis on the comparison between our own estimates and those from the UNPD and LAMBdA rather than those from WHO and the GBD.
Figure 1: Estimates of life expectancy at birth (e0) for Costa Rica, 1950–2015, by sex
Note: Estimates from the UNPD are based on life tables for 5-year periods and are plotted at the midpoint of the period.
Source: UNPD (United Nations, Department of Economic and Social Affairs, Population Division 2015); GBD (Institute for Health Metrics and Evaluation 2016); WHO (World Health Organization 2014); INEC-CCP (Instituto Nacional de Estadística y Censos 2009, 2017a); and LAMBdA (Palloni, Pinto-Aguirre, and Beltrán-Sánchez 2016).
50 55 60 65 70 75 80 85
1950 1960 1970 1980 1990 2000 2010
e0
a) Males
UNPD GBD WHO INEC-CCP LAMBdA
50 55 60 65 70 75 80 85
1950 1960 1970 1980 1990 2000 2010
e0
b) Females
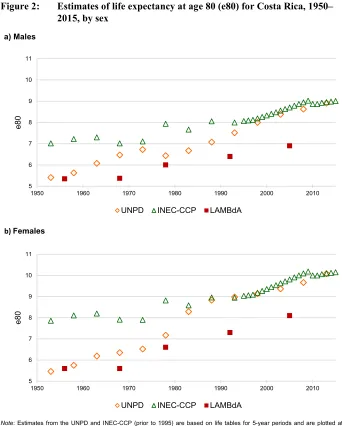
Figure 2: Estimates of life expectancy at age 80 (e80) for Costa Rica, 1950– 2015, by sex
Note: Estimates from the UNPD and INEC-CCP (prior to 1995) are based on life tables for 5-year periods and are plotted at the midpoint of the period.
Sources: UNPD (United Nations, Department of Economic and Social Affairs, Population Division 2015); INEC-CCP (Centro Centroamericano de Población 2017c; Instituto Nacional de Estadística y Censos 2017a); and LAMBdA (Palloni, Pinto-Aguirre, and Beltrán-Sánchez 2016).
5 6 7 8 9 10 11
1950 1960 1970 1980 1990 2000 2010
e80
a) Males
UNPD INEC-CCP LAMBdA
5 6 7 8 9 10 11
1950 1960 1970 1980 1990 2000 2010
e80
b)Females
The objectives of this paper are to: (1) evaluate the data quality of mortality estimates for Costa Rica 1950–2013 using standard methods applied to the official vital statistics and population counts without making further adjustments, and (2) compare the estimates with those produced by others (in some cases based on adjusted data) and with corresponding estimates for the 38 countries that were included in the Human Mortality Database (HMD) at the time the Costa Rican data series was constructed.
The HMD is an international repository of mortality series for (currently 40) countries with high-quality data produced by a collaboration between the Department of Demography at the University of California, Berkeley, and the Max Planck Institute for Demographic Research (MPIDR) in Rostock (for details, see Barbieri et al. 2015). Starting in 2006, the project has also benefited from continuous support by the French Institute for Demographic Studies. Since its debut in 2002, the HMD has provided detailed mortality and population data to all those interested in the history of human longevity. With 50,000 registered users and over 5,000 publications citing the database as a main data source, the HMD is a leading resource for mortality research. The methods used in the HMD have become the gold standard to produce historical mortality indicators for countries with demographic data of good quality. One of the main advantages of the HMD is the standardized protocol used to construct life tables for all countries and time periods. Because the original data used to produce the HMD series are also published on the website (www.mortality.org), the whole process is transparent. Here, we applied the HMD process to evaluate the mortality data for Costa Rica. Though the HMD protocol cannot yield accurate mortality estimates for a country with defective data, the well-documented methodology can reveal questionable or implausible patterns. Indeed, the final goal of our study is not to produce a life table series that is as accurate as possible but to use it as an instrument to assess the reliability of national demographic statistics.
2. Data and methods
The HMD methods protocol relies on classic demographic techniques (Wilmoth et al. 2017). The basic data used to construct mortality estimates are directly collected from national statistics offices.
2.1 The Human Mortality Database protocol to construct life tables
under- or overcount by the national statistics offices before publication. Following the HMD protocol, birth counts by sex are used mainly for estimating the relative size of individual cohorts. Death counts by sex and detailed age are used for the numerator of the age-specific mortality rates. Deaths, births, and population counts – also by sex and detailed age – are used to derive exposure counts below age 80 years. At age 80 and above, in part to account for lower data quality in most countries and for most historical periods, exposures-to-risk are estimated through a combination of the Extinct Cohort method and the Survival Ratio method that rely on the cohort-specific death counts. At very high ages (95+ years or below if there are fewer than 100 men or women surviving in any given country-year), the mortality rates are smoothed (to avoid the large random fluctuations associated with small numbers) using a technique initially proposed by Vaino Kannisto (Thatcher, Kannisto, and Andreev 2002). At these high ages, the underlying hazards are estimated by fitting a logistic curve with an asymptote at one to the age-specific mortality rates. The resulting age-specific death rates are combined to derive complete life tables by sex using conventional demographic formulas.
The raw data for Costa Rica (see Supplementary archive, S1. Raw “Input Data” for Costa Rica) comprises official vital statistics, population estimates, and census counts available online (Centro Centroamericano de Población 2017a, 2017b; Palloni, Pinto-Aguirre, and Beltrán-Sánchez 2016). Since 1950, Costa Rica has conducted censuses on a regular basis (i.e., in 1950, 1963, 1973, 1984, 2000, and 2011). For the purpose of computing mortality rates and life tables, we use the official annual population estimates published by INEC-CCP rather than the original census counts. To produce these estimates, INEC-CCP adjusts for the underregistration of deaths, estimated net migration, age misreporting, and census underenumeration. The INEC-CCP population estimates are constructed using backward projection, starting with the estimated population in 2011 – which has been adjusted for age misreporting and the undercount in the 2011 census – and using estimates of net migration and death counts that have been adjusted for underregistration (Rosero-Bixby, personal communication, November 2, 2016). We use the official census counts only for comparison. Our unadjusted life tables for Costa Rica (see Supplementary archive, S2. Unadjusted Life Tables for Costa Rica) were calculated following the HMD Methods Protocol, Version 5 (Wilmoth et al. 2007).
2.2 Assessing data reliability through internal consistency checks
Preston 1994) for diagnosing age exaggeration (see Supplementary archive, S3. Intercensal Cohort Method for details). Next, we evaluate relative completeness using Death Distribution Methods (DDM).
Death Distribution Methods are designed to estimate the completeness of death registration relative to population counts. The two most well-established methods are the General Growth Balance method (GGB, Brass 1975; Hill 1987; Hill, You, and Choi 2009) and the Synthetic Extinct Generation method (SEG, Bennett and Horiuchi 1981; Bennett and Horiuchi 1984). Hill, You, and Choi (2009) have also developed a hybrid method (GGB-SEG), which addresses the sensitivity of the SEG method to changes in coverage between consecutive censuses. Palloni, Pinto-Aguirre, and Beltrán-Sánchez (2015) evaluate 12 different methods of estimating relative completeness and conclude that, in most cases, GGB-SEG performs best. Palloni, Beltrán-Sanchez, and Pinto-Aguirre (2017) also propose a procedure that uses all the plausible estimators from such methods, which they argue leads to more robust and conservative hypothesis tests than relying on a single estimate. Hill, You, and Choi (2009) also conclude that in populations not affected by migration, it is best to use GGB-SEG, fit to the age range 5+ to 65+ because age misreporting is more of a problem above age 65, independently from the issue of completeness per se. In populations substantially affected by migration, Hill, You, and Choi (2009) argue that the GGB and GGB-SEG methods underestimate coverage (thus, overestimating mortality), whereas the SEG method does the opposite. Thus, in the case of migration, they find the best strategy (i.e., smallest error) is to fit both GGB and SEG to the age range 30+ to 65+ and then average the results (Hill, You, and Choi 2009). Using this higher starting age reduces the effects of migration, which tends to be concentrated at younger ages.
We used the DDM R package (Lima, Queiroz, and Riffe 2016) to compute the GGB and GGB-SEG estimates of relative completeness, fitted to three age ranges: 5+ to 65+; 30+ to 65+; and the ‘optimal’ age range as determined by the DDM package. We assess relative completeness based on the official population estimates rather than the original census counts because we rely on the former rather than the latter for the purpose of computing our life tables. These population estimates have already been adjusted by the national statistics office for census underenumeration, although the death counts have not been corrected for underregistration. Thus, our estimates may suggest lower relative completeness than they would if we had used the original census counts as inputs because the denominators have been inflated whereas the numerators have not, thus creating a numerator/denominator bias.
the method is not robust when there is significant net migration or when the completeness of death registration varies by age, as these phenomena can create large distortions (double-digit percentage errors in adult mortality probabilities). While these methods can be adapted to account for migration, it is rare that estimates of net migration are accurate enough to be useful (IUSSP-UNFPA 2017a, 2017b). Net migration is often low enough to ignore when dealing with national populations, but caution should be exercised in interpreting the results if there is a substantial net migration (IUSSP-UNFPA 2017a, 2017b). Furthermore, the fundamental assumptions underlying these methods are often unrealistic, resulting in erroneous results (Li and Gerland 2016).
2.3 Assessing data reliability through external consistency checks
We assess the external plausibility of the life table estimates by comparing our unadjusted estimates of e0 and e80 for Costa Rica with those produced by LAMBdA (Palloni, Pinto, and Beltrán-Sánchez 2016), UNPD (United Nations, Department of Economic and Social Affairs, Population Division 2015), and INEC-CCP (Centro Centroamericano de Población 2017c; Instituto Nacional de Estadística y Censos 2009, 2017a).
In addition to comparing our results with those in LAMBdA, we compare the age structure of mortality resulting from our life tables with those for all countries and time periods in the HMD (University of California and Max Planck Institute for Demographic Research 2016). We evaluate how those comparisons differ when we use adjusted estimates from LAMBdA, which reports the highest mortality, rather than our own unadjusted estimates.
3. Evaluation of data quality
3.1 Age misreporting
3.1.1 Age heaping
the calculation of the classic Whipple’s and Myers’ indices of age attraction (Shryock, Siegel, and Larmon 1973). As noted in the Data section, the INEC-CCP population estimates are constructed using backward projection, starting with population estimates for 2011 that have been corrected for age misreporting. By relying on the official population estimates rather than using the original census counts, we avoid most of the problems associated with age heaping.
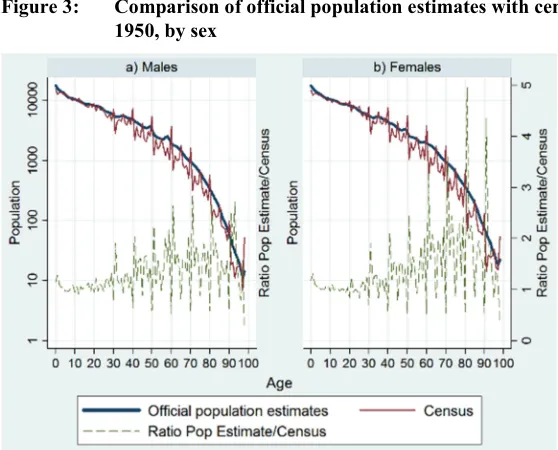
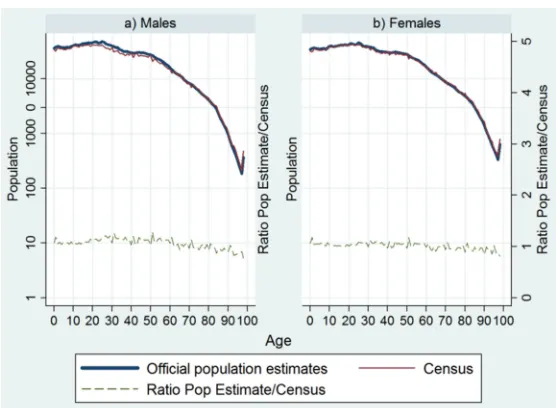
Figure 4: Comparison of official population estimates with census counts, 1984, by sex
Age attraction, as measured by Whipple’s and Myers’ indices, is slightly more prominent in the death counts than in the population counts. However, they remain well within the range of good-quality data. For the period since 1980, Myers’ index (computed for the age range 30–99) hovers around 5 to 8 for the deaths (with an occasional value greater than 9) versus less than 2 (except for 1984, when values are slightly greater) for the population counts; Whipple’s index (computed for the age range 32–92) fluctuates between 96 and 110 for the death counts (with one value as high as 113 for females in 1981) and between 99 and 105 for the population counts (results not shown). There is little evidence of age heaping in the mortality rates after the mid-1970s.
3.1.2 Age exaggeration
Age exaggeration is a more insidious problem than age heaping because it is difficult to identify, quantify, and thus correct, but it can severely distort mortality estimates. Preston, Elo, and Stewart (1999) demonstrate that regardless of the nature of age misreporting (overstatement, understatement, or symmetric misreporting), mortality rates at the oldest ages are biased downward (i.e., old-age longevity is overestimated).
External evaluation indicates that age exaggeration tends to bias census counts at older ages upward in Costa Rica. One study suggested that the population aged 80 years and older in the 1984 census was overcounted by as much as 50% (Ministerio de Planificación Nacional y Politica Económica, U.N. Centro Latinoamericano de Demografía, and Dirección General de Estadística y Censos 1988; cited in Rosero-Bixby 2008). Analysis of the 2000 census indicated that the population aged 90 years and older was still overestimated by 20% because of age exaggeration (Instituto Nacional de Estadistica y Censos and Centro Centroamericano de Población 2002; cited in Rosero-Bixby 2008). Another evaluation of the 2000 census found that age exaggeration inflated the population aged 95 and older by 22%, while the population aged 99 and older was overcounted by 42% (Rosero-Bixby, Brenes, and Collado 2004). However, official annual population estimates have been adjusted by the national statistics office for this problem, another reason for us to use these rather than the raw census counts to compute the denominator for the mortality rates.
but it is unclear whether they stem from age exaggeration or from other data problems, such as large net-migration rates, underregistration of deaths, or incomplete enumeration in one or both censuses (see Supplementary archive, S3. Intercensal Cohort Method).
3.2 Relative completeness
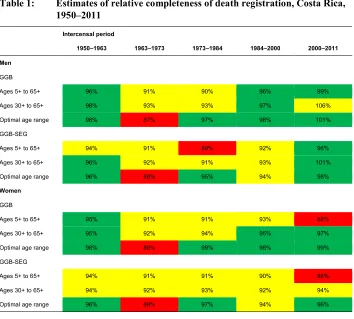
The estimates for GGB and GGB-SEG suggest that coverage of death registration was above 90% in most years, with a few exceptions (Table 1). Estimates for the 1950–1963 period appear surprisingly good. From 1963 to 1984, the results suggest lower levels of relative completeness (less than 90% by some estimates). Although relative completeness looks better in 1984–2000, the results indicate some problems even for the most recent period (2000–2011), particularly among women. The sensitivity of the results to the choice of age range for fitting is especially apparent for women in the most recent period: Estimates based on the optimal age range suggest that relative completeness is good (>95%), whereas estimates based on the age range 5+ to 65+ imply poor (88%) relative completeness. We are suspicious of these estimates because death registration is believed to be virtually complete since 2000. One report suggests that death records were already 92% complete in 1970 and that continuing progress has increased this figure to 99% as early as 1990 (Solano 2009). Also, if deaths were underregistered, we would have expected the underregistration to be concentrated among men rather than women because estimates of mortality for older Costa Rican men are lower than anticipated. Starting around ages 65–70 years, the sex ratio (male/female) in the Costa Rica mortality rates is lower than in other populations, even in those with a smaller sex difference in the expectation of life at birth (e.g., Sweden); data not shown.
2002), but it seems safe to assume that net migration has been positive and fluctuating over the past three to four decades.
Table 1: Estimates of relative completeness of death registration, Costa Rica, 1950–2011
Intercensal period
1950–1963 1963–1973 1973–1984 1984–2000 2000–2011
Men
GGB
Ages 5+ to 65+ 96% 91% 90% 96% 99%
Ages 30+ to 65+ 98% 93% 93% 97% 106%
Optimal age range 98% 87% 97% 98% 101%
GGB-SEG
Ages 5+ to 65+ 94% 91% 89% 92% 96%
Ages 30+ to 65+ 96% 92% 91% 93% 101%
Optimal age range 96% 88% 95% 94% 98%
Women
GGB
Ages 5+ to 65+ 95% 91% 91% 93% 88%
Ages 30+ to 65+ 95% 92% 94% 95% 97%
Optimal age range 98% 88% 99% 98% 99%
GGB-SEG
Ages 5+ to 65+ 94% 91% 91% 90% 88%
Ages 30+ to 65+ 94% 92% 93% 92% 94%
Optimal age range 96% 89% 97% 94% 96%
Note: These estimates are calculated using the DDM R package developed by Tim Riffe based on deaths and the official population estimates (not the original census counts). Estimates of completeness between 95% and 105% are highlighted in green, values of 90–94.9% or 105.1–110% are highlighted in yellow, and values below 90% or above 110% are highlighted in red.
fitting because the degree of violation of the method’s basic assumptions (with regard to migration in particular) varies across the age range. For example, when we estimated relative completeness for Swedish women in 2000–2011 (where we expect data to be virtually perfect), the GGB estimates ranged from 85% to 98% and the GGB-SEG estimates ranged from 83% to 97% depending on the ages used for fitting. It is thus difficult to determine whether the GGB and GGB-SEG estimates of completeness are in fact meaningful in Costa Rica given the international migration trends.
The GGB and GGB-SEB estimates for Costa Rican men during 2000–2011 imply that relative completeness is as good as, or even better than, some HMD countries (i.e., Australia, Canada, Luxembourg, the Netherlands, and the United States) in the most recent time period. For Costa Rican women, it depends on the age range used for fitting: For ages 5+ to 65+, estimated completeness for 2000–2011 appears to have been worse than any HMD country, but for the optimal age range (35+ to 75+), estimated completeness appears to have been as good as many HMD countries.
3.3 Comparing Costa Rica mortality estimates across all sources
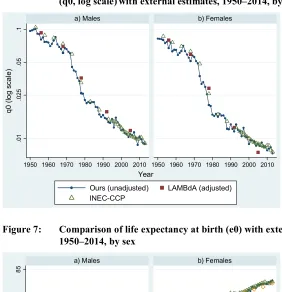
Prior to 1980, our estimates of the probability of dying in the first year of life (q0) are lower than those provided by INEC-CCP and LAMBdA (Figure 6). After 1980, our estimates are similar to INEC-CCP, but the estimates for men are still lower than in LAMBdA (Figure 6). Surprisingly, the LAMBdA estimate for women in 2005 is notably lower than both our estimate or the one from INEC-CCP, although the absolute difference between the LAMBdA estimate of q0and our own estimate is very small (i.e., less than 1.5 per thousand). The rapid decline in the infant mortality rate in Costa Rica – from a high of around 90 per thousand in 1950 down to less than 8 per thousand in 2015 (Instituto Nacional de Estadística y Censos 2017b) – appears to be real.
Figure 6: Comparison of the probability of dying in the first year of life (q0, log scale) with external estimates, 1950–2014, by sex
Figure 7: Comparison of life expectancy at birth (e0) with external estimates, 1950–2014, by sex
.0
1
.025
.05
.1
1950 1960 1970 1980 1990 2000 2010 1950 1960 1970 1980 1990 2000 2010
a) Males b) Females
Ours (unadjusted) LAMBdA (adjusted) INEC-CCP
q
0
(lo
g scal
e)
Year
55
6
5
75
8
5
1950 1960 1970 1980 1990 2000 2010 1950 1960 1970 1980 1990 2000 2010
a) Males b) Females
Ours (unadjusted) LAMBdA INEC-CCP UNPD
e0
Our estimates ofe0are closer to the INEC-CCP estimates in the 1970s and 1980s, but they are still substantially higher than those from LAMBdA and UNPD by as much as 4.6 years. Since 2000, our estimates are similar to the INEC-CCP and UNPD estimates, but the LAMBdA estimates suggest much lowere0even as recently as 2005. The LAMBdA estimates of life expectancy in 2005 (73.7 years for men and 78.7 years for women) are more than 2.5 years lower than ours, which are the same as INEC-CCP’s (76.4 for men and 81.2 for women). Our estimatede0 for women in 2005 would put Costa Rica on par with UK women, whereas the LAMDdA-adjusted estimate implies a level of life expectancy closer to that of Estonian women in that same year. A comparison of HMD estimates ofe0for Chile (the only Latin American country in the HMD) in 2006 with the corresponding LAMBdA estimates indicates a difference of similar magnitude (with the LAMBdA estimate 2.5 years lower than the HMD for men and 2.7 years lower for women), even though demographic statistics are believed to have been of high quality in Chile (Núñez and Icaza 2006).
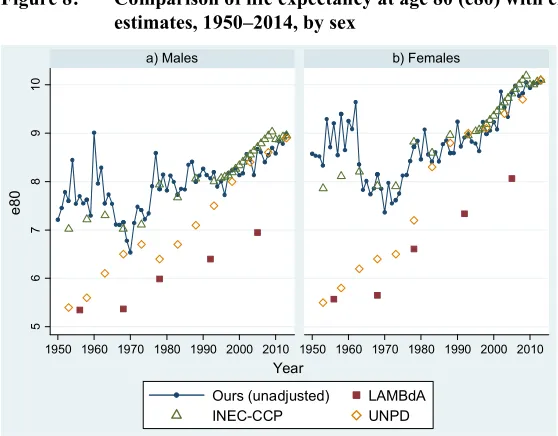
Figure 8: Comparison of life expectancy at age 80 (e80) with external estimates, 1950–2014, by sex
4. Mortality trends compared with other countries
4.1 Life expectancy at birth (e0)
At the beginning of the data series (1950), life expectancy at birth in Costa Rica fell near to the bottom of the range defined by HMD countries (25 with data for 1950) but increased rapidly, between 1950 and 1980 in particular (Figure 9). By 2013, Costa Rican men (with an unadjustede0 of 77.8 years) would rank 25thamong the 38 HMD countries (listed from the lowest to the highest level of life expectancy at birth), between Slovenia and Taiwan. For women, Costa Rica (at 82.3 years) would rank 26th, between Denmark and the Czech Republic.
5
6
7
8
9
10
1950 1960 1970 1980 1990 2000 2010 1950 1960 1970 1980 1990 2000 2010
a) Males b) Females
Ours (unadjusted) LAMBdA
INEC-CCP UNPD
e
80
Figure 9: Life expectancy at birth (e0), Costa Rica (unadjusted and adjusted estimates, shown in red) compared with HMD populations (shown in other colors), 1950–2015, by sex
Our current (unadjusted) estimate ofe0 for Costa Rica (79.9 years in 2013, both sexes combined) is higher than the United States (78.9 in 2015) but lower than the United Kingdom (80.9 in 2013) and well below Japan, the leader in life expectancy (83.8 in 2014).
4.2 Life expectancy at age 80 (e80)
Iceland. Between 1950 and 1970,e80 in Costa Rica appeared to have declined, which likely results from improved data quality as previously mentioned: In the early part of the data series e80 was probably overestimated in Costa Rica because of age exaggeration and/or incomplete death registration.
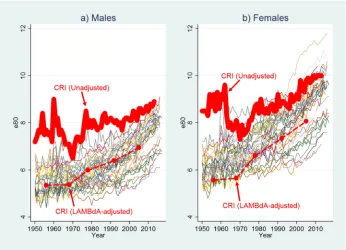
Figure 10: Life expectancy at age 80 (e80), Costa Rica (unadjusted and adjusted estimates, shown in red) compared with HMD populations (shown in other colors), 1950–2015, by sex
4.3 Relationship between child and older-age mortality
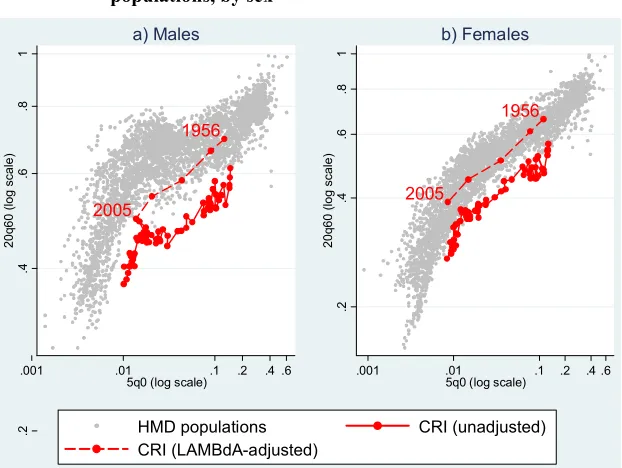
In Figure 11, we plot the relationship between child mortality (as captured by the probability of dying in the first five years of life,5q0) and older-age mortality (measured by the probability of dying between ages 60 and 80,20q60) for Costa Rica alongside all HMD populations for all years available (i.e., back to the mid-1800s for Sweden). Clearly there is a direct relationship between child and early old-age mortality as the HMD estimates are clustered within an elongated point cloud. Over time, the estimates for any given country are likely to proceed from the upper right corner of the graph (high child and high older-age mortality) toward the lower left corner (lower levels of both child and older-age mortality).
Figure 11: Child mortality (5q0, log scale) by old-age mortality (20q60, log scale), Costa Rica (unadjusted and adjusted) compared with HMD populations, by sex
For both women and men, Costa Rica is a clear outlier: At any given level of child mortality, mortality between ages 60 and 80 (based on our unadjusted estimates) falls well outside the range of HMD estimates even for the most recent years. This unusual pattern could reflect a problem of data quality. It could stem from overestimation of
1956 2005 .2 .4 .6 .8 1 20q 60 ( log scale)
.001 .01 .1 .2 .4 .6
5q0 (log scale) a) Males 1956 2005 .2 .4 .6 .8 1 20q 60 ( log scale)
.001 .01 .1 .2 .4 .6 5q0 (log scale)
b) Females
mortality below age 5 (5q0), although it is rare for child mortality to be overestimated; typically, the problem is underestimation because of incomplete registration of infants who died shortly after birth, but it is possible that the adjustment of census population counts carried out by the national statistics office below age 5 was insufficient, which would produce this pattern. Alternatively, it could result from the underestimation of mortality between the ages of 60 and 80 years (20q60) owing to uncomplete coverage of death registration or to age exaggeration, which has been shown to be widespread in Latin America (Palloni, Pinto-Aguirre, and Beltrán-Sánchez 2015).
4.4 Pattern of mortality at higher ages in comparison with Sweden
Vaino Kannisto, renowned for his analysis of old age mortality, suggested looking at the ratios of mortality indicators at higher ages to assess their validity. Following this strategy, we selected Sweden for comparison as the excellent quality of demographic data in this country has been demonstrated (Statistiska Centralbyrån 1969; Wilmoth and Lundström 1996). We compared the relationship between life expectancy at birth and three sets of life table ratios: the ratio of the number of person-years lived at ages 100 and above (T100) to the number of person-years lived at ages 80 and above (T80); the ratio of the number of person-years lived at ages 85 and above (T85) to the number of person-years lived at ages 70 and above (T70); and the ratio of the probability of dying between the ages of 65 and 80 (15q65) to the expectation of life at age 80 (e80; see Supplementary archive, S4. Figures S1–S3). The first two ratios are much higher in Costa Rica compared to Sweden at the same level of life expectancy at birth, while the third ratio is much lower in Costa Rica than in Sweden. Thus, mortality at the oldest ages is lower than we would expect based on the age pattern of mortality observed in Sweden.
5. Intercountry comparisons with LAMBdA life tables
In Figures 9 and 10, we also show the adjusted estimates fore0 ande80 from LAMBdA alongside our own unadjusted estimates for Costa Rica and HMD countries. The LAMBdA-adjusted estimates suggest that in 1950 e0in Costa Rica was as low as or lower than in any HMD country and that e80 ranked near the bottom. By 2005, Costa Rica ranked near the middle of the pack in terms of bothe0ande80.
LAMBdA estimates fall well within the range defined by the HMD estimates, though for men they are still at the bottom of the range in the most recent years. However, plausibility does not necessarily mean accuracy, and the documentation available for LAMBdA is too general to determine if the methods implemented to produce mortality indicators in this database were selected because they yielded reasonable estimates or if these are indeed closer to the reality than our unadjusted estimates.
6. Conclusion and discussion
Using the HMD methods, which were developed for countries with full demographic coverage and reliable vital registration systems, we find that life expectancy at birth in Costa Rica has risen from 59.3 years in 1950 to 79.9 years in 2013, a level higher than in several high-income countries. Although our estimates indicate that Costa Ricans are long-lived, analysis of mortality trends and patterns as well as comparisons with other estimates suggest that longevity in Costa Rica may be overestimated.
Compared with estimates constructed by others who have adjusted for relative completeness and age misreporting, our life expectancy estimates are substantially higher, especially prior to 1980. Mortality at older ages is even more unusual when compared with other estimates for Costa Rica and with other high-income countries. In particular, Costa Rica exhibits surprisingly low old-age mortality relative to child mortality, falling well outside the range defined by 38 high-income countries in the HMD.
Our analysis suggests that mortality among the oldest Costa Ricans is almost certainly underestimated prior to 1984, probably because of some combination of incomplete census coverage, incomplete death registration, and age exaggeration. For the more recent period, we cannot draw a definitive conclusion regarding the reliability of the estimates because the evidence is circumstantial and because other studies suggest that Costa Ricans might in fact enjoy unusually low mortality at older ages (Payne 2015; Rosero-Bixby 2008, 2018; Rosero-Bixby and Dow 2009). For example, a prior study that carefully selected birth, death, and population data based on accuracy to compute mortality at ages 90 and over using the Extinct Cohort method found old-age mortality that was higher (i.e., life expectancy was lower) than what official estimates would suggest (Rosero-Bixby 2008). Nonetheless, life expectancy at age 90 among men was still about half a year higher in this study than for any other country, while corresponding estimates for women would put Costa Rica on par with two countries at the top of the distribution (i.e., Japan and the United States).
published estimates of net migration (Instituto Nacional de Estadística y Censos 2013), demographers admit that there is a problem of undocumented migration in Costa Rica since the 1980s, and thus, they do not know whether the net-migration figures are accurate (Brenes 2016, personal communication). Unaccounted migration may jeopardize the accuracy of adjustment methods, resulting in biased estimates. Migration assumptions are crucial in the implementation of evaluation and adjustment methods. In general, methods such as DDM may be useful for detecting gross errors, but it may be risky to rely on them for fine-tuning estimates, particularly in populations where the assumptions underlying the methods are violated. Although measures of relative completeness suggest some inconsistencies, it is difficult to determine if they truly represent data deficiencies or are simply the result of violations in the method’s assumptions.
Part of the apparent longevity advantage of Costa Ricans may be an artifact of data deficiencies. The pattern of declining levels of e80 during 1950–1970, when e0 was rapidly increasing, is particularly suspicious. The most likely explanation for this pattern is improvement in age reporting throughout this period, which is supported by prior external evaluation of the census counts (Ministerio de Planificación Nacional y Politica Económica, U.N. Centro Latinoamericano de Demografía, and Dirección General de Estadística y Censos 1988; cited in Rosero-Bixby 2008). In any event, variability in the level of mortality estimated by diverse institutions together with unusual mortality patterns suggest that only in a context of improved reliability of the basic national statistics will we be able to determine with certainty the level of life expectancy in Costa Rica.
7. Acknowledgements
References
Barbieri, M., Wilmoth, J.R., Shkolnikov, V.M., Glei, D.A., Jasilionis, D., Jdanov, D., Boe, C., Riffe, T., Grigoriev, P., and Winant, C. (2015). Data resource profile: The Human Mortality Database (HMD). International Journal of Epidemiology 44(5): 1549–1556.doi:10.1093/ije/dyv105.
Beltrán-Sánchez, H., Palloni, A., Pinto-Aguirre, G., and Verhulst, A. (2018). The Latin American Mortality Database (LAMBdA): Methodological document, preliminary version [electronic resource]. Madison: University of Wisconsin.
https://www.ssc.wisc.edu/cdha/latinmortality/wp-content/uploads/LAMBdA_ documentation.pdf.
Bennett, N.G. and Horiuchi, S. (1981). Estimating the completeness of death registration in a closed population. Population Index 47(2): 207–221.
doi:10.2307/2736447.
Bennett, N.G. and Horiuchi, S. (1984). Mortality estimation from registered deaths in less developed countries. Demography21(2): 217–233.doi:10.2307/2061041. Borges, G. and Sacco, N. (2016).Has census coverage in Latin America improved with
time? Paper presented at the International Seminar on Registering and Counting
the Population: The production and exploration of census information from early modern times to the end of 20th century, IUSSP and NEPO-UNICAMP, Campinas, Brazil, May 19–21, 2016.
Brass, W. (1975). Methods for estimating fertility and mortality from limited and defective data: Based on seminars held 16–24 September 1971 at the Centro
Latinoamericano de Demografía (CELADE), San José, Costa Rica. Chapel Hill:
International Program of Laboratories for Population Statistics, Department of Biostatistics, University of North Carolina at Chapel Hill.
Centro Centroamericano de Población (2013). Evaluación demográfica del X Censo Nacional de Población de Costa Rica 2011 y de otras fuentes de información. San José: Centro Centroamericano de Población, Universidad de Costa Rica. Centro Centroamericano de Población (2017a). Biblioteca virtual en población y salud
[electronic resource]. San José: Centro Centroamericano de Población, Universidad de Costa Rica.http://biblioteca.ccp.ucr.ac.cr.
Centro Centroamericano de Población (2017c). Tabla completa de mortalidad: Costa Rica 1950–55, 1955–60, …2005–10 [electronic resource]. San José: Centro Centroamericano de Población, Universidad de Costa Rica.http://ccp.ucr.ac.cr/ observa/CRindicadores/TVcompletas.html.
Elo, I.T. and Preston, S.H. (1994). Estimating African-American mortality from inaccurate data. Demography31(3): 427–458.doi:10.2307/2061751.
Hill, K. (1987). Estimating census and death registration completeness. Asian Pacific
Census Forum1(3): 8–24.
Hill, K., You, D., and Choi, Y. (2009). Death distribution methods for estimating adult mortality: Sensitivity analysis with simulated data error. Demographic Research 21(9): 235–254.doi:10.4054/DemRes.2009.21.9.
Institute for Health Metrics and Evaluation (2016). Global Burden of Disease Study 2015 (GBD 2015) results [electronic resource]. Seattle: Institute for Health Metrics and Evaluation.http://ghdx.healthdata.org/gbd-results-tool.
Instituto Nacional de Estadística y Censos (2009). Esperanza de vida al nacer, a los 20 y a los 65 años de edad, Costa Rica 1930‒2008 [electronic resource]. San José: INEC. http://ccp.ucr.ac.cr/observa/CRindicadores/evida.html (accessed 13 November 2009).
Instituto Nacional de Estadística y Censos (2013). Estimaciones y proyecciones de
población por sexo y edad 1950–2050. San José: INEC, Centro
Centro-americano de Población.
Instituto Nacional de Estadística y Censos (2017a). Tablas completas de mortalidad 1995, 1996, …2015 [electronic resource]. San José: INEC. http://www.inec. go.cr/sites/default/files/documentos/poblacion/mortalidad/estadisticas/resultados /repoblacevYYYY-01.xls (whereYYYY=Year).
Instituto Nacional de Estadística y Censos (2017b). Cuadro 1: Principales indicadores demográficos, 1950–2015, Tasa global de fecundidad [electronic resource]. San José: INEC. http://www.inec.go.cr/sites/default/files/documetos-biblioteca-virtual/sepoblacev1950-2015-01.xls.
Instituto Nacional de Estadística y Censos and Centro Centroamericano de Población (2002). Costa Rica: Estimaciones y proyecciones de población 1970–2050 actualizados al año 2000 y evaluación del censo del 2000 y otras fuentes de
IUSSP-UNFPA (2017a). The generalized growth balance method: Tools for demographic estimation [electronic resource]. Paris: IUSSP. http://demo graphicestimation.iussp.org/content/generalized-growth-balance-method. IUSSP-UNFPA (2017b). Synthetic extinct generations methods: Tools for demographic
estimation [electronic resource]. Paris: IUSSP. http://demographicestimation. iussp.org/content/synthetic-extinct-generations-methods.
Latin America and the Caribbean Demographic Observatory (2007). Mortality: Methodology of mortality estimates and projections by age and sex. Santiago: CEPAL/ECLAC, United Nations.
Li, N. and Gerland, P. (2016). Evaluating the completeness of death registration for
developing countries at old age. Paper presented at the United Nations Expert
Group Meeting on ‘Methodology and lessons learned to evaluate the completeness and quality of vital statistics data from civil registration,’ New York, USA, November 3–4, 2016.
Lima, E., Queiroz, B., and Riffe, T.L. (2016). R implementations of three growth balance methods for estimating adult mortality coverage [electronic resource]. San Francisco: GitHub.https://github.com/timriffe/AdultCoverage.
Ministerio de Planificación Nacional y Politica Económica, UN Centro Latinoamericano de Demografía, and Dirección General de Estadística y Censos (1988).Costa Rica: Estimaciones y proyecciones de población 1950–2025. San José: Imprenta Nacional.
Núñez, M.L. and Icaza, M.G. (2006). Quality of mortality statistics in Chile, 1997– 2003.Revista Médica Chile 134(9): 1191–1196.
Palloni, A., Beltrán-Sánchez, H., and Pinto Aguirre, G. (2017). Incertidumbre de los estimadores de mortalidad y pruebas de hipótesis: El caso de América Latina y el Caribe, 1850–2010. Notas de Población 44(104): 13–32. doi:10.18356/ e68ff37c-es.
Palloni, A., Pinto, G., and Beltrán-Sánchez, H. (2015). Chapter 2: Estimation of life tables 1850–2010: Adjustments for relative completeness and age misreporting.
In: Two centuries of mortality decline in Latin America: From hunger to
longevity. Madison: University of Wisconsin: 3–75.
Payne, C.F. (2015). Aging in the Americas: Disability-free life expectancy among adults aged 65 and older in the United States, Costa Rica, Mexico, and Puerto Rico.The Journals of Gerontology Series B: Psychological Sciences and Social
Science 73(2): 337–348.doi:10.1093/geronb/gbv076.
Preston, S.H., Elo, I.T., and Stewart, Q. (1999). Effects of age misreporting on mortality estimates at older ages. Population Studies53(2): 165–177.doi:10.10 80/00324720308075.
Rosero-Bixby, L. (2008). The exceptionally high life expectancy of Costa Rican nonagenarians. Demography45(3): 673–691.doi:10.1353/dem.0.0011.
Rosero-Bixby, L. (2018). High life expectancy and reversed socioeconomic gradients of elderly people in Mexico and Costa Rica.Demographic Research 38(3): 95– 108.doi:10.4054/DemRes.2018.38.3.
Rosero-Bixby, L., Brenes Camacho, G., and Chen-Mok, M. (2002). Fecundidad diferencial e inmigrantes Nicaragüeneses en Costa Rica.Notas de población 74: 27–51.
Rosero-Bixby, L., Brenes, G., and Collado, A. (2004). Tablas de vida para cálculo actuarial de rentas vitalicias y retiro programado: Costa Rica circa 2000.
Población y Salud en Mesoamérica1(2): 173–205.
Rosero-Bixby, L. and Dow, W.H. (2009). Surprising SES gradients in mortality, health, and biomarkers in a Latin American population of adults. Journals of
Gerontology Series B: Psychological Sciences and Social Sciences 64(1): 105–
117.doi:10.1093/geronb/gbn004.
Shryock, H.S., Siegel, J.S., and Larmon, E.A. (1973). The methods and materials of
demography. Suitland: US Bureau of the Census.
Solano, E. (2009). Evaluacíon censal con métodos indirectos: Experiencia de Costa
Rica. Paper presented at Conferencía Estadistica de las Américas – CEA
CEPAL, Santiago, Chile, June 3–5, 2009.
Statistiska Centralbyrån (1969). Brief historical survey of the organization of the Swedish population statistics. In: Historisk statistisk för Sverige del 1:
Befolkning, andra upplagan 1720–1967. Stockholm: Statistiska Centralbyrån:
10–11.
United Nations Statistics Division (2017). Coverage of civil registration system, births and deaths [electronic resource]. New York: United Nations. https://unstats. un.org/unsd/demographic-social/crvs.
United Nations, Department of Economic and Social Affairs, Population Division (2015). World population prospects: The 2015 revision, DVD edition [electronic resource]. New York: United Nations. https://esa.un.org/unpd/wpp/ Download/Standard/Mortality.
United Nations, Department of Economic and Social Affairs, Population Division (2017). World population prospects 2017 [electronic resource]. New York: United Nations.https://esa.un.org/unpd/wpp/Download/Standard/Mortality. University of California, Berkeley and Max Planck Institute for Demographic Research
(2016). Human mortality database [electronic resource]. Berkeley: University of California, Berkeley.https://www.mortality.org.
Wang, H., Naghavi, M., Allen, C., Barber, R.M., Carter, A., Casey, D.C., Charlson, F.J., Chen, A.Z., Coates, M.M., Coggeshall, M., and Dandona, L. (2016). Global, regional, and national life expectancy, all-cause mortality, and cause-specific mortality for 249 causes of death, 1980–2015: A systematic analysis for the Global Burden of Disease Study 2015. The Lancet388(10053): 1459–1544.
doi:10.1016/S0140-6736(16)31012-1.
Wilmoth, J.R., Andreev, K., Jdanov, D., Glei, D.A., Boe, C., Bubenheim, M., Philipov, D., Shkolnikov, S., and Vachon, P. (2007). Methods protocol for the human mortality database, version 5 [electronic resource]. Berkeley: University of California, Berkeley.https://v5.mortality.org/Public/Docs/MethodsProtocol.pdf.
Wilmoth, J.R., Andreev, K., Jdanov, D., Glei, D.A., Riffe, T., Boe, C., Bubenheim, M., Philipov, D., Shkolnikov, S., Vachon, P., Winant, C., and Barbieri, M. (2017). Methods protocol for the human mortality database, version 6 [electronic resource]. Berkeley: University of California, Berkeley. https://www.mortality. org/Public/Docs/MethodsProtocol.pdf.
Wilmoth, J.R. and Lundström, H. (1996). Extreme longevity in five countries: Presentation of trends with special attention to issues of data quality.European
Journal of Population 12(1): 63–93.doi:10.1007/BF01797166.
World Health Organization (2014). Life expectancy at birth, WHO Data; downloaded from UNdata [electronic resource]. Geneva: World Health Organization.