JIEMS
Journal of Industrial Engineering and Management Studies
Vol. 3, No. 1, pp. 1 - 14
www.jiems.icms.ac.ir
Analysis of the simultaneous effects of renewable energy
consumption and GDP, using Dynamic Panel Data
A.M. Kimiagari1, F. Lotfian Delouyi1, M. Shabani1,*
Abstract
In the recent years, renewable energy sources are an important component of world energy consumption. GDP is one of the main measures of a country’s economic activity. Most of the studies examine the impact of renewable energy consumption on GDP with single equation model and the others use dynamic panel data. Since the Granger causality analysis’s findings of this paper establish bidirectional causality between GDP and renewable energy consumption, the purpose of this study is to develop a simultaneous-equations model to explore the interaction between GDP and renewable energy consumption in a dynamic panel data. This model uses GDP and renewable energy consumption as endogenous variables and seven factors as exogenous variables. By using a dynamic panel data of 34 OECD countries from 1990 to 2012, the model is estimated by using the two-stage least-squares method. The results confirm the important influence of renewables and non-renewables as well as capital and labor force on GDP in OECD countries. Based on the results, both GDP and real oil price play an important role in renewable energy consumption. Our findings suggest that energy planners and policy makers need to increase renewable energy investment to ensure sustainable economic development in future.
Keywords: Simultaneous Equations, GDP, Renewable energy consumption, Panel Data.
Received: Feb2016-01
Revised: Dec 2016-10
Accepted: Dec2016-18
1.
Introduction
Over the recent years, a number of studies have examined the relationship between energy consumption and economic growth. GDP is one of the main measures of macro-economy. Because not only as the most important indicator of economic performance analyzes and assessments used, but many other items that are considered macroeconomic by products measured.
Gross Domestic Product (GDP) is a measure of economic growth. GDP gives us the total market value of all final goods and services produced within a country’s borders in a specific time period – monthly, quarterly or annually. The main reasons have compelled government policies to develop low-fossil-fuel economies and improve energy efficiency are fossil-fuel shortage, climate change and global warming.
* Corresponding Author.
Journal of Industrial Engineering and Management Studies (JIEMS), Vol. 3 , No. 1 Page 2
Reduction of energy cost and carbon dioxide emissions (CO2) are the primary expected
achievements of energy efficiency. Therefore renewable energy is becoming an increasingly substantial source of alternative energies. Renewable energies are planned to be the fastest growing source of energy between now and 2030 (Omri & Nguyen 2014).
Solar energy is one of the cleanest renewable energy sources. It was in use much earlier before humans even learn how to light a fire. The other important renewable energy is Wind energy that has least negative impacts on the environment. ‘Geo’ means Earth and “thermal” means energy. Geothermal energy means energy drawn or harnessed from beneath the earth. It is completely clean and sustainable. Solar energy is produced by sun and wind energy is produced by moving of winds. The heat caused by sun drives the wind. The wind turbines can convert the kinetic energy in the wind into electricity. The energy of the flowing water can be captured and called as hydroelectric power. This is the process by which an alternative energy is generated. The earth grants many power sources. Just like the geothermal and solar energy, which have been used in heating homes and lighting for centuries.
Renewable Energy is a fundamental part of the energy sector and because of benefits provided to the society and economy their role is increasing with reference to data of international Energy agency. Renewable Energy accounted for 13.1% in global total primary energy supply (further in the next TPES, Total Primary Energy Supply) in 2004 and 2009. However, it is expected to increase the share of fossil energy sources such as oil, coal and natural gas (Müller et al. 2011). Biomass and waste are the noticeable types of Renewable Energy, representing 9.9% in global TPES and 75.9% in global Renewable Energy supply in 2009. However, their share in global Renewable Energy has a decreasing trend. The second largest type of Renewable Energy is Hydro. It accounted for 2.3% in global TPES and 17.7% in global Renewable Energy supply in 2009. This is by 0.1 and 1.0 percentage points less than in 2004. It is expected that during 2009-2035 the volume of hydro power will be increasing by 2.1% a year and will exceed the growth rates of fossil fuel and nuclear energy; however, the share of it will have a tendency to reduce (Müller et al. 2011).
The third largest type of Renewable Energy in the world is geothermal energy. It provided 3.9% in global Renewable Energy supply in 2009. This is by 0.7 percentage points more than in 2004. The contribution of wind, solar and tide energies is still minor with respect to data of International Energy Agency. They accounted for 0.3% in world TPES and 2.5% in global Renewable Energy supply. Because of the rapid development of wind, solar and geothermal capacities in future, the share of these types of energies will triple, i.e. will increase till 22.4% (2035) in the structure of global Renewable Energy supply (Müller et al. 2011).
The data provided by the international Energy Agency showed that during 1990-2009 renewable energy sector grew at an average annual rate of 1.8%, which was slightly higher than the growth rate of global TPES (1.7% a year). Growth rates were particularly high for solar photovoltaic (further in the next PV) (43.5% a year) and wind power (25.1% a year). However, this is due to the fact that their bases were very low in 1990. Biogas had the next highest growth rate (14.9%) a year, followed by the liquid biofuels and solar thermal, which both grew at 10.0% a year. Solid biofuels (including charcoal) experienced the lowest growth (1.2% a year) among the Renewable Energy (Müller et al. 2011)
International energy agency expects the renewable energy sector will remain one of the fastest growing energy sectors in the world during the next two decades. It will grow at an average annual growth rate of 2.5% when the world primary energy demand will increase by half as big (by 1.3% a year), and will guarantee for future generations the supply of energy. But seeking that this will be realized additional new investment is required (Müller et al. 2011).
Journal of Industrial Engineering and Management Studies (JIEMS), Vol. 3 , No. 1 Page 3
and both of them will have great impact on the economy. In this paper, a two-way communication between GDP and consumption of renewable energy is expected to be examined. The reminder of this article is organized as follows. Section2 presents the Literature review, section 3 reports the data and model designing and section 4 reports methodology and model estimation. Section 5 is about empirical Findings of simultaneous equations model and section 6 concludes the article.
2.
Literature Review
The relation between energy and economic growth has been investigated in several studies using diverse approaches. However, there has been a lot of divergence in the results obtained Bash (2015). Zhang and Cheng (2009) analyzed the existence and direction of Granger causality between economic growth, energy consumption, and carbon emissions in china from 1960 to 2007. Their results indicate the existence of a unidirectional Granger causality running from GDP to energy consumption, and a unidirectional Granger causality running from energy consumption to carbon emission in the long run. Which suggest that neither carbon emissions nor energy consumption leads to economic growth.
The hypothesis of causality between energy consumption and economic growth has also demonstrated to be neutral in several studies. Using the same methodology, Yildirim et al. (2014) applied the Toda Yamamoto procedure and bootstrap-corrected causality test in order to analyze the causality between renewable energy and economic growth in the USA. They also found no causality between economic growth and total renewable energy consumption.
Ocal & Aslan (2013) found that renewable energy consumption has a negative impact on economic growth for the case of Turkey. Chang et al. (2009) attempted to investigate the development of renewable energy sector under different economic growth rate regimes by applying panel threshold regression (PTR) model in OECD member-countries. The results showed that countries with high economic growth are able to increase the renewable energy use, while countries with low-economic growth are unable to grow the consumption of renewable energy.
Apergis & Payne (2010a) used panel co-integration and error correction model to study the causality relationship between renewable energy and economic growth for twenty OECD countries. According to their findings, there is a long run equilibrium relationship between real GDP, renewable energy consumption, real gross fixed capital formation and the labor force. They also found bi-directional causality for long and short run between renewable energy and growth. Similar results were found for the case of Eurasia Apergis & Payne (2010c).
Employing similar methodology, Apergis & Payne (2011a) found the existence of unidirectional causality running from economic growth to renewable electricity consumption in the short term and also bidirectional causality between these variables in the long term in emerging economies. Tugcu et al. (2012a) investigated the relationship between renewable and non-renewable energy consumption and economic growth in the G7 countries. They employed Autoregressive Distributed Lag approach to co-integration and found that both renewable and non-renewable energy are Important for economic growth with bidirectional causality for all G7 countries. Similar results were provided by Pao & Fu (2013) and Ohler & Fetters (2014).
Journal of Industrial Engineering and Management Studies (JIEMS), Vol. 3 , No. 1 Page 4
GDP growth to renewable energy consumption for 2% of the countries, and failed to establish long run relationship between these Variables for 19% of the countries. This study pointed out that the level of significance of the bidirectional long run relationship between the variables is gradually more important while moving from the low Income to the high income countries. Magnani & Vaona (2013) adopted panel data unit root and co-integration as well as Granger non causality tests based on the system GMM estimator for studying Relation between renewable energy generation and economic growth at regional level in Italy. They found that renewable energy generation has appositive impact on economic growth by reducing constraint on Balance of payments and exposure to the volatility of fossil fuels price.
Sadorsky (2009a) analyzed the relationship between renewable energy and economic growth in emerging countries. He stated that growth in Income has a significant effect on increasing renewable energy consumption. But in the contrary, results from Marques & Fuinhas (2012) suggested negative impact of using renewable energy on economic growth and that in turn, economic growth does not contribute To increased renewable energy consumption. Based on the literature surveyed and to the best of our knowledge, research on the relationship between renewable energy consumption and economic growth is still limited and results provided are not unanimous.
Our objective here is to review the scant literature on the role of renewable energy in explaining sustainable economic growth. A bi-directional causation was established between renewable energy consumption and economic growth by Miech & Papiez, (2014) for emerging economies. Sadorsky (2009b) reports that in the long run, a 1% increase in real income per capita increased the consumption of renewable energy per capita by approximately 3.5% for these economies. Payne (2009)analyzed the sectorial causal relationship between renewable and non-renewable energy consumption and Economic growth in the US. Their findings established no causality between renewable energy consumption and real GDP in the commercial and industrial sectors, while positive uni-directional causality exists from residential renewable energy consumption to real GDP. On renewables, there are only a few studies examining the effects of biomass biofuels on the environment with varying results. Bilgili & Ozturk (2015a) reviewed this literature and investigated 51 African countries. They found that a 1% increase in biomass will increase GDP by 0.82% in these countries.
Journal of Industrial Engineering and Management Studies (JIEMS), Vol. 3 , No. 1 Page 5
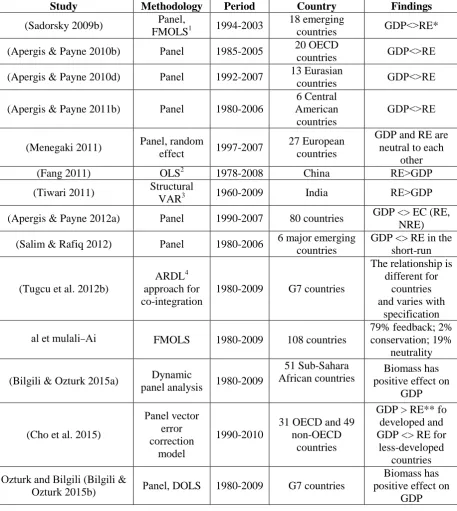
Table 1: Recent researches on Renewable Energy Consumption and GDP
Findings Country Period Methodology Study GDP><RE* 18 emerging countries 1994-2003 Panel, FMOLS1 (Sadorsky 2009b) ER>><DG 20 OECD countries 1985-2005 >enaP (Apergis & Payne 2010b)
ER>><DG 13 Eurasian
countries 1992-2007
>enaP (Apergis & Payne 2010d)
ER>><DG 6 Central American countries 1980-2006 >enaP (Apergis & Payne 2011b)
GDP and RE are neutral to each
other 27 European countries 1997-2007 Panel, random effect (Menegaki 2011) DG<ER> China 1978-2008 OLS2 (Fang 2011) DG<ER> India 1960-2009 Structural VAR3 (Tiwari 2011)
GDP <> EC (RE, NRE) 80 countries
1990-2007 >enaP
(Apergis & Payne 2012a)
GDP <> RE in the short-run 6 major emerging
countries 1980-2006
>enaP (Salim & Rafiq 2012)
The relationship is different for
countries and varies with
specification G7 countries 1980-2009 ARDL4 approach for co-integration (Tugcu et al. 2012b)
79% feedback; 2% conservation; 19% neutrality 108 countries 1980-2009 FMOLS iA -ilPePA ae eP Biomass has positive effect on
GDP 51 Sub-Sahara African countries 1980-2009 Dynamic panel analysis (Bilgili & Ozturk 2015a)
GDP > RE** fo developed and GDP <> RE for
less-developed countries 31 OECD and 49
non-OECD countries 1990-2010 >enaP vector error correction model (Cho et al. 2015)
Biomass has positive effect on
GDP G7 countries 1980-2009 >enaP, DOLS iAPgAPA ena
krelzO (Bilgili & Ozturk 2015b)
* GDP <> RE Bi-directional relation- ship between GDP and RE. ** GDP > RE Uni-directional causality exists from GDP to RE.
Data in the econometric models include time-series or cross-sectional data separately. It requires the use of time series data at a specific section. Using of panel data was the new method and using conventional methods and systems of equations modeling began.
1 Fully Modified Ordinary Least Squares 2 Ordinary Least Squares
3
Variance
Journal of Industrial Engineering and Management Studies (JIEMS), Vol. 3 , No. 1 Page 6
In this paper, Panel data is used in a system equation model, with the case of OECD countries.
3.
Data and Model Designing
Taking GDP and renewable energy consumption as two endogenous variables, this work develops a simultaneous-equations model with two linear form equations, including 2 predetermined variables and seven exogenous variables. The selected variables included in the system are based on the economic theory and available empirical evidence.
An increase in GDP may require more energy consumption and probably decrease the environmental quality. Accordingly, the high GDP should lead to a high level of renewable energy consumption under pressure of environmental depreciation. On the one hand some studies including, among others, Refs. Omri & Nguyen (2014), Apergis & Payne (2012b), Sadorsky (2009a) mainly find that the GDP is an important determinant of renewable energy consumption, but on the other hand some studies propose a production function where, along with traditional inputs, renewable and non-renewable sources of energy are used into the production process (Cerdeira Bento et al. 2016), (Bilgili & Ozturk 2015c), (Apergis & Payne 2011c)
Taking the above discussions into account, we develop, in this study, an empirical system equation that is consistent with the broader literature and available empirical evidence. Taking GDP and renewable energy consumption as two endogenous variables, this work develops a simultaneous-equations model with two linear form equations, including two predetermined variables and seven exogenous variables.
The GDP equation contains 3 exogenous variables, and The REC equation contains the lagged endogenous variable GDP (-2) that is multiplied by a dummy variable and three exogenous variables. The specifications of the simultaneous-equations model are as follows:
GDPit =C1 + C2*GFCFit + C3*LFit + C4*RECit + C5*NRECit+ (1)
RECit = C6 + C7*CO2it + C8*TOit + C9*ROPit + C10*log (GDPit) + 11*dummy*GDPit
(-2) + (2)
The subscripts i (i= 1… N) Denotes the country i in our sample, with N being equal to 34 and t (t = 1, …, T) indicates the time period which T being equal to 23. The error terms, u and , are assumed to be independent and identically distributed with a zero mean and constant variance. Real GDP (constant 2005 US$) as a measure of economic output and real gross fixed capital formation (GFCF)(constant 2005 US$) are used as a proxy for the growth of capital stock, total labor force (LF) is used as a measure of all people who supply labor for the production of goods and services during a specified period. CO2 represents the Carbon dioxide emissions in metric
kilo tons. ROP represents the Brent real oil price in metric $/bbl. To represents the trade openness, measured as exports plus imports as a percentage of GDP. The energy sources are used in this model is renewable energy consumption (REC), and non-renewable energy consumption (NREC) in quadrillion Btu units. The required data on oil price is collected from the U.S. Energy Information Administration (EIA, Energy Information Administration, 2013) and the others are obtained from the World Development Indicators (WDI) online database published by the World Bank (various issues). At the end of this part, it is noticed that dummy variable is equal 1 for high income OECD countries and 0 for others.
Journal of Industrial Engineering and Management Studies (JIEMS), Vol. 3 , No. 1 Page 7
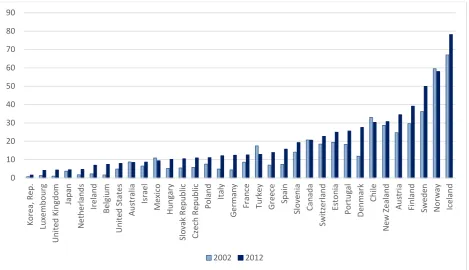
share of renewable energy sources in total final energy consumption in 2002 and 2012 in OECD countries.
For the empirical analysis, this paper uses a balanced panel for 34 OECD countries from 1990 to 2012. The countries are: Australia, Austria, Belgium, Canada, Chile, Czech Republic, Denmark, Estonia, Finland, France, Germany, Greece, Hungary, Iceland, Ireland, Israel, Italy, Japan, Korea, Luxembourg, Mexico, Netherlands, New Zealand, Norway, Poland, Portugal, Slovak Republic, Slovenia, Spain, Sweden, Switzerland, Turkey, United Kingdom and United States.
Figure 2: Share of renewable energy sources in total final energy consumption; 2002 and 2012 in OECD countries
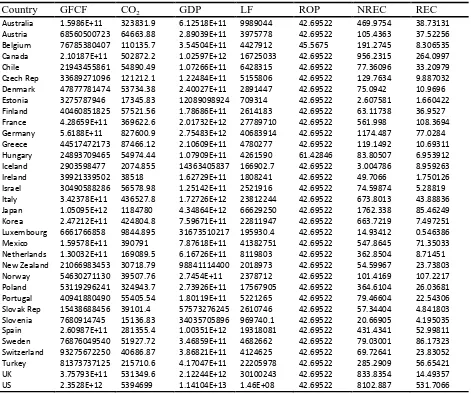
Table 2 presents the average of each variable in our model. There was heterogeneity across countries for these statistics. For example, the average annual real GDP was 1.14104E+13 for United States, followed by Japan (4.34864E+12) and Germany (2.75483E+12). While, the average annual real GDP for Estonia was 12089098924. The highest average annual consumption of renewables is recorded for US (531.7066), Canada (264.0997), France (108.3694) and Norway (107.2217). The three countries with highest annual average percentage of renewable energy were Iceland, Sweden and Norway.
0 10 20 30 40 50 60 70 80 90 Ko re a, R e p . Lu xe mb o u rg Un ite d Kin gd o m Japan N e th e rl an d s Ire lan d Bel gi u m Un ite d S tate s A u str al ia Is rae l Me xi co H u n gary Sl o vak R ep u b lic Cz ec h R ep u b lic Po la n d Italy G e rman y Fr anc e Tu rke y G re ec e Sp ain Sl o ve n ia Can ad a Sw itz er lan d Es to n ia Po rt u gal De n
mark Chile
Journal of Industrial Engineering and Management Studies (JIEMS), Vol. 3 , No. 1 Page 8 Table 1: Average of each variables in the model
Country GFCF CO2 GDP LF ROP NREC REC
Australia 1.5986E+11 323831.9 6.12518E+11 9989044 42.69522 469.9754 38.73131
Austria 68560500723 64663.88 2.89039E+11 3975778 42.69522 105.4363 37.52256
Belgium 76785380407 110135.7 3.54504E+11 4427912 45.5675 191.2745 8.306535
Canada 2.10187E+11 502872.2 1.02597E+12 16725033 42.69522 956.2315 264.0997
Chile 21943455861 54890.49 1.07266E+11 6428315 42.69522 77.36096 33.20979
Czech Rep 33689271096 121212.1 1.22484E+11 5155806 42.69522 129.7634 9.887032
Denmark 47877781474 53734.38 2.40027E+11 2891447 42.69522 75.0942 10.9696
Estonia 3275787946 17345.83 12089098924 709314 42.69522 2.607581 1.660422
Finland 40460851825 57521.56 1.78686E+11 2614183 42.69522 63.11738 36.9527
France 4.28659E+11 369622.6 2.01732E+12 27789710 42.69522 561.998 108.3694
Germany 5.6188E+11 827600.9 2.75483E+12 40683914 42.69522 1174.487 77.0284
Greece 44517472173 87466.12 2.10609E+11 4780277 42.69522 119.1492 10.69311
Hungary 24893709465 54974.44 1.07909E+11 4261590 61.42846 83.80507 6.953912
Iceland 2903598477 2074.855 14363405837 166902.7 42.69522 3.004786 8.959263
Ireland 39921339502 38518 1.62729E+11 1808241 42.69522 49.7066 1.750126
Israel 30490588286 56578.98 1.25142E+11 2521916 42.69522 74.59874 5.28819
Italy 3.42378E+11 436527.8 1.72726E+12 23812244 42.69522 673.8013 43.88836
Japan 1.05095E+12 1184780 4.34864E+12 66629250 42.69522 1762.338 85.46249
Korea 2.47212E+11 424804.8 7.59671E+11 22811947 42.69522 663.7219 7.497251
Luxembourg 6661766858 9844.895 31673510217 195930.4 42.69522 14.93412 0.546386
Mexico 1.59578E+11 390791 7.87618E+11 41382751 42.69522 547.8645 71.35033
Netherlands 1.30032E+11 169089.5 6.16726E+11 8119803 42.69522 362.8504 8.71451
New Zealand 21066983453 30718.79 98841114400 2018973 42.69522 54.59967 23.73803
Norway 54630271130 39507.76 2.7454E+11 2378712 42.69522 101.4169 107.2217
Poland 53119296241 324943.7 2.73926E+11 17567905 42.69522 364.6104 26.03681
Portugal 40941880490 55405.54 1.80119E+11 5221265 42.69522 79.46604 22.54306
Slovak Rep 15438688456 39101.4 57573276245 2610746 42.69522 57.34404 4.841803
Slovenia 7680914745 15136.83 34035705896 969740.1 42.69522 20.66905 4.195035
Spain 2.60987E+11 281355.4 1.00351E+12 19318081 42.69522 431.4341 52.99811
Sweden 76876049540 51927.72 3.46859E+11 4682662 42.69522 79.03001 86.17323
Switzerland 93275672250 40686.87 3.86821E+11 4124625 42.69522 69.72641 23.83052
Turkey 81373737125 215710.6 4.17047E+11 22205978 42.69522 285.2909 56.65421
UK 3.75793E+11 531349.6 2.12244E+12 30100243 42.69522 833.8354 14.49357
US 2.3528E+12 5394699 1.14104E+13 1.46E+08 42.69522 8102.887 531.7066
Table 3 and Table 4 show the correlations among the variables of the first and second equations, respectively. For the first equation results show that GDP had high correlation with capital formation, labor, non-renewable energy consumption and renewable energy consumption. These findings indicate that all of the variables play an important role in promoting GDP across the countries. For the second equation, REC had higher correlation with CO2 emission and GDP, and
lower correlation with trade openness and real oil price.
Table 2: Correlation for the first equation’s variables
GDP REC NREC LF GFCF
GDP 1 0.85295 0.966448 0.964654 0.992541
REC 1 0.872465 0.812007 0.833573
NREC 1 0.944675 0.954225
LF 1 0.960510
Journal of Industrial Engineering and Management Studies (JIEMS), Vol. 3 , No. 1 Page 9
Table 4: Correlation for the second equation’s variables
REC CO2 TO ROP GDP
REC 1 0.862108 -0.294932 0.086112 0.85295
CO2 1 -0.294319 0.007578 0.966605
TO 1 0.288377 -0.317158
ROP 1 0.053070
GDP 1
4.
Methodology and Model Estimation
In this section, appropriate econometric methodology is described and applies these for our balanced panel.
Panel unit root test
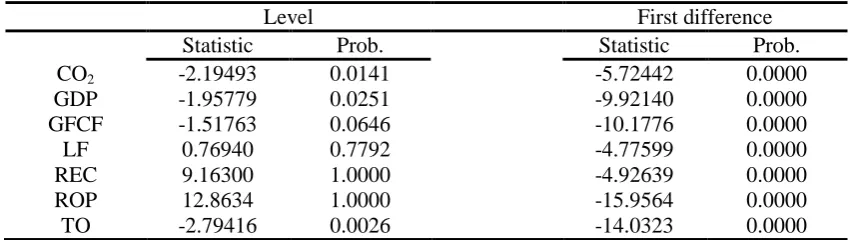
Our analysis is continued by performing the panel unit root test proposed by Levin et al. (2002). The objective is to decide which variables should enter the empirical model in their first-order differential form and which variables should be in their level form. The result of unit root test is summarized in Table 5 for all of panels, which show that all of the variables were integrated of same order, i.e., I (1). It finds that all of the variables are non-stationary at levels, and stationary at their first-order differentials.
Table5: results of unit root test for all the variables.
Level First difference
Statistic Prob. Statistic Prob.
CO2 -2.19493 0.0141 -5.72442 0.0000
GDP -1.95779 0.0251 -9.92140 0.0000
GFCF -1.51763 0.0646 -10.1776 0.0000
LF 0.76940 0.7792 -4.77599 0.0000
REC 9.16300 1.0000 -4.92639 0.0000
ROP 12.8634 1.0000 -15.9564 0.0000
TO -2.79416 0.0026 -14.0323 0.0000
Panel co-integration test
In the subsequent step,the existence of a long-run equilibrium relationship between the variables is examined. Each of our variables is integrated of order one, panel co-integration test developed by Pedroni (1999a) is conducted. The proposed test statistics are: the panel v-statistic, panel rho-statistic, panel PP-rho-statistic, panel ADF-rho-statistic, group rho-rho-statistic, group PP-statistic and group ADF-statistic.
Table 6 and table 7 present the findings. Out of seven test statistics in the first equation, four confirm the presence of co-integration among the variables. Therefore, it is concluded that real GDP, gross fixed capital formation, labor force, renewable consumption and non-renewable consumption series shared a long-run equilibrium relationship.
Journal of Industrial Engineering and Management Studies (JIEMS), Vol. 3 , No. 1 Page 10
Table6: Pedroni panel co-integration test results (First equation)
Alternative hypothesis: common AR coefs. (within-dimension)
Statistic Prob. Weighted Statistic Prob.
Panel v-Statistic 1.936535 0.0264*** -0.019438 0.5078
Panel rho-Statistic 3.923795 1.0000 3.726857 0.9999
Panel PP-Statistic -0.715114 0.2373 -1.703163 0.0443***
Panel ADF-Statistic -4.616071 0.0000*** -1.891643 0.0293***
Alternative hypothesis: individual AR coefs. (between-dimension) Statistic Prob.
Group rho-Statistic 6.344991 1.0000 Group PP-Statistic -2.276050 0.0114*** Group ADF-Statistic -1.982716 0.0237***
Notes: Variables: GDP, GFCF, LF, REC & NREC. Trend assumption: No deterministic trend. Lag selection: 1.
*** Denote rejection of null hypothesis of no co-integration at 0.5% significance level.
Table7: Pedroni panel co-integration test results (Second equation)
Alternative hypothesis: common AR coefs. (within-dimension)
Statistic Prob. Weighted Statistic Prob.
Panel v-Statistic -0.451879 0.6743 2.372282 0.0088***
Panel rho-Statistic 0.111223 0.5443 -1.730976 0.0417***
Panel PP-Statistic -9.743146 0.0000*** -6.641572 0.0000***
Panel ADF-Statistic -12.00596 0.0000*** -4.346187 0.0000***
Alternative hypothesis: individual AR coefs. (between-dimension) Statistic Prob.
Group rho-Statistic -0.244304 0.4035 Group PP-Statistic -7.735082 0.0000*** Group ADF-Statistic -3.145035 0.0008***
Notes: Variables: REC, GDP, TO & ROP. Trend assumption: No deterministic trend. Lag selection: 1.
*** Denote rejection of null hypothesis of no cointegration at 0.5% significance level.
Panel causality analysis
The existence of co-integration between variables confirms that there ought to be at least, one causal relationship, but it fails to give its direction. Hence, the procedure from Engle and Granger (1987) to examine the short-run as well as the long-run causal dynamics between the competing variables is followed. This test requires variables to be stationary; therefore is applied on the first difference of the series. The findings established bidirectional causality between GDP and renewable energy consumption in the short-run. (See table8).
Table 8: Granger causality analysis
Null Hypothesis: Obs. F-Statistics Prob.
D (REC) does not Granger Cause D(GDP) 662 7.91088 0.0004
D (GDP) does not Granger Cause D(REC) 36.1025 1.E-15
Journal of Industrial Engineering and Management Studies (JIEMS), Vol. 3 , No. 1 Page 11
5.
Empirical Findings of Simultaneous Equations Model
Model estimation
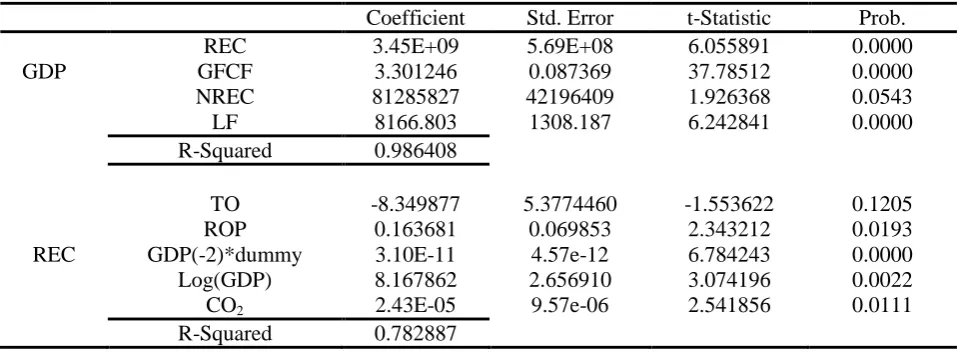
As two equations in this paper are over-identified, 2SLS can be used to estimate the simultaneous equations model. In the table 9 the estimation of the model is presented. The findingson long-run suggest that along with traditional inputs such as capital and labor, both renewables and non-renewablesplay a significant role in the process of economicdevelopment in the OECD countries. Based on these results, it is argued that renewable energy consumption plays abigger role in GDP. The findings of the second equation show that both GDP and real oil price play an important role in renewable energy consumption in the selected countries. As a result, to ensuresustainable economic development in future, policy makers need topromote the production and consumption of renewable energy.
Table 9: Estimation of the model
Coefficient Std. Error t-Statistic Prob.
GDP
REC 3.45E+09 5.69E+08 6.055891 0.0000
GFCF 3.301246 0.087369 37.78512 0.0000
NREC 81285827 42196409 1.926368 0.0543
LF 8166.803 1308.187 6.242841 0.0000
R-Squared 0.986408
REC
TO -8.349877 5.3774460 -1.553622 0.1205
ROP 0.163681 0.069853 2.343212 0.0193
GDP(-2)*dummy 3.10E-11 4.57e-12 6.784243 0.0000
Log(GDP) 8.167862 2.656910 3.074196 0.0022
CO2 2.43E-05 9.57e-06 2.541856 0.0111
R-Squared 0.782887
6.
Conclusion
With the rapid development of global economy, the consumption of fossil fuel energy has been growing fast. In response to worldwide attention towards sustainable development, renewable energy as the major alternative energy for achieving that has been widely concerned.
A simultaneous equations model is used to explore the interaction between GDP and renewable energy consumption. It was established a dynamic panel data of 34 OECD countries from 1990 to 2012. The model was estimated by using the two-stage least-squares method. The findingson long-run suggested that capital, labor and both renewables and non-renewables played a significant role in the process of economicdevelopment in the OECD countries. Based on these results,it is argued that renewable energy consumption plays abigger role in GDP. The findings of the second equation show that both GDP and real oil price play an important role in renewable energy consumption in the selected countries.
There are some studies that investigate the impact of renewable energy consumption on GDP with single equation model and the others use dynamic panel data. With Comprehensive research, dynamic panel data in a system equation model is applied to describe two side effect of renewable energy consumption on GDP, for the first time.
One of the limitations of our model was that disaggregated data within the renewables (i.e. bio-mass, solar, wind and hydroelectricity) due to unavailability of data for the selected period, could not investigate.
Journal of Industrial Engineering and Management Studies (JIEMS), Vol. 3 , No. 1 Page 12
production and consumption of renewable energy. For the further research using the mentioned items is suggested.
References
Al-Mulali, U., Fereidouni, H.G. & Lee, J.Y.M., 2013. Examining the bi-directional long run relationship between renewable energy consumption and GDP growth. Renewable and Sustainable Energy Reviews, 22, pp.209–222. Available at: http://dx.doi.org/10.1016/j.rser.2013.02.005.
Al-Mulali, U., Fereidouni, H.G. & Lee, J.Y.M., 2014. Electricity consumption from renewable and non-renewable sources and economic growth: Evidence from Latin American countries. Renewable and Sustainable Energy Reviews, 30, pp.290–298. Available at: http://dx.doi.org/10.1016/j.rser.2013.10.006. Apergis, N. & Payne, J.E., 2011a. Renewable and non-renewable electricity consumption-growth nexus: Evidence from emerging market economies. Applied Energy, 88(12), pp.5226–5230. Available at: http://dx.doi.org/10.1016/j.apenergy.2011.06.041.
Apergis, N. & Payne, J.E., 2012a. Renewable and non-renewable energy consumption-growth nexus: Evidence from a panel error correction model. Energy Economics, 34(3), pp.733–738. Available at: http://dx.doi.org/10.1016/j.eneco.2011.04.007.
Apergis, N. & Payne, J.E., 2012b. Renewable and non-renewable energy consumption-growth nexus: Evidence from a panel error correction model. Energy Economics, 34(3), pp.733–738.
Apergis, N. & Payne, J.E., 2010a. Renewable energy consumption and economic growth: Evidence from a panel of OECD countries. Energy Policy, 38(1), pp.656–660. Available at: http://dx.doi.org/10.1016/j.enpol.2009.09.002.
Apergis, N. & Payne, J.E., 2010b. Renewable energy consumption and economic growth: Evidence from a panel of OECD countries. Energy Policy, 38(1), pp.656–660.
Apergis, N. & Payne, J.E., 2010c. Renewable energy consumption and growth in Eurasia. Energy Economics, 32(6), pp.1392–1397. Available at: http://dx.doi.org/10.1016/j.eneco.2010.06.001.
Apergis, N. & Payne, J.E., 2010d. Renewable energy consumption and growth in Eurasia. Energy Economics, 32(6), pp.1392–1397.
Apergis, N. & Payne, J.E., 2011b. The renewable energy consumption-growth nexus in Central America. Applied Energy, 88(1), pp.343–347. Available at: http://dx.doi.org/10.1016/j.apenergy.2010.07.013. Apergis, N. & Payne, J.E., 2011c. The renewable energy consumption-growth nexus in Central America. Applied Energy, 88(1), pp.343–347.
Bash, E., 2015. No Title No Title. PhD Proposal, 1(1), pp.1–13.
Bilgili, F. & Ozturk, I., 2015a. Biomass energy and economic growth nexus in G7 countries: Evidence from dynamic panel data. Renewable and Sustainable Energy Reviews, 49, pp.132–138. Available at: http://dx.doi.org/10.1016/j.rser.2015.04.098.
Bilgili, F. & Ozturk, I., 2015b. Biomass energy and economic growth nexus in G7 countries: Evidence from dynamic panel data. Renewable and Sustainable Energy Reviews, 49, pp.132–138.
Bilgili, F. & Ozturk, I., 2015c. Biomass energy and economic growth nexus in G7 countries: Evidence from dynamic panel data. Renew. Sustain. Energy Rev., 49, pp.132–138. Available at: http://www.sciencedirect.com/science/article/pii/S1364032115003688.
Cerdeira Bento, J.P. et al., 2016. The effect of renewable energy consumption on economic growth: Evidence from top 38 countries. Applied Energy, 162, pp.733–741. Available at: http://linkinghub.elsevier.com/retrieve/pii/S0306261915013318\nhttp://linkinghub.elsevier.com/retrieve/p ii/S0921800915002323\nhttp://www.sciencedirect.com/science/article/pii/S0360544215001085\nhttp://li nkinghub.elsevier.com/retrieve/pii/S1364032115012307.
Chang, T.H., Huang, C.M. & Lee, M.C., 2009. Threshold effect of the economic growth rate on the renewable energy development from a change in energy price: Evidence from OECD countries. Energy Policy, 37(12), pp.5796–5802. Available at: http://dx.doi.org/10.1016/j.enpol.2009.08.049.
Journal of Industrial Engineering and Management Studies (JIEMS), Vol. 3 , No. 1 Page 13
Fang, Y., 2011. Economic welfare impacts from renewable energy consumption: The China experience. Renewable and Sustainable Energy Reviews, 15(9), pp.5120–5128. Available at: http://dx.doi.org/10.1016/j.rser.2011.07.044.
Levin, A., Lin, C.-F. & James Chu, C.-S., 2002. Unit root tests in panel data: asymptotic and finite-sample properties. Journal of Econometrics, 108(1), pp.1–24. Available at: http://www.sciencedirect.com/science/article/pii/S0304407601000987 [Accessed April 3, 2016].
Magnani, N. & Vaona, A., 2013. Regional spillover effects of renewable energy generation in Italy. Energy Policy, 56, pp.663–671. Available at: http://dx.doi.org/10.1016/j.enpol.2013.01.032.
Marques, A.C. & Fuinhas, J.A., 2012. Is renewable energy effective in promoting growth? Energy Policy, 46, pp.434–442.
Menegaki, A.N., 2011. Growth and renewable energy in Europe: A random effect model with evidence for neutrality hypothesis. Energy Economics, 33(2), pp.257–263. Available at: http://dx.doi.org/10.1016/j.eneco.2010.10.004.
Müller, S., Brown, A. & Ölz, S., 2011. Policy Considerations For Deploying Renewables. Renewable
Energy, p.72. Available at:
https://www.iea.org/publications/freepublications/publication/Renew_Policies.pdf.
Ocal, O. & Aslan, A., 2013. Renewable energy consumption-economic growth nexus in Turkey. Renewable and Sustainable Energy Reviews, 28, pp.494–499. Available at: http://dx.doi.org/10.1016/j.rser.2013.08.036.
Ohler, A. & Fetters, I., 2014. The causal relationship between renewable electricity generation and GDP growth: A study of energy sources. Energy Economics, 43, pp.125–139. Available at: http://dx.doi.org/10.1016/j.eneco.2014.02.009.
Omri, A. & Nguyen, D.K., 2014. On the determinants of renewable energy consumption: International evidence. Energy, 72, pp.554–560. Available at: http://dx.doi.org/10.1016/j.energy.2014.05.081.
Pao, H.T. & Fu, H.C., 2013. Renewable energy, non-renewable energy and economic growth in Brazil. Renewable and Sustainable Energy Reviews, 25, pp.381–392. Available at: http://dx.doi.org/10.1016/j.rser.2013.05.004.
Payne, J.E., 2009. On the dynamics of energy consumption and output in the US. Applied Energy, 86(4), pp.575–577. Available at: http://dx.doi.org/10.1016/j.apenergy.2008.07.003.
Pedroni, P., 1999a. Critical values for cointegration tests in heterogeneous panels with multiple regressors. Oxford Bulletin of Economics and statistics, pp.653–670.
Pedroni, P., 1999b. CRITICAL VALUES FOR COINTEGRATION TESTS IN HETEROGENEOUS PANELS WITH MULTIPLE REGRESSORS.
Robert F . Engle and C . W . J . Granger, 1987. Co-Integration and Error Correction : Representation , Estimation , and Testing. Econometrica, 55(2), pp.251–276.
Sadorsky, P., 2009a. Renewable energy consumption, CO2 emissions and oil prices in the G7 countries. Energy Economics, 31(3), pp.456–462.
Sadorsky, P., 2009b. Renewable energy consumption and income in emerging economies. Energy Policy, 37(10), pp.4021–4028. Available at: http://dx.doi.org/10.1016/j.enpol.2009.05.003.
Salim, R.A. & Rafiq, S., 2012. Why do some emerging economies proactively accelerate the adoption of renewable energy? Energy Economics, 34(4), pp.1051–1057.
Smiech, S. & Papiez, M., 2014. Energy consumption and economic growth in the light of meeting the targets of energy policy in the EU: The bootstrap panel Granger causality approach. Energy Policy, 71, pp.118–129.
Tiwari, A.K., 2011. Volume 31 , Issue 2 A structural VAR analysis of renewable energy consumption , real GDP and. Economics Bulletin, 31(2), pp.1793–1806.
Tugcu, C.T., Ozturk, I. & Aslan, A., 2012a. Renewable and non-renewable energy consumption and economic growth relationship revisited: Evidence from G7 countries. Energy Economics, 34(6), pp.1942– 1950. Available at: http://dx.doi.org/10.1016/j.eneco.2012.08.021.
Journal of Industrial Engineering and Management Studies (JIEMS), Vol. 3 , No. 1 Page 14
do Valle Costa, C., La Rovere, E. & Assmann, D., 2008. Technological innovation policies to promote renewable energies: Lessons from the European experience for the Brazilian case. Renewable and Sustainable Energy Reviews, 12(1), pp.65–90.
Yildirim, E., Sukruoglu, D. & Aslan, A., 2014. Energy consumption and economic growth in the next 11 countries: The bootstrapped autoregressive metric causality approach. Energy Economics, 44, pp.14–21. Zhang, X.-P. & Cheng, X.-M., 2009. Energy consumption, carbon emissions, and economic growth in
China. Ecological Economics, 68(10), pp.2706–2712. Available at:
http://linkinghub.elsevier.com/retrieve/pii/S092180090900216X.
World Bank, various issues. World Bank Development Indicators. Washington DC: World Bank.
Energy Information Administration (EIA). International Energy Outlook. Washington, DC: US Energy Information Administration, US Department of Energy; 2013.