UDK 519.2:539.42/.43
Načrtovanje preizkusov za popis obremenitvenih stanj konstrukcij
Experiment Design for Structures Loading State Determination
MARKO NAGODE - MATIJA FAJDIGA
V prispevku so podani rezultati raziskave o možnostih uporabe različnih metod načrtovanj preizkušanj s poudarkom na Taguchijevih metodah za popis obremenitvenega stanja kot funkcije močno spremenljivih obratovalnih razmer.
This paper treats the results of an investigation on the possibilities of the use of different methods of experiment design for specification of loading conditions as a function of considerably changeable operating conditions. Stress is given to Taguchi’ s methods of experiment design.
0 UVOD
Pri standardnem pojmovanju dimenzioniranja se ugotavlja dimenzijska primernost konstrukcije s kontrolo varnosti v vseh kritičnih točkah. Za oceno obremenitvenega stanja se v tem primeru običajno uporabljajo analitični postopki, ki teme ljijo na izkušnjah oziroma predhodnih konstruk cijskih rešitvah.
Sodobni postopki dimenzioniranja na zaneslji vost v primerjavi z dosedanjimi slonijo na ekspe rimentalnem ugotavljanju obremenitvenega stanja 131, 1111. Ker se lahko za določanje zanesljivosti izdelkov porabljajo le preizkusni postopki dimen zioniranja, se zastavlja vprašanje, kako je mogoče optimirati faze preizkušanj z vidika časa in stroš kov, porabljenih za izvedbo omenjenih faz razvoj nega procesa
Namen pričujočega prispevka je dati odgovor na vprašanje, ali je mogoče v primerih, kadar so obratovalne razmere odvisne od večjega števila vplivnih dejavnikov, z porabo različnih metod načrtovanj preizkušanj racionalizirati število pre izkusov, potrebnih za popis obremenitvenega stanja kot funkcije močno spremenljivih obratovalnih razmer.
1 PREGLED METOD NAČRTOVANJ PREIZKUŠANJ
Prvotno je veljalo prepričanje, da je najbolje proučevati vsakega od dejavnikov posebej, pri če mer se ocenjuje vplivnost posameznega dejavnika s posebnim preizkusom 181. Kasneje se je izkazalo, da je s kombiniranim proučevanjem večjega šte vila dejavnikov hkrati (faktorialni eksperiment) mogoče doseči bistveno boljše rezultate z manjšim številom preizkusov. V tem primeru načrt preiz kusov vključuje vse mogoče kombinacije ravni spremenljivih dejavnikov.
0 INTRODUCTION
A classical pproach to design is used to predict dimensional suitability by safety factor control of all crucial points of a structure. To estimate the loading state, an analytical approach based on experience or previous design solutions is used.
Unlike classical design, contemporary pro cedures of reliability design determine the loading state through experiment 131, [111. Since product reliability can be determined only by experiment, it is important to know how to optimize the experimental phases in terms of time and costs involved in order to realise the mentioned development process pha ses.
The aim of this paper is to answer whether or not, in cases when the operating conditions depend on a number of significant factors, it is possible to rationalize the number of experiments that are necessary to determine the loading state as a function of the considerably changeable ope rating conditions, by using different methods of experiment design.
1 SURVEY OF EXPERIMENT DESIGN METHODS
Oceno vplivnosti posameznega dejavnika in interakcij med njimi je mogoče dobiti z upo rabo enega od modelov analize variance. Po manjkljivost opisanega postopka je, da s poveče vanjem števila vplivnih dejavnikov oziroma šte vila ravni potrebno število preizkusov naglo zvečuje.
Obstajata dva različna načina, s katerima je mogoče dodatno zmanjšati potrebno število preiz kusov. Pri prvem se omeji število ravni vplivnih dejavnikov (faktorialni eksperiment 2k 141, 171, 181), pri drugem pa se iz kompletne matrike pre izkusov po določenem ključu izbere vzorec izmer jenih vrednosti in izvede analiza vzorca (latinski, grško-latinski kvadrat 161, Taguchijeve metode 191, 1101).
2 HIPOTEZA
Za oceno primernosti posameznih metod načrtovanj preizkušanj so bile krivulje glavnih učinkov vplivnih dejavnikov s pripadajočo pre glednico analize variance, dobljene po standardni metodi s kompletno matriko preizkusov, pri merjane z analognimi krivuljami vplivov in pre glednicami analize variance, dobljenimi z raz ličnimi metodami skrajšanega preizkušanja. Na podlagi primerjave rezultatov analize je bilo mogoče sklepati o primernosti racionaliza cije.
3 NAČRT PREIZKUSOV
Obremenitveno stanje, kateremu je izpostav ljena konstrukcija v procesu uporabe, je v tesni povezavi z obratovalnimi razmerami. Običajno se najprej zastavlja vprašanje, kateri dejavniki vpli vajo na spremembo obremenitvenega stanja, nato pa je z različnimi statističnimi testi sprejeta ali zavrnjena hipoteza o vplivnosti posameznega de javnika. Ključnega pomena sta izbira vplivnih de javnikov, števila nivojev za vsakega od dejavnikov posebej, števila ponovitev preizkusa in načrt pre
izkusov.
Zaradi nazornosti prikaza in splošnosti metod načrtovanj preizkušanj bodo v nadaljevanju štirje vplivni dejavniki, zajeti v raziskavo, prikazani le s simboli. Faktor A naj bo stopnjevan na šestih, faktor B na dveh, faktor C na treh in faktor D na štirih ravneh. Zaradi pričakovanega raztrosa re zultatov je treba upoštevati še določeno število ponovitev preizkusov (r = 6). Skupno število pre izkusov je potemtakem enako zmnožku ravni vplivnih dejanikov, pomnoženemu s številom pono vitev preizkusov. Del kompletne matrike preizku sov prikazuje preglednica 1.
The influence of a particular factor and factor interactions can be estimated by using one of the analysis-of-variance methods. However, the dis advantage of the procedure is a rapid increase in the number of experiments due to the increase in the number of significant factors or the number of levels.
There are two different approaches by the use of which the necessary number of experi ments can be even further reduced. The first sug gests limiting the number of levels of the signifi cant factors (factorial design 2k 141, 171, (81). Ac cording to the second, a sample of the measured values is selected out of the complete matrix of experiments and then analysed (Latin, Greco- Latin square 161, Taguchi methods 191, 1101).
2 HYPOTHESIS
To estimate the suitability of a particular experiment design method, the following curves were compared: the main effect curves of sig nificant factors with the associated analysis-of- variance table acquired by the classical method with a complete matrix of experiments, and the analogous curves of influences, as well as analysis -of-variance tables obtained by different methods of experiment design. By comparing the results of the analysis it was possible to demonstrate whet her rationalization was appropriate or not.
3 MATRIX-OF-EXPERIMENT DESIGN The loading state to which the structure is exposed in the process of use is closely related to the loading conditions. Usually, the first ques tion to be answered is which factors cause chan ges in the loading state. Using different statistical tests, the hypothesis on the influence of a par ticular factor is then accepted or rejected. The selection of the significant factors, the number of levels for each factor separately, the number of replications and the matrix-of-experiment design are of crucial importance.
Preglednica 1. Del kompletne matrike preizkusov pri pogoju B :, C t , A Dk
Table 1. Part of the compiete matrix of experiments under the condition B; , C1, A t , Dk
A
D 1 2 3 4 5 6
1 1.61 3 3,62 1 2,79 3 4,80 1 3,97 3 5,98 1 4411 3 6,112 1 5425 3 7 4 2 6 1 6435 3 8436
1 5 5.63 7 7,64 5 6.81 7 8,82 5 7,99 7 9400 5 8413 7 10414 5 9427 7 11,128 5 10,137 7 12438
9 9.65 11 11,66 9 10.83 11 12,84 9 11401 11 1,41 9 12415 11 2,43 9 14 5 11 3,45 9 247 11 4,47
1 7.73 3 9,74 1 8,91 3 10,92 1 9407 3 11408 1 10421 3 12422 1 11433 3 14 1 12443 3 2 4
2 5 11,75 7 143 5 12,93 7 24 5 5 1,5 7 347 5 2,7 7 449 5 3,9 7 541 5 441 7 643
9 3,29 11 5,49 9 441 11 6,51 9 543 11 7,53 9 645 11 8,55 9 74 7 11 9,57 9 8 4 9 11 10,59
2 1.67 4 3,68 2 2.85 4 4,86 2 3402 4 5403 2 4,116 4 6417 2 5429 4 7 4 30 2 6439 4 84 40
3 6 5.69 8 7,70 6 6,87 8 8,88 6 74 04 8 9405 6 8,118 8 10419 6 9431 8 11432 6 10441 8 12442
10 9.1 12 11.72 10 10.89 12 12,90 10 11406 12 1.42 10 12,120 12 2,44 1 0 146 12 3,46 1 0 2 4 8 12 4,48
2 7,76 4 9,77 2 8.94 4 10,95 2 9409 4 11410 2 10,123 4 12424 2 11434 4 14 2 12444 4 2,4
4 6 11.78 8 144 6 12,96 8 2 4 6 6 1,6 8 348 6 2,8 8 440 6 340 8 542 6 442 8 644
10 3,30 12 5,50 10 4.32 12 6,52 10 544 12 7,54 10 646 12 8,5610 7 4 8 12 9,58 10 8,40 12 10,60
4 SPREMEMBA OBREMENITVENEGA STANJA Pri problemih, povezanih s trdnostnimi pre računi, obratovalno trdnostjo in zanesljivostjo, je treba časovne poteke obremenitev spremeniti v obliko, iz katere je mogoče razbrati vrednosti pa rametrov obremenitev, ki so odločilni za utrujanje. Za popis parametrov obremenitev, npr.: velikost, število in gradient sunkov ter vrstni red in stopnja obremenitve, se uporabljajo obremenitveni kolek tivi (sl.l), sestavljeni iz naključnih obremenitev z uporabo standardnih števnih metod 111, 121, 151.
4 LOADING STATE TRANSFORMATION For solving strength calculations, and opera ting strength and reliability problems, load his tories have to be transformed into a form from which the values of load parameters that are crucial for fatigue can be calculated. To determine the load parameters, such as amplitude, number and gradient of pulses, succession and load level, loading spectra are used (Fig. 1.). They are cons tructed from load histories using standardized counting methods 111, 121, 151.
število max - min v posameznem razredu (number o f max - min in individual class)
Sl. 1. Obremenitveni kolektiv po metodi štetja konic sunkov III
Fig. 1. Loading spectra by the use of peak counting III method
5 TAGUCHIJEVE METODE NAČRTOVANJ PREIZKUŠANJ
Zaradi svoje prilagodljivosti se v zadnjem času vse bolj uveljavlja uporaba različnih Taguchijevih metod načrtovanj preizkušanj. Razlog, ki narekuje uporabo teh metod, je možnost kombiniranja veli kega števila vplivnih dejavnikov, stopnjevanih na zelo različnem številu nivojev. Z uporabo latinske ga in grško-latinskega kvadrata to sploh ni mogo če, faktorialni eksperiment pa ponuja le zelo ome jene možnosti kombiniranja števila ravni.
5 TAGUCHI METHODS OF EXPERIMENT DESIGN
V nadaljevanju bo prikazana konstrukcija na črta preizkusov s kombinirano uporabo delno raz širjenega načrta preizkusov, večnivojske tehnike in tehnike z namišljeno ravnjo. Z naštetimi meto dami je mogoče močno zmanjšati potrebno število preizkusov in hkrati modificirati standardno orto- gonalno polje L16(215) v obliko L16(6 x 4 x 3 x 2a), ki omogoča hkraten študij faktorja na šestih (A), faktorja na štirih (D), faktorja na treh (C) in fak torja na dveh ravneh (B) (pregi. 2).
We shall now present how to design a matrix of experiments by combining partial supplementing design, multi-level technique and dummy level technique. By these methods, it is possible to reduce the necessary number of measurements and at the same time modify the standardized orthogonal array L16(215) into the form of L16(6 x 4 x 3 x 26) which makes it pos
sible to deal w ith a factor (A) at six, a factor at four (D), a factor at three (C) and a factor at two levels (B) (Table 2).
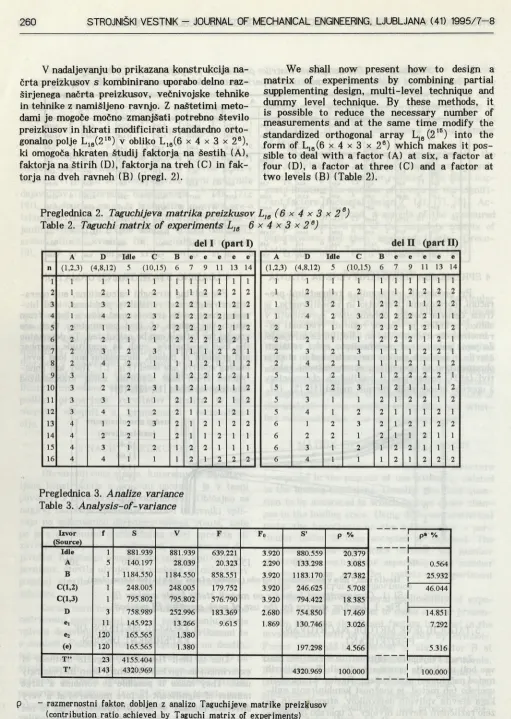
Preglednica 2. Taguchijeva matrika preizkusov Lie (6 x 4 x 3 x 2 e)
Table 2. Taguchi matrix of experiments Lie 6 x 4 x 3 x 2 e)
del I (part I) del II (part D )
A D Idle C B e e e e e
14
A D Idle C B e e e e e
n (1.2,3) (4,8,12) 5 (10,15) 6 7 9 n 13 (1,2,3) (4,8,12) 5 (10,15) 6 7 9 n 13 14
i 1 1 1 1 1 1 1 i 1 i 1 1 1 1 1 1 1 i 1 1
2 1 2 1 2 1 1 2 2 2 2 1 2 1 2 1 1 2 2 2 2
3 1 3 2 1 2 2 1 1 2 2 1 3 2 1 2 2 1 1 2 2
4 1 4 2 3 2 2 2 2 1 1 1 4 2 3 2 2 2 2 1 1
5 2 1 i 2 2 2 1 2 1 2 2 1 1 2 2 2 1 2 1 2
6 2 2 i 1 2 2 2 1 2 1 2 2 1 1 2 2 2 1 2 1
7 2 3 2 3 1 1 1 2 2 1 2 3 2 3 1 1 1 2 2 1
8 2 4 2 1 1 1 2 1 1 2 2 4 2 1 1 1 2 1 1 2
9 3 1 2 1 1 2 2 2 2 1 5 1 2 1 1 2 2 2 2 1
10 3 2 2 3 1 2 1 1 1 2 5 2 2 3 1 2 1 1 1 2
11 3 3 1 1 2 1 2 2 1 2 5 3 1 1 2 1 2 2 1 2
12 3 4 1 2 2 1 1 1 2 1 5 4 1 2 2 1 1 1 2 1
13 4 i 2 3 2 1 2 1 2 2 6 1 2 3 2 1 2 1 2 2
14 4 2 2 1 2 1 1 2 1 1 6 2 2 1 2 1 1 2 1 1
15 4 3 1 2 1 2 2 1 1 1 6 3 1 2 1 2 2 1 1 1
16 4 4 1 1 1 2 1 2 2 2 6 4 1 1 1 2 1 2 2 2
Preglednica 3. Analize variance
Table 3. Analysis-of-variance
Izvor (Source)
f S V F F 0 S' p % p* %
Idle 1 881.939 881.939 639.221 3.920 880.559 20.379
A 5 140.197 28.039 20.323 2.290 133.298 3.085 0.564
B 1 1184.550 1184.550 858.551 3.920 1183.170 27.382 25.932
C(l,2) 1 248.005 248.005 179.752 3.920 246.625 5.708 ! 46.044
C(l,3) 1 795.802 795.802 576.790 3.920 794.422 18.385 I
I
D 3 758.989 252.996 183.369 2.680 754.850 17.469 14.851
©1 11 145.923 13.266 9.615 1.869 130.746 3.026 7.292
e2 120 165.565 1.380 1
(e) 120 165.565 1.380 197.298 4.566 5.316
J»» 23 4155.404
T ’ 143 4320.969 4320.969 100.000 100.000
p - razmernostni faktor, dobljen z analizo Taguchijeve matrike preizkusov (contribution ratio achieved by Taguchi matrix of experiments)
P* — razmernostni faktor, dobljen z analizo kompletne matrike preizkusov
Primerjava rezultatov analize variance, dob ljenih na podlagi kompletne in okleščene matrike preizkusov, pokaže dobro ujemanje. Iz preglednice 3 je razvidno, da imajo vsi štirje opazovani faktor ji (A, B, C in D) bistven vpliv na obremenitveno stanje. Sumarni delež interakcij med faktorji (e,) je sicer prav tako značilen, vendar je njegov vpliv v primerjavi z drugimi faktorji majhen. Tudi delež celotne variacije (e), ki označuje sipanje rezultatov zaradi ponovitev preizkusov, je podoben v obeh primerih.
Navadno nas poleg preglednice analize varian ce zanima tudi grafična predstavitev rezultatov. Kot zelo primerna se je izkazala grafična predsta vitev s krivuljami glavnih učinkov faktorjev, kjer vpliv posameznega faktorja na opazovano lastnost prikažemo z ločenim grafikonom. Iz tako dobljene ga niza funkcij glavnih učinkov faktorjev f(A), f(B), f(C), f(D) oziroma interakcij f(AB), f(BC), je mogoče s preprostim seštevanjem sestaviti enačbo, ki podaja opazovano lastnost pojava kot funkcijo vseh bistvenih dejavnikov oziroma inter akcij hkrati:
The comparison of the analysis-of-variance results obtained by the complete and incomplete matrix of experiments shows good correlation. It can be seen from Table 3 that the four ob served factors (A, B, C and D) significantly influence the loading state. Total interaction among the factors (e,) is significant, but com pared to other factors, its influence is small. Total variation (e) which determines the scatter of results because of replications is also similar in both cases.
Apart from the analysis-of-variance table, we are often interested in the graphic presenta tion of results. In such cases, main effect curves have proved to be very suitable. The influence of a particular factor upon the measured characte ristic is presented by a separate diagram. From the set of the main effect functions f(A), f(B), f(C), f(D) and interactions f(AB), f(BC), it is possible to create a formula by simple addition presenting the measured characteristic of the phenomenon as a function of all significant factors and interactions:
f (A, B, C, D, AB, BC, . . .) = f (A) + f(B) + f(C) + f(D) + f (AB) + f(BC) + . . .
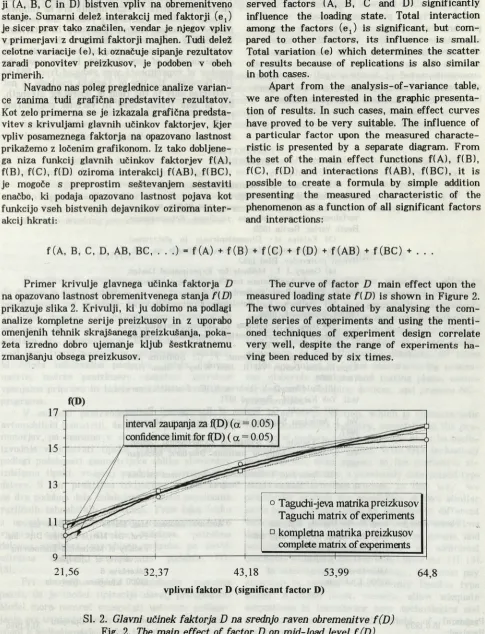
Primer krivulje glavnega učinka faktorja D
na opazovano lastnost obremenitvenega stanja f(D)
prikazuje slika 2. Krivulji, ki ju dobimo na podlagi analize kompletne serije preizkusov in z uporabo omenjenih tehnik skrajšanega preizkušanja, poka žeta izredno dobro ujemanje kljub šestkratnemu zmanjšanju obsega preizkusov.
The curve of factor D main effect upon the measured loading state f { D) is shown in Figure 2. The two curves obtained by analysing the com plete series of experiments and using the menti oned techniques of experiment design correlate very well, despite the range of experiments ha ving been reduced by six times.
f(D)
vplivni faktor D (significant factor D)
SI. 2. Glavni učinek faktorja D na srednjo raven obremenitve f(D)
6 SKLEP
Analiza rezultatov meritev, dobljenih na pod lagi kompletne in okleščene matrike preizkusov, je pokazala, da je mogoče z uporabo Taguchijevih metod načrtovanj preizkušanj izredno zmanjšati potrebno število preizkusov za popis obremenitve nega stanja kot funkcije obratovalnih razmer. V obravnavanem primeru je bilo mogoče zmanjšati začetnih 864 na vsega 144 preizkusov. Uporaba omenjenih metod ni omejena zgolj na probleme obratovalne trdnosti. To dokazujejo številne upora be teh metod na različnih področjih tehnike.
6 CONCLUSION
The results of the comparison between the analysis-of-variance tables and the main effect curves obtained on the basis of a complete and incomplete matrix of experiments are as follows: Taguchi methods can largely reduce the required number of measurements necessary to determine the loading state as a function of the operating conditions, thus contributing to the rationalization of the number of experiments. In our case, the number of experiments was reduced from 864 to 144. However, the use of Taguchi methods is not restricted only to the field of operating strength, but is also widely used in various engineering fields.
7 LITERATURA 7 REFERENCES
111 Buxbaum.O.: Betriebsfestigkeit. Verlag Stahl eisen GmbH, Düsseldorf 1986.
[21 DIN Veröffentlichungen, DIN 45667 Klassier verfahren fü r das Erfassen regelloser Schwingungen, Beuth Verlag, Berlin 1969
131 Fajdiga, M.: Dimenzioniranje in efektivnost. Zbornik posvetovanja Metode dimenzioniranja na efek tivnost proizvodov. Bled 1982.
141 Goupy J. L.: Methods for Experimental Design. Principles and Applications for Physicsts and Chemists, Voi. 12. Elsevier Publ. Amsterdam 1993.
(51 Haibach. E.: Betriebsfestigkeit. VDI-Verlag GmbH, Düsseldorf, 1989.
161 Hogg.R. V.-Ledolter J.: Applied Statistics for Engineers and Physical Scientists. Macmillan Publishing Company, New York 1992.
171 Johnson, N. L.—Leone, F. C.: Statistics and Experimental Design Vol II. John Wiley & Sons, New York, 1964.
181 Snidikor, D. V.-Kohren, V. C.: Statistički me todi. Vuk Karadžić . Beograd 1971.
191 Taguchi, G.: System of Experimental Design Vol. 1. American Supplier Institute. Dearborn, Michigan 1987.
1101 Taguchi, G.: System of Experimental Design. Voi. 2. American Supplier Institute. Dearborn, Michigan 1987.
Ill] Todorovič, J.-Zelenovič, D: Efektivnost sistema u mašinstvu. Naučna knjiga. Beograd, 1981.
Naslov avtorjev: mag. Marko Nagode, dipl. inž. prof. dr. Matija Fajdiga, dipl. inž. Fakulteta za strojništvo
Univerze v Ljubljani Aškerčeva 6
61000 Ljubljana
Authors’ Address: Mag. Marko Nagode, Dipl. Ing., Prof. Dr. Matija Fajdiga, Dipl. Ing. Faculty of Mechanical Engineering University of Ljubljana
Aškerčeva 6
61000 Ljubljana, Slovenia
Prejeto: 16.6.1995