Abstract
Background: Prostate cancer (PCa) is a malignancy cause of cancer deaths and frequently diagnosed in male. This study aimed to identify tumor suppressor genes, hub genes and their pathways by combined bioinformatics analysis. Methods: A combined analysis method was used for two types of microarray datasets (DNA methylation and gene expression profiles) from the Gene Expression Omnibus (GEO). Differentially methylated genes (DMGs) were identified by the R package minfi and differentially expressed genes (DEGs) were screened out via the R package limma. A total of 4451 DMGs and 1509 DEGs, identified with nine overlaps between DMGs, DEGs and tumor suppressor genes, were screened for candidate tumor suppressor genes. All these nine candidate tumor suppressor genes were validated by TCGA (The Cancer Genome Atlas) database and Oncomine database. And then, the gene ontology (GO) and Kyoto Encyclopedia of Genes and Genomes pathway (KEGG) enrichment analyses were performed by DAVID (Database for Annotation, Visualization and Integrated Discovery) database. Protein–protein interaction (PPI) network was con-structed by STRING and visualized in Cytoscape. At last, Kaplan–Meier analysis was performed to validate these genes. Results: The candidate tumor suppressor genes were IKZF1, PPM1A, FBP1, SMCHD1, ALPL, CASP5, PYHIN1, DAPK1 and CASP8. By validation in TCGA database, PPM1A, DAPK1, FBP1, PYHIN1, ALPL and SMCHD1 were significant. The hub genes were FGFR1, FGF13 and CCND1. These hub genes were identified from the PPI network, and sub-networks revealed by these genes were involved in significant pathways.
Conclusion: In summary, the study indicated that the combined analysis for identifying target genes with PCa by bioinformatics tools promote our understanding of the molecular mechanisms and underlying the development of PCa. And the hub genes might serve as molecular targets and diagnostic biomarkers for precise diagnosis and treat-ment of PCa.
Keywords: Bioinformatics, Prostate cancer, Differentially expressed gene, DNA methylation
© The Author(s) 2019. This article is distributed under the terms of the Creative Commons Attribution 4.0 International License (http://creat iveco mmons .org/licen ses/by/4.0/), which permits unrestricted use, distribution, and reproduction in any medium, provided you give appropriate credit to the original author(s) and the source, provide a link to the Creative Commons license, and indicate if changes were made. The Creative Commons Public Domain Dedication waiver (http://creat iveco mmons .org/ publi cdoma in/zero/1.0/) applies to the data made available in this article, unless otherwise stated.
Background
DNA methylation, one of the most important epigenetic factors, has been studied extensively over several dec-ades, and its influence in a variety of human diseases, most malignancy tumor, diagnostic biomarkers and ther-apeutic targets, has been firmly measured and evaluated [1–6]. Recently epigenetic study has identified that DNA
methylation is an important biological mechanism for tumor occur and development [5]. In CpG islands, aber-rant methylation could influence the functions of tumor suppressor genes by altering their expression levels. CpG islands are located in or near promoter regions of the genome, aberrant methylation genes in CpG islands are often hypermethylated and may cause silencing of tumor suppressor genes [7]. Variations of DNA methylation exist at CpG islands, including gene hypermethylation-low regulation and hypomethylation-high regulation.
Several studies that have done to investigate DNA methylation in gene body has positively correlated with *Correspondence: [email protected]
Page 2 of 23 Tong et al. Cancer Cell Int (2019) 19:50
gene expression by increasing transcription activity [8]. This may be caused by blocking the intragenic pro-moter activity or affecting the methylation status of repetitive sequence within the transcription unit [9]. So DNA methylation in gene body may be an interest-ing additional therapy target for cancer diagnosinterest-ing and treatment.
Prostate cancer (PCa) is the second most frequently diagnosed male-specific malignancy tumor in western countries. According to the World Health Organization’s International Agency for Research on Cancer, 1.1 million men were diagnosed with prostate cancer worldwide in 2012, accounting for 15% of all cancer diagnosed in men [6]. PCa is considered as a heterogeneous disease [10]. Accumulating evidence has also demonstrated that mul-tiple genes and cellular pathways participate together in the occurrence and development of PCa. Tumor led by epigenetic mutation through cells may grow and repro-duce uncontrollably [11]. Hypomethylation of CpG can cause chromosome instability [12]. Illumina Infinium 450 k microarray and DNA microarray have utilized to investigate DNA methylation and gene expression in molecular mechanism, biological process, molecular diagnosis, tumor molecular, biomarker and drug targets discovery [13–15].
Many gene expression profiling analysis and aberrant methylation analysis were introduced for differentially expressed genes (DEGs) and differentially methylated genes (DMGs) [16]. However, separated analysis of DEGs and DMGs are limited [17, 18]. So it is necessary to make jointly analyze for both gene expression profiling micro-array and gene methylation profiling micromicro-array in PCa. In this study, gene methylation profiling datasets and gene expression profiling datasets were analyzed by bio-informatics tools for screening the DMGs and DEGs. Later, the overlapping of hypermethylation genes, down-regulated genes and tumor suppressor genes were used to identify the candidate tumor suppressor genes. For validating these candidate tumor suppressor genes, TCGA database was used to identify the CpG islands and Oncomine database was used to validate the analyzing result. At last, the biological functions and pathways ana-lyzing were discussed for the molecular mechanism.
Methods
Datasets
In this study, the gene methylation profiling datasets and gene expression profiling datasets were downloaded from Gene Expression Omnibus (https ://www.ncbi.nlm.nih. gov/geo) database. All these gene methylation profiling datasets were based on GPL13534 platform (Illumina HumanMethylation450 BeadChip). For the gene expres-sion profiling datasets were based on GPL570 platform
(Affymetrix Human Genome U133 Plus 2.0 Array). For each dataset, only the samples associated with PCa were selected (Table 1).
Data preprocessing and analyzing
R package affy was used to explore oligonucleotide array analysis by the robust multiarray average (RMA) algo-rithm [19]. While R package methylumiIlluminaHuman-Methylation450kmanifest, limma, minfi, watermelon and IlluminaHumanMethylation450kanno.ilmn12.hg19 were used to analyze the gene methylation profiling data and gene expression profiling data in order to identify DMGs and DEGs. And the R package limma in RStudio 1.1.453 was installed to identify genes that were differen-tially expressed between normal and tumor samples. The Benjamini and Hochberg (BH) procedure were obtained to control the False Discovery Rate (FDR) [20]. Then the log2-fold change (log2FC) was calculated. The adjusted
P value < 0.05 and |log2FC| > 2.0 were considered as the cutoff value for DMGs and DEGs screening.
Functional and pathway enrichment analysis of DMGs and DEGs
In order to analyze the DMGs and DEGs for the func-tional enrichment, GO enrichment and KEGG path-way analysis were performed using DAVID (https :// david .ncifc rf.gov). In this paper, DMGs and DEGs were uploaded to online analysis tool to systematically inves-tigate biological meanings behind these genes [21]. Gene ontology analysis (GO) is a common useful method for annotating genes for identifying biological process (BP), cellular component (CC) and molecular function (MF) [22, 23]. At the same time, Kyoto Encyclopedia of Genomes (http://www.genom e.jp) pathway enrichment
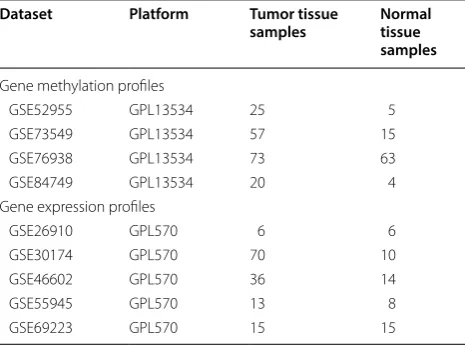
Table 1 Datasets for gene methylation profiling and gene expression profiling associated with PCa
Dataset Platform Tumor tissue
samples Normal tissue samples
Gene methylation profiles
GSE52955 GPL13534 25 5
GSE73549 GPL13534 57 15
GSE76938 GPL13534 73 63
GSE84749 GPL13534 20 4
Gene expression profiles
GSE26910 GPL570 6 6
GSE30174 GPL570 70 10
GSE46602 GPL570 36 14
GSE55945 GPL570 13 8
networks. It can measure networks by nodes, edges, degrees and network structures, so it can help us to identify hub genes and key protein community. Then, PPI networks were constructed by Cytoscape software (http://www.cytos cape.org). Cytoscape is an open source software platform for visualizing molecular interaction networks, biological pathways and integrating these net-works with annotations, gene expression profiles and other state data. A plugin named cytoHubba was intro-duced to screen hub genes of PPI network in Cytoscape. CytoHubba can provide 12 topological analysis methods including Betweenness, BottleNeck, Closeness, Clus-tering Coefficient, Degree, DMNC, EcCentricity, EPC, MCC, MNC, Radiality and Stress based on shortest paths [25].
Results
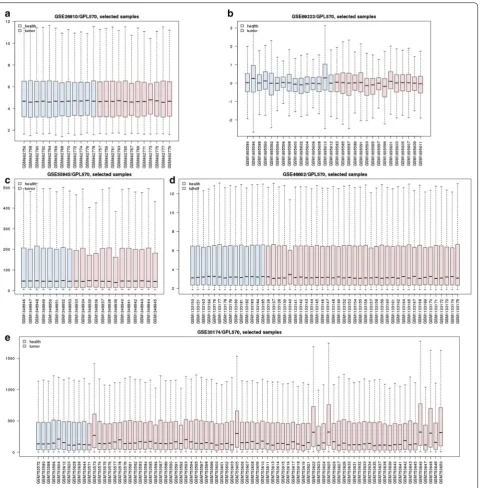
Normalization of gene methylation profiling and gene expression profiling
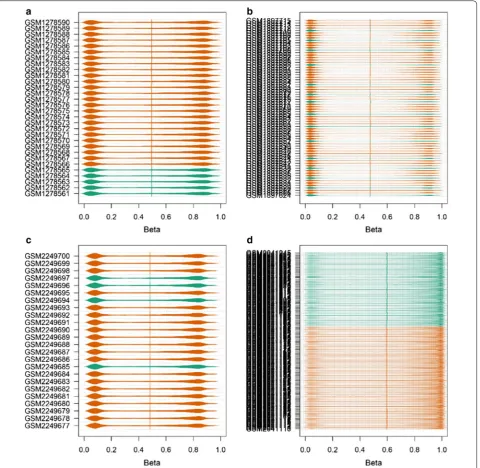
In this study, the five gene expression profiling data-set (Fig. 1) and four gene methylation profiling dataset (Fig. 2) were separately analyzed by R package affy and online GEO2R (https ://www.ncbi.nlm.nih.gov/geo/geo2r /) for screening DEGs and DMGs. All the gene expres-sion profiling microarray chips were based on affym-etrix GPL 570 platform. On affymaffym-etrix arrays, genes are represented by one or more probe sets, which are short oligonucleotides covering distinct sections of the gene synthesised in place through photolithography [26].
While on Illumina BeadChips arrays, 50 base pairs Infinium methylation probes synthesised by bisulfite con-version of unmethylated cytosines, which are randomly dispersed over the array [27]. This random allocation means that each probes was represented a random num-ber of times on each array.
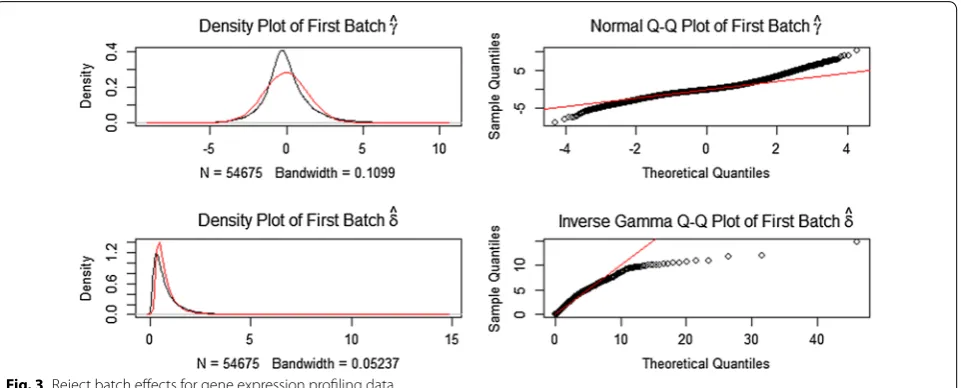
Microarrays and bead chips technologies depend on a complicated set of reagents and hardware, along with highly trained personnel, to produce accurate measure-ments. Both biological and non-biological factors will affect the results during the experiment when a series of complicated set of reagents and hardware varied [28]. So batch effects in different microarrays and bead chips
Identification of DEGs and DMGs in PCa
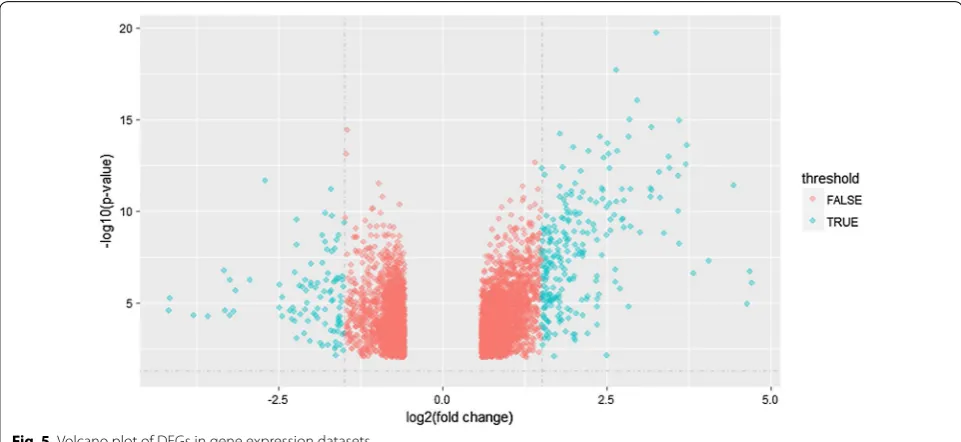
After data normalizing and removing batch effects, total of 1331 DEGs were identified, using P < 0.05 and log2-fold change |log2FC| > 2.0 criteria, of which, 938 up-regulated genes and 393 down-regulated genes (Fig. 5). For DMGs, total of 3261 DMGs were identified according P < 0.05, log2-fold change |log2FC| > 2.0 and fwer < 0.5 criteria, of which, 2699 hypermethylation genes and 562 hypometh-ylation genes. The result has been shown as the volcano plot in Fig. 6.
Aberrantly methylated‑differentially expressed genes in PCa
Then, totally 62 hypermethylation-low genes were obtained by overlapping 2699 hypermethylation genes and 393 down-regulated genes in Fig. 7. And 41 hypo-methylation-high genes were obtained by overlapping 362 hypomethylation genes and 938 up-regulated genes in Fig. 7.
Integrating dataset for screening candidate tumor suppressor genes
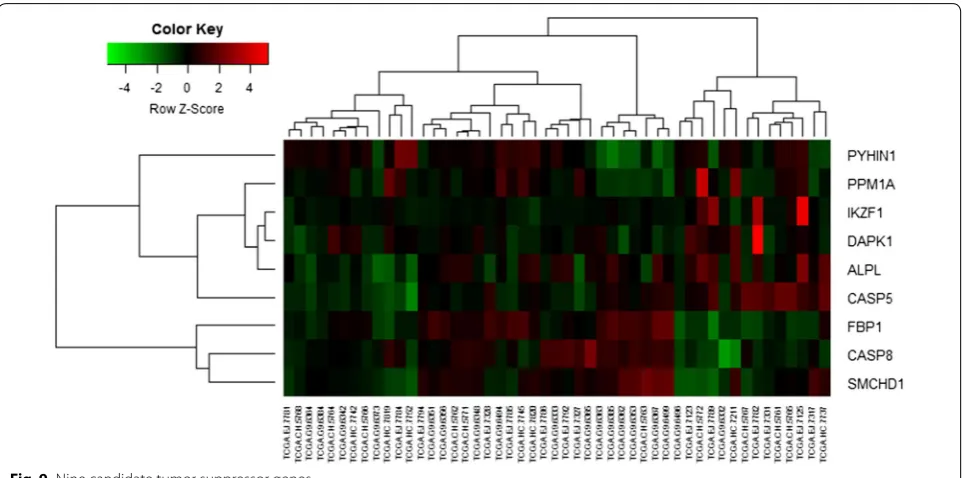
Then, totally 9 candidate tumor suppressor genes were obtained by overlapping 2699 hypermethylation genes, 393 down-regulated genes and 1217 human tumor sup-pressor genes [30] in Fig. 8.
The heat map of nine candidate tumor suppressor genes (IKZF1, PPM1A, FBP1, SMCHD1, ALPL, CASP5, PYHIN1, DAPK1 and CASP8) was shown as Fig. 9. Although these tumor suppressor genes were hyper-methylation-low genes, these genes were not significant in some samples for TCGA database.
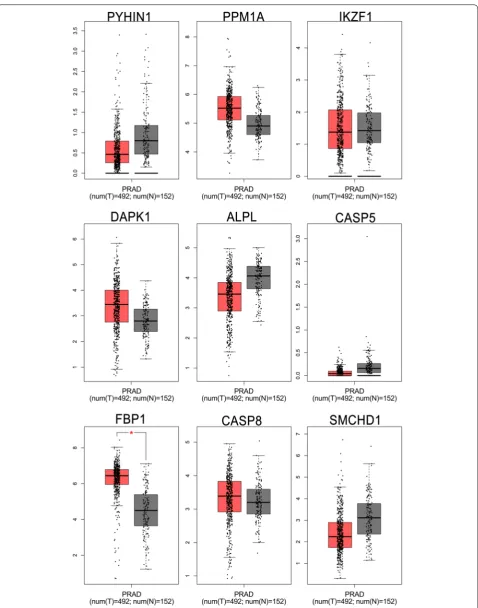
Validation of candidate tumor suppressor genes in TCGA database
Page 4 of 23 Tong et al. Cancer Cell Int (2019) 19:50
tumor samples, at the same time, PYH1N1, ALPL and SMCHD1 were hypermethylation in normal samples. And then, in order to further confirm these candi-date tumor suppressor genes the MethPrimer [31] and
Integrated Oncomine database and survival analysis for candidate tumor suppressor genes
To confirm the candidate tumor suppressor genes expres-sion between tumor and normal tissues in multiple can-cers, the Oncomine database was performed to analyze the different expression. Using P < 0.01 and |log2FC| > 1.5 criteria, a total of 455, 455, 444, 398, 341, 407, 342, 453
Page 6 of 23 Tong et al. Cancer Cell Int (2019) 19:50
KAPK1 was founded in cancers based on sixty-one sig-nificant analyses.
To further confirm the candidate tumor suppressor genes, Kaplan–Meier analysis was performed in Fig. 14. All the low expression values of tumor suppressor genes are all significantly associated with poor prognosis while a high expression of tumor suppressor genes are associ-ated with good prognosis.
The Gleason Score (GS) system for grading PCa is a standard evaluation method that has different stratifica-tion: GS ≤ 6, 3 + 4, 4 + 3, 8, 4 + 5, 5 + 4, 10, respectively to
Gleason Grading Group 1, 2, 3, 4, and 5 [33]. Expression of candidate tumor suppressor genes according Gleason Score system is shown in Fig. 15. A low Gleason score (≤ 6) indicates good prognosis without risk of lymphatic
metastasis whereas a high Gleason score (> 8) is associ-ated with distal metastasis.
The expression of IKZF1, PPM1A, FBP1, SMCHD1, ALPL, CASP5, PYHIN1, DAPK1 and CASP8 candidate tumor suppressor genes was significantly deregulated in PCa by Gleason Score (Table 2). The significant genes observed were PYHIN1, IKZF1, CASP8, DAPK1 and SMCHD1 expression in tumor samples. Furthermore, FBP1 was deregulated at Gleason Score 6–9.
Gene ontology enrichment analysis and KEGG pathway analysis
In order to uncover these genes affected by altered DNA methylation status, all hypermethylation-low expression genes and hypomethylation-high expression genes were uploaded to DAVID database to identify overrepresented BP categories and KEGG pathways. The top 10 signifi-cant GO enrichments of biological processes were illus-trated in Table 3.
KEGG pathways analysis were also significantly enriched in PCa genes in Table 4. And the relationships between these pathways were shown in Fig. 16. Further-more, GSEA (Gene Set Enrichment Analysis) was con-ducted to verify KEGG enrichment analysis in Fig. 16. All of these pathways were significantly enriched in Pathway in cancer, Wnt signaling pathway, Pancreatic cancer and Melanoma (Fig. 17). And most of these genes were up-regulated, which show a credible knowledge of PCa.
PPI network construction and module analysis
All hypermethylation-low expressed genes and hypo-methylation-high expressed genes were uploaded to the STRING database for constructing PPI network. Moreover, all these nodes and edges were analyzed using Cytoscape plug-ins called cytoHubba. For hypermeth-ylation-low expressed genes, PPI network was shown in Fig. 18a and top modules were displayed in Fig. 18b. Hub genes were CASP1, STAT4 and IRF7.
For hypomethylation-high expressed genes, PPI net-work was shown in Fig. 19a and top modules were dis-played in Fig. 19b. Hub genes were FGFR1, FGF13 and CCND1. Biological process of significant hub genes were demonstrated in Table 5.
Interlink between candidate genes with prostate specific antigen (PSA)
PSA, a combined bioinformatics tools were utilized. Firstly, the Universal Protein Resource (UniProt) was used to get the PAS amino acid sequence (Additional file 1). Secondly, the PAS amino acid sequence and can-didate genes were uploaded to BlastKOALA (https :// www.kegg.jp/blast koala /) for genome annotation. Finally, all the annotated genes were uploaded to KEGG PATH-WAY Database (https ://www.kegg.jp/kegg/pathw ay.html)
Page 8 of 23 Tong et al. Cancer Cell Int (2019) 19:50
Fig. 5 Volcano plot of DEGs in gene expression datasets
in apoptosis. The methylation of DAPK1 has interlink with cancer.
Discussion
Since microarray and high-throughput sequencing can provide expression levels of thousands of genes in human genome simultaneously, it has been widely used to pre-dict the potential therapeutic targets for PCa. In this study, we conducted a combined analysis of two types of microarray chips (DNA methylation and gene expression profile datasets) of PCa for uncovering the epigenetic and genetic mechanisms in PCa using bioinformatics analy-sis tools. By overlapping DEGs, DMGs and TSGs (tumor suppressor genes), we identified some candidate tumor suppressor genes that can provide new ideas for diag-nosis, therapy and biomarker studies in PCa. In order to better understand the molecular mechanism of candidate tumor suppressor genes and hub genes, GO, KEGG path-way and PPI analysis were further performed.
The results demonstrated that these hypermethylation-low expressed genes were enriched in cytokine-medi-ated signaling pathway, benzene-containing compound Fig. 7 Venn diagram [29] for aberrantly methylated-differentially expressed genes by overlapping gene expression datasets and gene methylation datasets (a hypermethylation and down-regulated genes; b hypomethylation and up-regulated genes)
Page 10 of 23 Tong et al. Cancer Cell Int (2019) 19:50
metabolic process, kynurenine metabolic process, posi-tive regulation of cysteine-type endopeptidase activ-ity involved in apoptotic process, indolalkylamine catabolic process, response to vitamin, cellular response to mechanical stimulus, tryptophan catabolic process, tryptophan metabolic process and positive regulation of transcription, DNA-templated.
This indicated that cytokines is associated with pros-tate cancer. Some evidence shows the role of cytokines in prostate carcinogenesis. Cytokines are widely recog-nized as crucial factors in cancer development. In the progress of cancer development, cytokines were released by other immune cells. And cytokines enhance thera-peutic resistances through EMT activation in tumor microenvironment [49]. Kynurenine has relationship with immune escape of tumor cells [50]. Srekumar et al. found that Kynurenine was associated with prostate can-cer (PCa) progression [51]. More and more experimental researches have indicated that vitamin D has the effects of anti-prostate tumor [52, 53]. Like vitamin D, vitamin C was also natural product that has the property of antioxi-dant [54]. So vitamin C also plays an important role for antitumor due to characterize of antioxidant [55].
Furthermore, the enriched KEGG pathways of hyper-methylation-low expressed genes have significant enrichment in NOD-like receptor signaling pathway, Pentose phosphate pathway, Viral carcinogenesis, Tryp-tophan metabolism, Measles_Homo sapiens, Hepatitis B, Legionellosis, Cytosolic DNA-sensing pathway and Influ-enza A and Inflammatory bowel disease (IBD). Cumu-lative evidence revealed that the pentose phosphate pathway (PPP) is a metabolic pathway, parallel to glycoly-sis that generates NADPH, nucleotides and nucleic acids [56]. Heritable factors and environmental factors may cause prostate cancer together. Recent research focus on the role of viral infections in prostate cancer [57]. Cytosolic DNA sensing is associated to the secretion of cytokines [58]. Cytosolic DNA sensing mediates robust antimicrobial. Cancer cells often acquire genetic or epi-genetic alterations [59, 60]. Cytosolic DNA sensing is important for tumor control. In cytosolic DNA sensing, transcriptional and post-translational signaling modules enable the release of immunomodulatory cytokines [58].
Page 12 of 23 Tong et al. Cancer Cell Int (2019) 19:50
network by the network. CytoHubba provides 12 topo-logical analysis methods including Betweenness, Bottle-Neck Closeness, Clustering Coefficient, Degree, DMNC, EcCentricity, EPC, MCC, MNC, Radiality and Stress [23]. The hub genes appeared to be FGFR1, FGF13 AND CCND1.
role during in tumor metastasis and progression [64]. Recent studies have indicated that inducing EMT can affect tumor microenvironment [65].
Page 14 of 23 Tong et al. Cancer Cell Int (2019) 19:50
involving a nucleolus-dependent mechanism [68]. It is possible that FGF13 may similarly signal to p53 by the same underlying molecular mechanism. FGF13 expres-sion would activate p53, whereas the up-regulation of miR-504 would antagonize such an effect. It will be important to explore this issue directly in future stud-ies [69]. Although the augmented FGF13 expression in tumors is unlikely to be a cancer driver, it is not merely a passenger, because it allows the cancer cells to cope with undesirable side effects of oncogene activation [68]. So FGF 13 may be reviewed as a cancer switch [70]. Cycline D1 (CCND1) plays a significant role in cell cycle. The over-expression of CCND1 in human tumors has been indicated as proto-oncogenes [71–77].
For tumor suppressor genes, IKAROS family zinc fin-ger 1 (IKZF1) is a key regulator factor that enhanced
immune infiltrate recruitment and tumor sensitiv-ity in several tumors. Overexpression of IKZF1 can activate autoimmune susceptibility via infiltrating NKG2D+, CD8+ T cells [78]. Protein phosphatase,
Mg2+/Mn2+dependent 1A (PPM1A) is a
phos-phatase that has been the function of dephosphorylat-ing TGF-β–activated P-Smad2/3, p38 and regulatdephosphorylat-ing several tumor-related signaling pathways [79, 80]. As a phosphatase PPM1A plays a significant role in cell cycle progression, cell proliferation, and apoptosis [81–83]. Previous study indicated that metastatic prostate can-cer had lower PPM1A expression compared with pri-mary tumor [84]. Overexpression of PPM1A has been reported to activate the expression of tumor suppressor gene TP53 [82] and increased PPM1A expression inhib-ited the activity of NF-kB in promoting prostate cancer
Analysis Type by Cancer Cancer Cases
Bladder Cancer 288 1 1 2 1 1
Brain and CNS Cancer 1,531 1 1 6 1 6 2 3
Breast Cancer 1,602 3 1 2 10 8 1 1 10 2 1 3
Cervical Cancer 200 1 3 3 1
Colorectal Cancer 881 1 7 2 14 2 17 4 2 5 7
Esophageal Cancer 132 1 5 1 2 3
Gastric Cancer 637 3 4 1 2 1
Head and Neck Cancer 628 2 1 1 1 1 3 1 1 1
Leukemia 392 1 2 1 4 2 6 2 3 1 1 1 1 2 3 3 2
Liver Cancer 212 1 1 2 4 3 1 2 1 1
Lung Cancer 1,537 1 1 1 12 1 8 1 12 2
Melanoma 630 1
Ovarian Cancer 1,168 1 2
Prostate Cancer 380 6 1 7
Sarcoma 107 2 10 5 1 1 1 1
16 27 16 49 32 48 38 31 5 23 6 7 5 16 31 30 19 4
1 5 10 10 5 1
% Significant Unique Analyses
Total Unique Analyses 455 455 444 453 398 Cancer vs. Normal PYHIN1 Cancer vs. Normal DAPK1 Cancer vs. Normal CASP8
398 341 407 342 Cancer vs. Normal CASP5 Cancer vs. Normal IKZF1 Cancer vs. Normal PPM1A Cancer vs. Normal FBP1 Cancer vs. Normal SMCHD1 Cancer vs. Normal ALPL
invasion and metastasis [85]. Fructose-bisphosphatase 1 (FBP1) palys negative regulation roles in glycolysis and affects some process of survival, proliferation and metastasis in tumor cells [86, 87]. Some studies also showed that overexpressed FBP1 in prostate cancers can be as a tumor biomarker [88, 89]. Structural main-tenance of chromosomes flexible hinge domain con-taining 1 (SMCHD1) is a chromatin protein associated with epigenetic modifier [90]. Alkaline phosphatase
Page 16 of 23 Tong et al. Cancer Cell Int (2019) 19:50
[94]. Death associated protein kinase 1 (DAPK1) is a kinase regulated neuronal apoptosis by calcium-calm-odulin. So far, a large number of studies have demon-strated that DAPK1 acts as a positive mediator interact with several proteins, such as DAPK1-p53 signaling, DAPK1-tau signaling, and DAPK1-DANGER signaling [95–98]. Caspase-8 (CASP8) acts as an environment sensor in the control of cell death. CASP8 induced a wide range of biological process, such as the control of apoptosis and necroptosis [99].
All the genes and pathways in this investigation are all based on bioinformatics methods. So no clinical samples were used to validate the data. But a shot lit-erature review was introduced to confirm out findings. Fig. 15 Expression of candidate tumor suppressor genes according Gleason Score system
Table 2 Expression of candidate tumor suppressor genes in different PCa stage
Up: up-regulated; down: down-regulated; no sig: no significant Candidate tumor
suppressor gene Gleason Score (GS)
GS = 6 GS = 7 GS = 8 GS = 9 GS = 10
IKZF1 No sig No sig No sig No sig Up
PPM1A No sig No sig No sig Down Down
FBP1 Up Up Up Up Down
SMCHD1 No sig Down No sig No sig Up
ALPL Down Down Down Down Down
CASP5 Down Down No sig Down No sig
PYHIN1 No sig No sig No sig No sig Up
DAPK1 Up Up Up Up Up
Tryptophan metabolic process 5.11E−04
Positive regulation of transcription, DNA-templated 5.11E−04
Hypomethylation-high expression Regulation of transforming growth factor beta2 production 1.43E−02
Regulation of receptor recycling 6.14E−04
Membrane raft assembly 1.43E−02
Telencephalon cell migration 1.43E−02
Regulation of endothelial cell chemotaxis to fibroblast growth factor 1.63E−02
Positive regulation of vesicle fusion 1.43E−02
Negative regulation of protein depolymerization 8.40E−04
Positive regulation of receptor binding 1.43E−02
Nodal signaling pathway 1.83E−02
Positive regulation of vascular endothelial cell proliferation 2.03E−02
Table 4 KEGG pathway analysis of aberrantly methylated-differentially expressed genes in PCa
Category Pathway P‑value
Hypermethylation-low expression NOD-like receptor signaling pathway 7.37E−04
Pentose phosphate pathway 3.64E−03
Viral carcinogenesis 3.76E−03
Tryptophan metabolism 6.84E−03
Measles 8.68E−03
Hepatitis B 1.05E−02
Legionellosis 1.26E−02
Cytosolic DNA-sensing pathway 1.69E−02
Influenza A 1.71E−02
Inflammatory bowel disease (IBD) 1.74E−02
Hypomethylation-high expression Pathways in cancer 1.47E−04
MAPK signaling pathway 1.67E−04
Wnt signaling pathway 2.01E−04
Colorectal cancer 2.78E−04
Pancreatic cancer 3.35E−04
Melanoma 4.15E−04
AGE-RAGE signaling pathway in diabetic complications 1.16E−03
Insulin resistance 1.44E−03
FoxO signaling pathway 2.55E−03
Page 18 of 23 Tong et al. Cancer Cell Int (2019) 19:50
Fig. 16 KEGG pathway analysis of aberrantly methylated-differentially expressed genes in PCa
Conclusions
In this study, a joint bioinformatics analysis method was used for indicating candidate tumor suppressor genes and pathways in PCa by combined gene meth-ylation microarrays and gene expression microar-ray, this may provide a set of useful targets for future
Page 20 of 23 Tong et al. Cancer Cell Int (2019) 19:50
Fig. 19 PPI network and hypomethylation-high expression genes (a PPI network; b top module; c hub genes)
Table 5 GO terms analysis of hub genes in PCa
Category Term P‑value
Hypermethylation-low expression Negative regulation of myeloid cell apoptotic process 1.05E−03
Positive regulation of tumor necrosis factor-mediated signaling pathway 1.20E−03
Regulation of macrophage apoptotic process 1.05E−03
Regulation of myd88-independent toll-like receptor signaling pathway 1.35E−03
Protein autoprocessing 1.50E−03
Establishment of viral latency 1.50E−03
Interleukin-23-mediated signaling pathway 1.50E−03
Cellular response to interferon-gamma 1.01E−04
Interleukin-21-mediated signaling pathway 1.35E−03
Regulation of myeloid leukocyte differentiation 1.65E−03
Hypomethylation-high expression Telencephalon cell migration 1.05E−03
Regulation of endothelial cell chemotaxis to fibroblast growth factor 1.20E−03 Positive regulation of vascular endothelial cell proliferation 1.50E−03
Response to UV-A 1.05E−03
Cerebral cortex cell migration 1.05E−03
Regulation of collateral sprouting 1.20E−03
Neuron migration 1.23E−05
Positive regulation of protein serine/threonine kinase activity 1.05E−04
Mitotic G1 DNA damage checkpoint 1.65E−03
development of PCa. Meanwhile, there were some lim-itations should be declared in this work. The clinical gene methylation profiling and gene expression profil-ing datasets were not analyzed in this study. Besides, the hub genes on gene expression were only validated in TCGA database.
Additional file
Additional file 1. Supplementary S1-PAS protein sequence.
Abbreviations
PCa: prostate cancer; GEO: Gene Expression Omnibus; DEG: differentially expressed gene; DMG: differentially methylated gene; TSG: tumor suppressor gene; DAVID: Database for Annotation, Visualization and Integrated Discovery; GO: gene ontology; KEGG: Kyoto Encyclopedia of Genes and Genomes; PPI: protein–protein interaction; STRING: Search Tool for the Retrieval of Interacting Genes; TCGA : The Cancer Genome Atlas; BP: biological process; BH: Benjamini and Hochberg; log2FC: log2-fold change.
Authors’ contributions
YT and SD conceived the study; YS collected the data; YT wrote the R code; YT wrote the paper. All authors read and approved the final manuscript.
Author details
1 Laboratory of Forensic Medicine and Biomedical Informatics, Chongqing Medical University, Chongqing 400016, People’s Republic of China. 2 School of Humanity, Chongqing Jiaotong University, Chongqing 400074, People’s Republic of China. 3 Department of Device, Chongqing Medical University, Chongqing 400016, People’s Republic of China.
Acknowledgements
Not applicable.
Competing interests
The authors declare that they have no competing interests.
Availability of data and materials
The authors declare that the data supporting the findings of this study are available within the article.
Consents for publication
Not applicable.
Ethics approval and consent to participate
Not applicable.
Funding
Page 22 of 23 Tong et al. Cancer Cell Int (2019) 19:50
Publisher’s Note
Springer Nature remains neutral with regard to jurisdictional claims in pub-lished maps and institutional affiliations.
Received: 16 August 2018 Accepted: 8 February 2019
References
1. Jones PA. DNA methylation and cancer. Cancer Res. 1986;46:461–6. 2. Kulis M, Esteller M. DNA methylation and cancer. Adv Genet.
2010;70:27–56.
3. Laird PW. The power and the promise of DNA methylation markers. Nat Rev Cancer. 2003;3:253–66.
4. Rakyan VK, Down TA, Balding DJ, et al. Epigenome-wide association stud-ies for common human diseases. Nat Rev Genet. 2011;12(8):529. 5. Lo KW, Huang DP. Genetic and epigenetic changes in nasopharyngeal
carcinoma. Semin Cancer Biol. 2002;12(6):451–62.
6. World Health Organization. GLOBOCAN 2012: estimated cancer inci-dence, mortality, and prevalence worldwide in 2012; 2012. http://globo can.iarc.fr/Pages /fact_sheet s_cance r.aspx. Accessed 1 Apr 2018. 7. Wang Qian, Wang Gang, Liu Chaoxu, He Xianli. Prognostic value of CpG
island methylator phenotype among hepatocellular carcinoma patients: a systematic review and meta-analysis. Int J Surg. 2018;54:92–9. 8. Yang X, Han H, De Carvalho D, et al. Gene body methylation can alter
gene expression and is a therapeutic target in cancer. Cancer Cell. 2014;26(4):585.
9. Maunakea AK, Nagarajan RP, Bilenky M, et al. Conserved role of intra-genic DNA methylation in regulating alternative promoters. Nature. 2010;466(7303):253–7.
10. Aran V, Victorino AP, Thuler LC, Ferreira CG. Colorectal cancer: epide-miology, disease mechanisms and interventions to reduce onset and mortality. Clin Colorectal Cancer. 2016;15(3):195–203.
11. Decarvalho D, Sharma S, You JS, et al. DNA methylation screening identifies driver epigenetic events of cancer cell survival. Cancer Cell. 2012;21(5):655.
12. Feinberg AP, Tycko B. The history of cancer epigenetics. Nat Rev Cancer. 2004;4(2):143–53.
13. Kulasingam V, Diamandis EP. Strategies for discovering novel cancer biomarkers through utilization of emerging technologies. Nat Clin Pract Oncol. 2008;5:588–99.
14. Nannini M, Pantaleo MA, Maleddu A, et al. Gene expression profiling in colorectal cancer using microarray technologies: results and perspec-tives. Cancer Treat Rev. 2009;35:201–9.
15. Bustin SA, Dorudi S. Gene expression profiling for molecular staging and prognosis prediction in colorectal cancer. Exp Rev Mol Diagn. 2004;4:599–607.
16. Carmona FJ, Azuara D, Berenguer-Llergo A, Fernandez AF, Biondo S, de Oca J, Rodriguez-Moranta F, Salazar R, Villanueva A, Fraga MF, et al. DNA methylation biomarkers for noninvasive diagnosis of colorectal cancer. Cancer Prev Res. 2013;6(7):656–65.
17. Lascorz J, Hemminki K, Forsti A. Systematic enrichment analysis of gene expression profiling studies identifies consensus pathways implicated in colorectal cancer development. J Carcinog. 2011;10:7.
18. Iwaya T, Yokobori T, Nishida N, et al. Downregulation of miR-144 is associ-ated with colorectal cancer progression via activation of mTOR signaling pathway. Carcinogenesis. 2012;33(12):2391–7.
19. Irizarry RA. Exploration, normalization, and summaries of high density oligonucleotide array probe level data. Biostatistics. 2003;4:249–64. 20. Benjamini Y. Controlling the false discovery rate: a practical and powerful
approach to multiple testing. J R Stat Soc. 1995;57:289–300.
21. Glynn Dennis J, Sherman BT, Hosack DA, et al. DAVID: database for anno-tation, visualization, and integrated discovery. Genome Biol. 2003;4(5):3. 22. Gene Ontology C. The gene ontology (GO) project in 2006. Nucleic Acids
Res. 2006;34:322–6.
23. Ashburner M, Ball CA, Blake JA, et al. Gene ontology: tool for the unifica-tion of biology. The Gene Ontology Consortium. Nat Genet. 2000;25:25–9. 24. Kanehisa M, Goto S. KEGG: kyoto encyclopedia of genes and genomes.
Nucleic Acids Res. 2000;28:27–30.
25. Chin CH, et al. cytoHubba: identifying hub objects and sub-networks from complex interactome. BMC Syst Biol. 2014;8(Suppl 4):S11. 26. Wilder SP, Kaisaki PJ, Argoud K, et al. Comparative analysis of methods
for gene transcription profiling data derived from different microarray technologies in rat and mouse models of diabetes. BMC Genomics. 2009;10(1):63.
27. Michael KL, Taylor LC, Schultz SL, Walt DR. Randomly ordered addressable high-density optical sensor arrays. Anal Chem. 1998;70(7):1242–8. 28. Leek JT, Scharpf RB, Bravo HC, et al. Tackling the widespread and
criti-cal impact of batch effects in high-throughput data. Nat Rev Genet. 2010;11(10):733–9.
29. Bardou P, Mariette J, Escudié F, et al. jvenn: an interactive Venn diagram viewer. BMC Bioinform. 2014;15(1):1–7.
30. Min Z, Kim P, Mitra R, et al. TSGene 2.0: an updated literature-based knowledgebase for tumor suppressor genes. Nucleic Acids Res. 2016;44(Database issue):D1023–31.
31. Li LC, Dahiya R. MethPrimer: designing primers for methylation PCRs. Bioinformatics. 2002;18(11):1427–31.
32. Chandrashekar DS, Bashel B, Balasubramanya SAH, Creighton CJ, Rodriguez IP, Chakravarthi BVSK, Varambally S. UALCAN: a portal for facilitating tumor subgroup gene expression and survival analyses. Neoplasia. 2017;19(8):649–58.
33. Epstein JI, Zelefsky MJ, Sjoberg DD, Nelson JB, Egevad L, Magi-Galluzzi C. A contemporary prostate cancer grading system: a validated alterna-tive to the Gleason score. Eur Urol. 2015;69:428–35.
34. Flocks RH, Urich VC, Patel CA, et al. Studies on the antigenic properties of prostatic tissue. J Urol. 1960;84(1):134.
35. Pérez-Ibave DC, Burciaga-Flores CH, Elizondo-Riojas MÁ. Prostate-specific antigen (PSA) as a possible biomarker in non-prostatic cancer: a review. Cancer Epidemiol. 2018;54:48–55.
36. Flocks RH, et al. Studies on spermagglutinating antibodies in antihu-man prostate sera. J Urol. 1962;87:475–8.
37. Catalona WJ. History of the discovery and clinical translation of prostate-specific antigen. Asian J Urol. 2014;1(1):12–4.
38. Tokudome S, Ando R, Koda Y. Discoveries and application of prostate-specific antigen, and some proposals to optimize prostate cancer screening. Cancer Manag Res. 2018;8:45–7.
39. Ablin RJ, et al. Precipitating antigens of the normal human prostate. J Reprod Fertil. 1970;22(3):573–4.
40. Li TS, Beling CG. Isolation and characterization of two specific antigens of human seminal plasma. Fertil Steril. 1973;24(2):134–44.
41. Sokoll L J, Chan D W. Prostate-specific antigen. Its discovery and biochemical characteristics. Urologic Clinics of North America. 1997; 24(2):253-259.
42. Sensabaugh GF. Isolation and characterization of a semen-specific protein from human seminal plasma: a potential new marker for semen identification. J Forensic Sci. 1978;23(1):106–15.
43. Sensabaugh GF, Blanke ET. Seminal plasma protein p30: simplified purification and evidence for identity with prostate specific antigen. J Urol. 1990;144(6):1523–6.
44. Fu G, Tang J, Wang M, et al. CASP8 promoter polymorphism, mRNA expression and risk of prostate cancer among Chinese men. J Biomed Res. 2011;25(2):128–34.
45. Hengartner MO. The biochemistry of apoptosis. Nature. 2000;407:770–6.
46. Noel EE, Yeste-Velasco M, Mao X, et al. The association of CCND1 over-expression and cisplatin resistance in testicular germ cell tumors and other cancers. Am J Pathol. 2010;176(6):69.
47. Borst P, Rottenberg S, Jonkers J. How do real tumors become resistant to cisplatin? Cell Cycle. 2008;7:1353–9.
48. Houldsworth J, Korkola JE, Bosl GJ, et al. Biology and genetics of adult male germ cell tumors. J Clin Oncol. 2006;24(35):5512–8.
49. Tan C, Hu W, He Y, et al. Cytokine-mediated therapeutic resistance in breast cancer. Cytokine. 2018;108:151–9.
50. Mellor AL, Munn DH. Tryptophan catabolism and T-cell toler-ance: immunosuppression by starvation? Immunol Today. 1999;20(10):469–73.
genetic alterations and immune response. A literature review. Int J Surg. 2018;52:136.
58. Claire VB, Sandra D, Formenti SC, et al. Cytosolic dna sensing in organis-mal tumor control. Cancer Cell. 2018;34(3):361–78.
59. Ying KC, Gack MU. Viral evasion of intracellular DNA and RNA sensing. Nat Rev Microbiol. 2016;14(6):360–73.
60. Marinho FV, Benmerzoug S, Oliveira SC, et al. The emerging roles of STING in bacterial infections. Trends Microbiol. 2017;25:906–18.
61. Li Q, Ingram L, Kim S, et al. Paracrine fibroblast growth factor initiates oncogenic synergy with epithelial FGFR/Src transformation in prostate tumor progression 12. Neoplasia. 2018;20(3):233–43.
62. Wu YM, Su F, Kalyana-Sundaram S, et al. Identification of targetable FGFR gene fusions in diverse cancers. Cancer Discov. 2013;3(6):636. 63. Bova GS, Kallio HML, Annala M, et al. Integrated clinical, whole-genome,
and transcriptome analysis of multisampled lethal metastatic prostate cancer. Cold Spring Harb Mol Case Stud. 2016;2(3):a000752.
64. François B, Catherine N, Gwenaëlle G, et al. FGFR1 and WT1 are markers of human prostate cancer progression. BMC Cancer. 2006;6(1):272. 65. Hu M, Polyak K. Molecular characterization of the tumor
microenviron-ment in breast cancer. Cancer Cell. 2004;6(1):17–32.
66. Hoek K, Rimm DL, Williams KR, et al. Expression profiling reveals novel pathways in the transformation of melanocytes to melanomas. Cancer Res. 2004;64(15):5270–82.
67. Missiaglia E, Dalai I, Barbi S, et al. Pancreatic endocrine tumors: expres-sion profiling evidences a role for AKT-mTOR pathway. J Clin Oncol. 2010;28(2):245–55.
68. Bublik DR, Bursać S, Sheffer M, et al. Regulatory module involving FGF13, miR-504, and p53 regulates ribosomal biogenesis and supports cancer cell survival. Proc Natl Acad Sci USA. 2016;114(4):201614876. 69. Manfredi JJ. Tumor suppression by p53 involves inhibiting an enabler,
FGF13. Proc Natl Acad Sci USA. 2017;114(4):632.
70. Luo J, Solimini NL, Elledge SJ. Principles of cancer therapy: oncogene and non-oncogene addiction. Cell. 2009;136(5):823.
71. Schuuring E. The involvement of the chromosome 11q13 region in human malignancies: cyclin D1, and EMS1, are two new candidate oncogenes-a review. Gene. 1995;159(1):83–96.
72. Ormandy CJ, Musgrove EA, Hui R, et al. Cyclin D1, EMS1 and 11q13 ampli-fication in breast cancer. Breast Cancer Res Treat. 2003;78(3):323–35. 73. Bertoni F, Rinaldi A, Zucca E, et al. Update on the molecular biology of
mantle cell lymphoma. Hematol Oncol. 2006;24(1):22–7.
74. Jin M, Inoue S, Umemura T, et al. Cyclin D1, p16 and retinoblastoma gene product expression as a predictor for prognosis in non-small cell lung cancer at stages I and II. Lung Cancer. 2001;34(2):207–18.
75. Kim JK, Diehl JA. Nuclear cyclin D1: an oncogenic driver in human cancer. J Cell Physiol. 2009;220(2):292–6.
76. Musgrove EA. Cyclins: roles in mitogenic signaling and oncogenic trans-formation. Growth Fact. 2006;24(1):13.
77. Shamma A, Doki Y, Shiozaki H, et al. Cyclin D1 overexpression in esoph-ageal dysplasia: a possible biomarker for carcinogenesis of esophesoph-ageal squamous cell carcinoma. Int J Oncol. 2000;16(2):261.
78. Chen James C, Perez-Lorenzo Rolando, Saenger Yvonne M, Drake Charles G, Christiano Angela M. IKZF1 enhances immune infiltrate recruitment in solid tumors and susceptibility to immunotherapy. Cell Systems. 2018;7(1):92–103.
dependent 1 A (PPM1A) plays a role in the differentiation and survival processes of nerve cells. PLoS ONE. 2012;7:e32438.
84. Lu X, An H, Jin R, et al. PPM1A is a RelA phosphatase with tumor suppressor-like activity. Oncogene. 2014;33(22):2918.
85. Lu X, An H, Jin R, et al. PPM1A is a RelA phosphatase with tumor suppressor-like activity. Oncogene. 2014;33:2918–27.
86. Dong C, Yuan T, Wu Y, et al. Loss of FBP1 by Snail-mediated repression provides metabolic advantages in basal-like breast cancer Canc. Cell. 2013;23:316–31.
87. Hanahan D, Weinberg RA. Hallmarks of cancer: the next generation. Cell. 2011;144:646–74.
88. Lapointe J, Li C, Higgins JP, Van De Rijn M, Bair E, Montgomery K, Ferrari M, Egevad L, Rayford W, Bergerheim U, Ekman P, DeMarzo AM, Tibshirani R, Botstein D, Brown PO, Brooks JD, Pollack JR. Gene expression profiling identifies clinically relevant subtypes of prostate cancer. Proc Natl Acad Sci. 2014;101:811–6.
89. Liu P, Ramachandran S, Seyed MA, Scharer CD, Laycock N, Dalton WB, Williams H, Karanam S, Datta MW, Jaye DL, Moreno CS. Sex-determining region Y box 4 is a transforming oncogene in human prostate cancer cells. Cancer Res. 2006;46:4011–9.
90. Jansz Natasha, Chen Kelan, Murphy James M, Blewitt Marnie E. The epi-genetic regulator SMCHD1 in development and disease. Trends Genet. 2017;33(4):233–43.
91. Jin LY, Dong YM, Wu XM, Cao GX, Wang GL. Versatile and amplified biosensing through enzymatic cascade reaction by coupling alkaline phosphatase in situ generation of photoresponsive nanozyme. Anal Chem. 2015;87:10429–36.
92. Ramaswamy G, Rao VR, Krishnamoorthy L, Ramesh G, Gomathy R, Renu-kadevi D. Serum levels of bone alkaline phosphatase in breast and pros-tate cancers with bone metastasis. Indian J Clin Biochem. 2000;15:110. 93. Lin XY, Choi MS, Porter AG. Expression analysis of the human caspase-1
subfamily reveals specific regulation of the CASP5 gene by lipopolysac-charide and interferon-gamma. J Biol Chem. 2000;275:39920–6. 94. Connolly DJ, Bowie AG. The emerging role of human PYHIN proteins in
innate immunity: Implications for health and disease. Biochem Pharma-col. 2014;92(3):405–14.
95. Wang X, Pei L, Yan H, Wang Z, Wei N, Wang S, et al. Intervention of death-associated protein kinase 1-p53 interaction exerts the therapeutic effects against stroke. Stroke. 2014;45(10):3089–91.
96. Pei L, Shang Y, Jin H, Wang S, Wei N, Yan H, et al. DAPK1-p53 interaction converges necrotic and apoptotic pathways of ischemic neuronal death. J Neurosci. 2014;34(19):6546–56.
97. Pei L, Wang S, Jin H, Bi L, Wei N, Yan H, et al. A novel mechanism of spine damages in stroke via DAPK1 and Tau Cereb. Cortex. 2015;25(11):4559–71. 98. Kang BN, Ahmad AS, Saleem S, et al. Death-associated protein
kinase-mediated cell death modulated by interaction with DANGER. J Neurosci. 2010;30(1):93–8.

![Fig. 8 Venn diagram [29] for candidate tumor suppressor genes by overlapping hypermethylation genes, down-regulated genes and tumor suppressor genes](https://thumb-us.123doks.com/thumbv2/123dok_us/717573.2069056/9.595.59.540.88.235/venn-diagram-candidate-suppressor-overlapping-hypermethylation-regulated-suppressor.webp)