R E S E A R C H
Open Access
Access to food outlets and children
’
s nutritional
intake in urban China: a difference-in-difference
analysis
Rui Wang
1and Lu Shi
2*Abstract
Background:In recent years supermarkets and fast food restaurants have been replacing those“wet markets”of independent vendors as the major food sources in urban China. Yet how these food outlets relate to children’s nutritional intake remains largely unexplored.
Method:Using a longitudinal survey of households and communities in China, this study examines the effect of the urban built food environment (density of wet markets, density of supermarkets, and density of fast food restaurants) on children’s nutritional intake (daily caloric intake, daily carbohydrate intake, daily protein intake, and daily fat intake). Children aged 6–18 (n = 185) living in cities were followed from 2004 to 2006, and
difference-in-difference models are used to address the potential issue of omitted variable bias.
Results:Results suggest that the density of wet markets, rather than that of supermarkets, positively predicts children’s four dimensions of nutritional intake. In the caloric intake model and the fat intake model, the positive effect of neighborhood wet market density on children’s nutritional intake is stronger with children from households of lower income.
Conclusion:With their cheaper prices and/or fresher food supply, wet markets are likely to contribute a substantial amount of nutritional intake for children living nearby, especially those in households with lower socioeconomic status. For health officials and urban planners, this study signals a sign of warning as wet markets are disappearing from urban China’s food environment.
Keywords:Food environment, Nutrition, Child, Chinese city
Background
China is now experiencing the world’s fastest growth in
supermarkets (e.g. Carrefour, Wal-Mart and their local clones), with sales at these stores growing by as much as 40 percent annually [1]. Asia’s traditional “wet markets” (also called“open markets”or“free markets”), where in-dependent small vendors in separate stalls sell live ani-mals and fresh produce to customers, increasingly face competition from supermarkets that supply more manu-factured foods with more salt and sugar added [2]. In many Asian countries, the traditional food retail channel of wet markets has shown considerable resilience in its
competition against supermarket chains [3-7]. Yet in the case of the mainland China, local governments seem to favor supermarkets over wet markets [8]. Aside from possible incentives in local fiscal revenue, replacing wet markets with supermarkets might be justified by the sta-ted goal of increasing hygiene standards, as the former was often identified as an important source of emerging infectious diseases [9]. Another changing aspect of
China’s food environment is the expansion of fast food
restaurants supplying Western and Chinese variants of pizza, hamburgers, fried chicken, etc., that tend to pro-vide food and drinks with higher fat and sugar content [10]. The expansion of fast food restaurants could have been helped by increased income, lower opportunity cost of time and lower cost of transporting goods [11]. These * Correspondence:[email protected]
2
UCLA School of Public Health, 61-253 CHS650 Charles E. Young Drive S, Los Angeles, CA 90095, USA
Full list of author information is available at the end of the article
Western fast food restaurants are quickly followed by local food chains that imitate their models [12,13].
The relationship between the food environment and health behaviors and/or outcomes (mainly fast food con-sumption, overweight, etc.) has been documented in recent literature [14-18]. However, for a better understanding of what the above changes in food environment could mean for a developing country, more empirical evidence is needed for at least two reasons. First, the majority of current evidence is based on cross-sectional data and only confirms the correlations between land use patterns (e.g., density, mixture of different land use types, and design of street networks) and health, which might be biased by resi-dential self-selection– people self-select into the commu-nity they choose to live in [19]. Second, almost all of the above-mentioned empirical studies are based upon data from industrialized countries, where eating behavior, health background and the speed of land use change are often very different from those of developing countries. For instance, undesirable food environment in the developed nations are usually linked with overweight among children and adults, yet in many developing nations protein-energy malnutrition remain the dominant public health threat [20]. In addition, cities in emerging economies such as China have been rap-idly growing in the recent past. The spatial and socio-economic structure of Chinese cities has been dramatically changed with on average more than 10 million new urban dwellers added annually during the past two decades.
Interest in China’s built environment and population
health has been developing among academics. For in-stance, Van de Poel et al. [21] find that, in China, an aggre-gated measure of urbanization are associated with average risks of overweight and hypertension, controlling for indi-vidual demographic and socio-economic status. However, for a better understanding of the causal pathways from food access to health outcomes in the context of develop-ing countries, we need to address multiple disaggregated components, including the research gap on food environ-ment and nutritional intake. In this study, we use a longi-tudinal dataset to examine the effect of easy access to fast food restaurants, supermarkets and wet markets on chil-dren’s nutritional intake in Chinese cities. We are inter-ested in whether living in a neighborhood with higher density of food outlets is associated with more carbonhy-drate, fat, protein and total caloric intake among children. Given the popular local policy of replacing wet markets with supermarkets, we are also interested in testing whether the effect of wet market density differs signifi-cantly from that of supermarket density.
Methods Data
This study uses the China Health and Nutrition Survey (CHNS), a multi-wave ongoing longitudinal survey
conducted jointly by the Carolina Population Center
and China’s Ministry of Health. The CHNS dataset
available to us consists of seven waves (1989, 1991, 1993, 1997, 2000, 2004, and 2006). It employs a multistage random cluster sampling process to draw households from urban (and rural) areas in nine
geo-graphically and economically different provinces:
Guangxi, Guizhou, Heilongjiang, Henan, Hubei,
Hunan, Jiangsu, Liaoning, and Shandong. This dataset
provides detailed socio-economic, nutrition, and
health information of households and individuals. In addition, it includes separate community question-naires collecting information (e.g., accessibility) on community built environment or resources, such as transit, recreation facility, public space, school/nursery, hospital, supermarket, wet market, fast food restaurant, etc., at the neighborhood (i.e., the administrative unit of
residential committees, typically called “juweihui” in
Chinese) level. Most built environment variables are only available for the last three waves. A comprehensive review of the CHNS dataset can be found in the description by Popkin et al. [22].
The urban subsample of CHNS includes communi-ties from urban districts of prefecture-level cicommuni-ties and towns that are county seats. A total of 9,543 indivi-duals from 2,473 households and 86 neighborhoods are identified in this multi-wave subsample. In the urban subsample, slightly less than half of the obser-vations (46% of individuals and 49% of neighbor-hoods) are from prefecture-level cities, with the rest from county-level cities. The neighborhoods vary in
size of their areas, with a median of 1.1 km2, a 25
percentile of 0.5 km2, and a 75 percentile of 3 km2.
The population sizes of neighborhoods also vary, with a median of 2,400, a 25 percentile of 1,470, and a 75 percentile of 3,787.
This study uses longitudinal data of school-age
chil-dren (between 6 and 18)a and their households and
neighborhoods from the 2004 and 2006 waves, when neighborhood food environment data are available. To rule out likely outlier or potentially misidentified urban neighborhoods, analyses are restricted to neighborhoods within 100 minutes of bicycling distance from nearest major medical facility (>99% of the full urban household sample), and within 25 km from a park (96% of the full
urban household sample).bThe overall attrition rate of
urban individuals is 17% from 2004 to 2006. Among 997 observed urban children aged between 6 and 18 in the waves of 2004 and 2006, there are 373 aged between 6 and 18 in 2004, among which 303 were followed in 2006, indicating an attrition rate of about 19%. However, the dataset does suffer some loss from missing values. After we dropped observations who ever answered “don’t know”or “refused to answer” in our variable list,
Wang and ShiItalian Journal of Pediatrics2012,38:30 Page 2 of 7
the longitudinal model is left with 185 children. Food consumption data have been collected for three
con-secutive days, and individuals’ food consumption
infor-mation were then used to calculate the nutrient values (total caloric intake, total protein intake, total fat intake and total carbohydrate intake) based on the 2004 Food Composition Table for China [23].
Compared to data used in existing literature, the significant potential and advantage of the CHNS data can be summarized in two aspects. First, it offers lon-gitudinal data, providing a chance for identifying causal effects. As previously mentioned, very few of the existing studies on the relationship between land use/built environment and behavior/health use rando-mized longitudinal datasets. Second, the data offers high quality income information on each individual, representing a significant advance in the measurement of income in China [24]. Questions on income and time allocation probe for any possible activity each person might have engaged in during the previous year, both in and out of the formal market. Informa-tion on state-subsidized housing is gathered from respondents to generate in-kind income, so that full income from market and non-market activities is imputed, and is adjusted by provincial consumer price indexes.
Model and key variables
The focus of this study is to quantify how neighborhood environment affects nutritional intake of Chinese urban
children aged 6–18. The independent effect of a change
in neighborhood environment (treatment, T) on individ-ual i is defined by Yi,t0,T−Yi,t0, which is counterfactual and unobservable. The difference-in-differences (DID) method is employed to estimate individual average treat-ment effects using the two-wave longitudinal data from CNHS.
The DID model can be summarized as ΔYit=ΔXitβ+
ΔZitγ+Δuit, with t = 1, 2, where uit is a time-varying
household/individual error. Yit includes the nutritional
intake variables of the child i at time t. Xit is a vector of observable individual/household characteristics. Zit is a
vector of food environment variables of the household’s
neighborhood, including three variables indicating the neighborhood densities of supermarkets, wet markets, and fast food restaurants, as obtained from the
question-naire items in the CHNS community survey (“how many
supermarkets/wet markets/fast food restaurants are there in your neighborhood?”). As access to vehicular transpor-tation has been shown to be linked with access to vegetable and fruits [25], we include two transportation-related variables in our covariates (Xit) list: whether the neighborhood has any bus stop and whether the house-hold owns a vehicle. In addition, since the choice of wet
markets as a shopping destination is linked with afford-ability [7,26], we interact the household income variable with the neighborhood wet market density to see whether household income affects the association between wet market access and the child’s nutritional intake. The other interaction term in the models is the interaction between being under the age of 12 and the fast food restaur-ant density, to account for the possible difference in fast food consumption between younger children and adolescents.
As a comparison, ordinary least squares (OLS) regressions using the 2004 and 2006 cross-sectional samples are conducted to illustrate how different be-tween focusing on the longitudinal dimension (e.g., the within differences) of the data and running cross-sectional regressions. We add maternal education (in
years) and the child’s gender to the OLS models, as
these are important predictors of the child’s health
behavior that are unlikely to vary between 2004 and 2006 (i.e., the individual fixed effects in DID models account for such time-invariant variables). This helps us identify whether unobserved heterogeneity exists and affects the results. Considering the relatively lim-ited attrition (due to moving, death, etc.) rate, selec-tion bias is assumed to be a minor concern in this analysis.
To better understand the possible difference between
supermarkets and wet markets in terms of children’s
nu-tritional intake, we also test the hypothesis that the number of supermarkets within five kilometers has a dif-ferent effect from that of the number of wet markets within five kilometers. We do not test the difference be-tween the fast food restaurant density and the other two food environment variables since we believe that restau-rants belong to a qualitatively different food outlet category, not directly comparable to wet markets and supermarkets.
Results
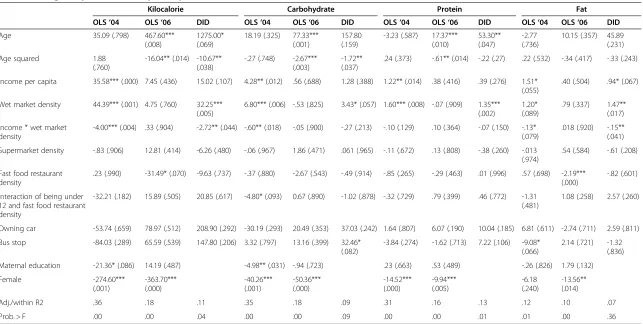
Table 1 provides the descriptive statistics of our lon-gitudinal sample and Table 2 describes the OLS and DID model estimates. After controlling for the effects of individual children and their households, the dens-ity of wet markets is positively associated with all four different measurements of nutrition intake. In the four DID models, one additional wet market within five square kilometers is associated with an in-crease of 31.41 kcal in daily caloric intake (p < 0.01), 3.38 grams of carbohydrate in daily carbohydrate in-take (p < 0.1), 1.339 grams of protein in daily protein intake (p < 0.01), and 1.412 grams of fat in daily fat intake (p < 0.01).
DID models show that every 1,000 Yuan increase in household income per capita reduces the neighborhood
wet market’s effect on caloric intake (by 2.74 kcal per
day, p < 0.1) and on fat intake (by 0.15 gram of fat per day, p < .05), indicating accessibility to wet markets has larger positive caloric/fat intake effect on children from households of lower income. Similar effects are observed for the interaction terms in our protein intake model and carbohydrate intake model, although the effects are not statistically significant there.
On the other hand, even though the number of fast food restaurants within five kilometers of residence is significantly associated with nutritional intake in all four OLS models, neither the number of fast food restaurants nor the number of supermarkets significant predict nu-tritional intake in any of the four DID models. This may indicate that the association between fast food restau-rants and nutritional intake in the OLS models could be due to omitted variable biases.
F-tests conducted after the DID models show that the effect of supermarket density is significantly different from that of wet market density in our total caloric in-take model (F = 5.05, p = 0.025), protein inin-take model (F = 7.87, p = 0.005), and fat intake model (F = 5.23, p = 0.023), but not in carbohydrate model (F = 1.72, p = 0.19).
As for the transportation covariates, having bus stops in the neighborhood is positively associated with carbo-hydrate intake (p < 0.05) and protein intake (p < 0.05),
whereas the household’s car ownership does not
signifi-cantly predict any of our dependent variables in Table 2.
In our OLS models, being female significantly predicts less nutritional intake, for all four measures in 2004 and 2006, with the only exception that in 2004 this effect is statistically insignificant for the OLS fat intake model (p = 0.24). In 2004 more maternal education is associated with less total caloric intake with a p value of 0.084 and less carbonhydrate intake with a p value of 0.031, but this pattern is not seen in the other two 2004 OLS mod-els, nor is it seen in any of the four 2006 OLS models.
Discussion
Unlike most of the earlier studies, our DID model addresses the“residential self-selection bias”and demon-strated an independent association between neighbor-hood food environment and specific nutritional intake among children. The government-led conversion of wet markets into supermarkets has been carried out in Chinese cities since the early 2000s since these wet mar-kets are often considered as unclean for urban environ-ment and inefficient in generating circulation tax revenue. As our study shows, however, the density of wet markets is the only one of the three food environ-ment variables that positively predict protein intake, which serves a vital nutrient for the younger population’s physical development and even cognitive function [27]. For health officials and urban planners, this should sig-nal a sign of warning as wet markets are disappearing
from Urban China’s food environment (in many cases as a
result of local governments’attempt to replace them with supermarkets). When new food outlets like fast food res-taurants have been shown to be linked with undesirable
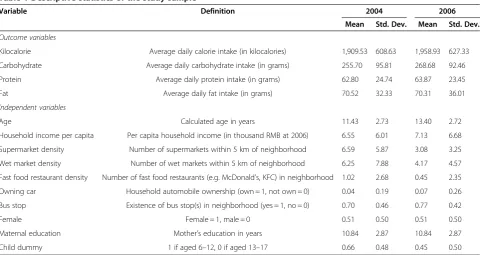
Table 1 Descriptive statistics of the study sample
Variable Definition 2004 2006
Mean Std. Dev. Mean Std. Dev.
Outcome variables
Kilocalorie Average daily calorie intake (in kilocalories) 1,909.53 608.63 1,958.93 627.33
Carbohydrate Average daily carbohydrate intake (in grams) 255.70 95.81 268.68 92.46
Protein Average daily protein intake (in grams) 62.80 24.74 63.87 23.45
Fat Average daily fat intake (in grams) 70.52 32.33 70.31 36.01
Independent variables
Age Calculated age in years 11.43 2.73 13.40 2.72
Household income per capita Per capita household income (in thousand RMB at 2006) 6.55 6.01 7.13 6.68
Supermarket density Number of supermarkets within 5 km of neighborhood 6.59 5.87 3.08 3.25
Wet market density Number of wet markets within 5 km of neighborhood 6.25 7.88 4.17 4.57
Fast food restaurant density Number of fast food restaurants (e.g. McDonald’s, KFC) in neighborhood 1.02 2.68 0.45 2.35
Owning car Household automobile ownership (own = 1, not own = 0) 0.04 0.19 0.07 0.26
Bus stop Existence of bus stop(s) in neighborhood (yes = 1, no = 0) 0.70 0.46 0.77 0.42
Female Female = 1, male = 0 0.51 0.50 0.51 0.50
Maternal education Mother’s education in years 10.84 2.87 10.84 2.87
Child dummy 1 if aged 6–12, 0 if aged 13–17 0.66 0.48 0.45 0.50
Wang and ShiItalian Journal of Pediatrics2012,38:30 Page 4 of 7
Table 2 Average daily caloric, carbohydrate, protein, and fat intakes of children
Kilocalorie Carbohydrate Protein Fat
OLS‘04 OLS‘06 DID OLS‘04 OLS‘06 DID OLS‘04 OLS‘06 DID OLS‘04 OLS‘06 DID
Age 35.09 (.798) 467.60*** (.008)
1275.00* (.069)
18.19 (.325) 77.33*** (.001)
157.80 (.159)
-3.23 (.587) 17.37*** (.010)
53.30** (.047)
-2.77 (.736)
10.15 (.357) 45.89 (.231) Age squared 1.88
(.760)
-16.04** (.014) -10.67** (.038)
-.27 (.748) -2.67*** (.003)
-1.72** (.037)
.24 (.373) -.61** (.014) -.22 (.27) .22 (.532) -.34 (.417) -.33 (.243)
Income per capita 35.58*** (.000) 7.45 (.436) 15.02 (.107) 4.28** (.012) .56 (.688) 1.28 (.388) 1.22** (.014) .38 (.416) .39 (.276) 1.51* (.055)
.40 (.504) .94* (.067)
Wet market density 44.39*** (.001) 4.75 (.760) 32.25*** (.005)
6.80*** (.006) -.53 (.825) 3.43* (.057) 1.60*** (.008) -.07 (.909) 1.35*** (.002)
1.20* (.089)
.79 (.337) 1.47** (.017) Income * wet market
density
-4.00*** (.004) .33 (.904) -2.72** (.044) -.60** (.018) -.05 (.900) -.27 (.213) -.10 (.129) .10 (.364) -.07 (.150) -.13* (.079)
.018 (.920) -.15** (.041) Supermarket density -.83 (.906) 12.81 (.414) -6.26 (.480) -.06 (.967) 1.86 (.471) .061 (.965) -.11 (.672) .13 (.808) -.38 (.260) -.013
(.974)
.54 (.584) -.61 (.208)
Fast food restaurant density
.23 (.990) -31.49* (.070) -9.63 (.737) -.37 (.880) -2.67 (.543) -.49 (.914) -.85 (.265) -.29 (.463) .01 (.996) .57 (.698) -2.19*** (.000)
-.82 (.601)
Interaction of being under 12 and fast food restaurant density
-32.21 (.182) 15.89 (.505) 20.85 (.617) -4.80* (.093) 0.67 (.890) -1.02 (.878) -.32 (.729) .79 (.399) .46 (.772) -1.31 (.481)
1.08 (.258) 2.57 (.260)
Owning car -53.74 (.659) 78.97 (.512) 208.90 (.292) -30.19 (.293) 20.49 (.353) 37.03 (.242) 1.64 (.807) 6.07 (.190) 10.04 (.185) 6.81 (.611) -2.74 (.711) 2.59 (.811) Bus stop -84.03 (.289) 65.59 (.539) 147.80 (.206) 3.32 (.797) 13.16 (.399) 32.46*
(.082)
-3.84 (.274) -1.62 (.713) 7.22 (.106) -9.08* (.066)
2.14 (.721) -1.32 (.836) Maternal education -21.36* (.086) 14.19 (.487) -4.98** (.031) -.94 (.723) .23 (.663) .53 (.489) -.26 (.826) 1.79 (.132) Female -274.60***
(.001)
-363.70*** (.000)
-40.26*** (.001)
-50.36*** (.000)
-14.52*** (.000)
-9.94*** (.005)
-6.18 (.240)
-13.56** (.014)
Adj./within R2 .36 .18 .11 .35 .18 .09 .31 .16 .13 .12 .10 .07
Prob. > F .00 .00 .04 .00 .00 .09 .00 .00 .01 .01 .00 .36
Note: N = 185 for OLS regressions; N = 370 for DID regressions; *p < .10, **p < .05, ***p < .01; p-values included in parentheses; robust standard errors are used in OLS regressions.
Shi
Italian
Journal
of
Pediatrics
2012,
38
:30
Page
5
o
f
7
t/content/38/
health outcomes in the population [28], it might be a risky approach to displace the traditional affordable food sources like wet markets. As for the hygiene risks asso-ciated with the live poultry in wet markets, measures like separating animals in different stalls and booths, discour-aging the transaction of wild-caught animals and the first use of pandemic vaccines in farms that supply animals to wet markets can be expected to reduce the infectious disease risk. Meanwhile, the significant association we found between wet market density and the other three nutritional intake measures (fat, total calories and
carbon-hydrate), at a time when China’s childhood obesity
increases fast, implies that parents and teachers might want to know better what food children are getting from wet markets.
Some results from our difference-in-difference model also help explain the documented association between living in households of higher socio- economic status and higher body-mass-index among Chinese children: for instance, higher household income per capita signifi-cantly predicts more fat intake in our DID fat model. Having a bus stop in the neighborhood is also associated with more nutrient intake of carbonhydrate, and having
a bus nearby is often a measure of the community’s
de-gree of urbanization. Thus, we might infer that the sig-nificant coefficient of“bus stop in the neighborhood” in our carbonhydrate DID model could reflect the extra carbonhydrate intake among children who live in more urbanized and developed parts of Urban China, another factor that could have contributed to the higher BMI among richer children.
On the other hand, as we observe that the interaction term between household income per capita and wet market density is negatively associated with caloric in-take and fat inin-take, we should also beware that accessi-bility to wet market foods could have a stronger effect on the caloric/fat intake among children from lower-income families, perhaps from their relatively lower prices. This is consistent with previous literature that in-come effect on potentially detrimental diet is stronger with poor households in China [29]. Thus, even though China is still at the stage when high household income positively predicts high caloric/fat intake (as confirmed by our DID models) and high body mass index [30], cer-tain segments of low-income population could also be at risk for excessive caloric/fat intake as well, because their children’s caloric/fat intake may be more sensitive to in-come growth.
There are, of course, limitations in this study. Local food environment is measured by the relatively loose
spatial unit of “neighborhood” instead of strict area
density. Limited waves of built-environment measures and missing variable values constrain the sample size. Possibly self-selected attrition of the sampled children
could also have biased the results to some extent. In addition, we measured the density of food outlets by the number of outlets in the community without paying at-tention to the actual size of each type of food outlets, which might have missed some important information about the child’s actual access to foods. For instance, we notice from Table 1 that the number of supermarkets in the neighborhood declined from 2004 to 2006 at a time
when overall supermarkets’ market share increased
among all food outlets, which might be a result of
China’s ongoing trend of supermarket consolidation [8]
but we do not know whether the actual supermarket size increased since 2004. Similarly, we do not know what contributed to the observed decline of fast food restaur-ant density as revealed by Table 1, though we suspect that a growth in the average revenue per restaurant coupled with industry-wide consolidation could explain this decline during the fast food industry’s boom. Future studies would benefit from a larger size of longitudinal sample, better measures of the food environment, and a more complete control of covariates including food price. In addition, studies like this one should be com-bined with studies on the relationship between nutri-tional intake and health outcomes to help us better understand the welfare implications of policies on food environment.
Endnotes a
Children of school age and those younger may have substantially different daily activity, nutritional demand, and food intake pattern. We select the age range be-tween 6 and 18 so that the behavioral pattern of children in our sample is relatively homogeneous.
b
We did so by examining the data distribution. A very small number of observations are located in places far away from major medical facility or a park. We consider them as not located in typical urban environment
Competing interests
The authors certify that there is no conflict of interest to the best of their knowledge.
Authors’contributions
RW started the study and designed the analysis framework. LS
conceptualized the research questions and hypotheses. Both authors read and approved the final manuscript.
Acknowledgement
The authors thank the Peking University–Lincoln Institute Center for Urban Development and Land Policy for funding this study.
Author details
1
UCLA Luskin School of Public Affairs, 3250 Public Affairs Building, Box 951656, Los Angeles, CA 90095, USA.2UCLA School of Public Health, 61-253 CHS650 Charles E. Young Drive S, Los Angeles, CA 90095, USA.
Received: 11 December 2011 Accepted: 15 June 2012 Published: 30 June 2012
Wang and ShiItalian Journal of Pediatrics2012,38:30 Page 6 of 7
References
1. Hu D, Reardon T, Rozelle S, Timmer P, Wang H:The emergence of supermarkets with Chinese characteristics: challenges and
opportunities for China's agricultural development.Dev Policy Rev2004,
22:557–86.
2. Reardon T, Timmer P, Berdegue J:The rapid rise of supermarkets in developing countries: induced organizational, institutional, and technological change in agrifood systems.J Agric Dev Econ2004,1:168–83. 3. Goldman A:Supermarkets in China: entry limitations and strategic
dilemmas.MKTG 96.080, China Europe International Business School1996,
96.080:1–3.
4. Goldman A, Krider R, Ramaswami S:The persistent competitive advantage of traditional food retailers in Asia: wet markets’continued dominance in Hong Kong.J Macromark1999,19(2):126–139.
5. Goldman A:Supermarkets in China: the case of Shanghai.Int Rev Retail Distrib Consum Res2000,10(1):1–21.
6. Goldman A, Ramaswami S, Krider RE:Barriers to the advancement of modern food retail formats: theory and measurement.J Retail2002,
78(4):281–295.
7. Zhang X:The dynamics of Chinese consumers.Journal of International Food & Agribusiness Marketing2003,14:47–66.
8. He J:A comparison of“converting free markets into supermarkets” across large and middle-sized cities(大中城市“农改超”模式比较). Business Time2006,31:11–12.
9. Yu H, Feng Z, Zhang X, Xiang N, Huai Y, Zhou L, Li Z, Xu C, Luo H, He J, Guan X, Yuan Z, Li Y, Xu L, Hong R, Liu X, Zhou X, Yin W, Zhang S, Shu Y, Wang M, Wang Y, Lee C-K, Uyeki TM, Yang W:Human influenza A (H5N1) cases, urban areas of People’s Republic of China, 2005–2006.Emerg Infect Dis2007,13(7):1061–1064.
10. Bowman SA, Gortmaker SL, Ebbeling CB, Pereira MA, Ludwig DS:Effects of fast-food consumption on energy intake and diet quality among children in a National Household Survey.Pediatrics2004,113:112–118. 11. Reardon T, Timmer CP, Barrett CB, Berdegué J:The rise of supermarkets
in Africa, Asia, and Latin America.Am J Agric Econ2003,
85(5):1140–1146.
12. Wang Y, Monteiro C, Popkin BM:Trends of obesity and underweight in older children and adolescents in the United States, Brazil, China, and Russia.Am J Clin Nutr2002,75(6):971–977.
13. Lobstein T, Baur L, Uauy R:Obesity in children and young people: a crisis in public health.Obes Rev2004,5(Suppl 1):4–104.
14. Eid J, Overman HG, Puga D,et al:Fat city: questioning the relationship between urban sprawl and obesity.J Urban Econ2008,
63:385–404.
15. Jeffery R, Baxter J, McGuire M, Linde J:Are fast food restaurants an environmental risk factor for obesity?Int J Behav Nutr Phys Act2003,3(1):2. 16. Papas MA, Alberg AJ, Ewing R, Helzlsouer KJ, Gary TL, Klassen AC:The built
environment and obesity.Epidemiol Rev2007,29:129–43. 17. Raja S, Yin L, Roemmich J, Ma C, Epstein L, Yadav P, Ticoalu A:Food
environment, built environment, and women’s BMI: evidence from Erie County, New York.J Plan Educ Res2010,29:444–460.
18. Pearce J, Witten K, Bartie P:Neighbourhoods and health: a GIS approach to measuring community resource accessibility.J Epidemiol Community Health2006,60:389–95.
19. Mokhtarian PL, Cao X:Examining the impacts of residential selection on travel behavior: a focus on methodologies.Trans Research Part B2008,
42:204–28.
20. Muller O, Krawinkel M:Malnutrition and health in developing countries. CMAJ2005,173:279–286.
21. Van de Poel E, O’Donnell O, Van Doorslaer E:Urbanization and the spread of diseases of affluence in China.Econ Hum Biol2009,7(2):200–216. 22. Popkin BM:Will China’s nutrition transition overwhelm its health care
system and slow economic growth?Heal Aff2008,27(4):1064–1076. 23. Benjamin D, Brandt L, Giles J, Wang S:Income inequality during China’s
economic transition. InChina’s great economic transformation. Edited by Yang Y. Brandt, Loren and Rawski. New York: Cambridge University Press; 2008. 24. Popkin BM, Du S, Zhai F, Zhang B:Cohort profile: the China Health and
Nutrition Survey–monitoring and understanding socio-economic and health change in China, 1989–2011.Int J Epidemiol2010,
39(6):1435–1440.
25. Sharkey JR, Horel S, Dean WR:Neighborhood deprivation, vehicle ownership, and potential spatial access to a variety of fruits and vegetables in a large rural area in Texas.Int J Health Geogr2010,9:26. 26. Consumer Council:Where to shop for food- supermarkets or wet
markets?Choice2002,April:30–34.
27. Jakobsen LH, Kondrup J, Zellner M, Tetens I, Roth E:Effect of a high protein meat diet on muscle and cognitive functions: a randomised controlled dietary intervention trial in healthy men.Clin Nutr2011,
30(3):303–311.
28. Pereira MA, Kartashov AI, Ebbeling CB,et al:Fast-food habits, weight gain, and insulin resistance (the CARDIA study): 15-year prospective analysis. Lancet.2005,365(9453):36–42.
29. Du S, Mroz TA, Zhai F, Popkin BM:Rapid income growth adversely affects diet quality in China–particularly for the poor!Soc Sci Med2004,
59(7):1505–1515.
30. Xu F, Yin X, Zhang M, Leslie E, Ware R, Owen N:Family average income and body mass index above the healthy weight range among urban and rural residents in regional Mainland China.Public Health Nutr2005,
8(1):47–51.
doi:10.1186/1824-7288-38-30
Cite this article as:Wang and Shi:Access to food outlets and children’s
nutritional intake in urban China: a difference-in-difference analysis. Italian Journal of Pediatrics201238:30.
Submit your next manuscript to BioMed Central and take full advantage of:
• Convenient online submission
• Thorough peer review
• No space constraints or color figure charges
• Immediate publication on acceptance
• Inclusion in PubMed, CAS, Scopus and Google Scholar
• Research which is freely available for redistribution