ECE 320
Energy Conversion and Power Electronics
Dr. Tim Hogan
Chapter 8: Power Electronics
(Textbook Chapter 10, and Sections 11.2, 11.3, and reserve book: Power Electronics)
Chapter Objectives
As we saw in the last chapter, control over the torque and speed of the motor can be gained through voltage and frequency control to the motor. This can be accomplished by converting the input AC source power to a DC source (rectifying it), then filtering it to reduce harmonics, and finally converting it back to an AC source having the desired frequency and amplitude (inverter).
8.1 Line Controlled Rectifiers
We start with a description of how to draw power from a 1-phase or 3-phase system to provide DC to a load. The characteristics of the systems here include that the devices used will turn themselves off (commutate) and that the systems draw reactive power from the loads.
8.1.1 One-Phase and Three-Phase Circuits with Diodes
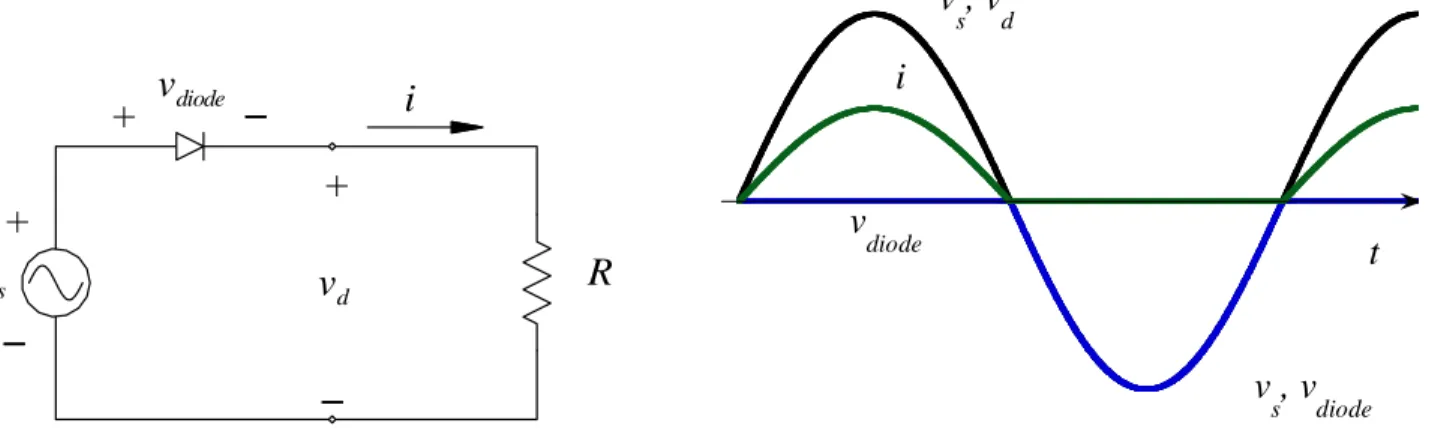
If the source is 1-phase, a diode is used and the load is purely resistive, as shown in Figure 1 then it is a relatively simple configuration. When the source voltage is positive, the current flows through the diode and the voltage of the source equals the voltage of the load.
R vd + i vs + vdiode + i v s, vd v s, vdiode v diode t
Figure 1. Simple circuit with diode and resistive load.
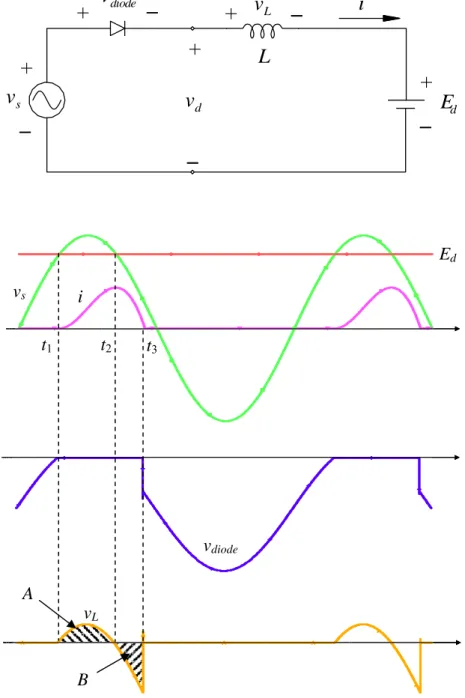
If the load includes an inductance and a source (such as a battery we wish to charge), as in Figure 2, then the diode will continue to conduct even when the load voltage becomes negative as long as the current is maintained. This comes from the characteristics of the inductor:
( ) ( )
0 0 1 3 0 3 = − =∫
v dt i t i L t L (8.1)Thus, the shaded area A in Figure 2 must equal the shaded area B.
v
d+
i
v
s+
v
diode+
L
+
v
LE
d+
0 0 0 0 0 0 0 0 0 0 0 s 5 m s 1 0 m s 1 5 m s 2 0 m s 2 5 m s 0 V 0 V 0 V 0 s 5 m s 1 0 m s 1 5 m s 2 0 m s 2 5 m s 0 V 0 V 0 V 0 V 0 V 0 V 0 V 0 V 0 V i Ed t vdiode t t vL t1 t2 t3 vs A BFigure 2. Simple circuit with diode and inductive load with voltage source.
8.1.2 One-Phase Full Wave Rectifier
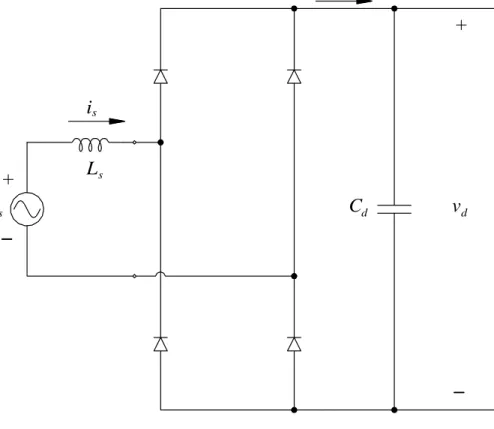
More common is a single phase diode bridge rectifier such as shown in Figure 3. The load can be modeled with one of two extremes: either as a constant current source, representing the case of a large
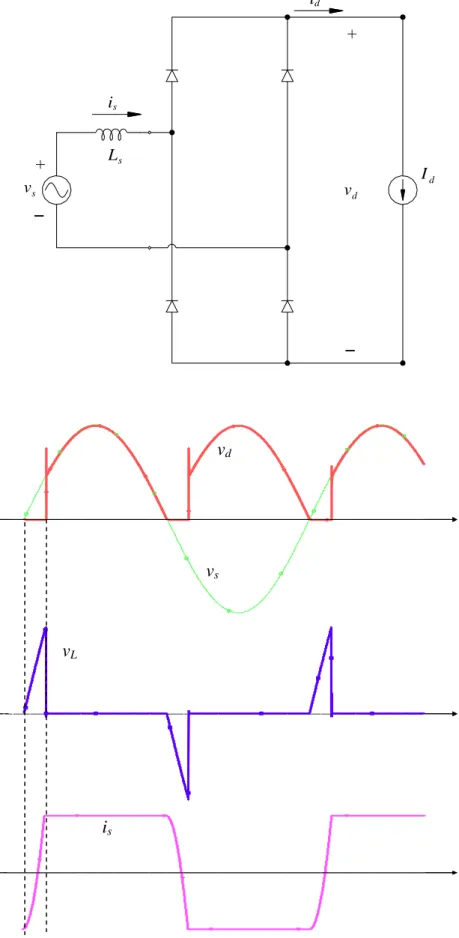
inductance that keeps the current through it almost constant, or as a resistor, representing the case of minimum line inductance. We will study the first case with AC and DC side current and voltage
waveforms shown in Figure 4 for the ideal case of Ls = 0.
vs + L + vd Cd i s s id
Figure 3. One-phase full wave rectifier.
0 5 1 0 1 5 2 0 2 5 0 0 0 0 5 1 0 1 5 2 0 2 5 0 0 0 vs is Id t 0 0 0 0 0 0 vd id = Id t
If we analyze these waveforms, the output voltage will have a DC component, Vdo (where the
subscript o represents that this is the ideal case with Ls = 0):
s s
do V V
V = 2 2 ≈0.9
π (8.2)
where Vs is the RMS value of the input AC voltage. On the other hand the RMS value of the output
voltage will be
d s V
V = (8.3)
containing components of higher frequency.
Similarly on the AC side the current is not sinusoidal, rather it changes abruptly between Id and –Id.
d d
s I I
I 1= 2 2 ≈0.9
π (8.4)
and again, the RMS values are the same
s d I
I = (8.5)
The total harmonic distortion, THD, can then be found as: % 43 . 48 1 2 1 2 ≈ − = s s s I I I THD (8.6)
It is important to note here that if the source has some inductance (and it usually does), then
commutation will be delayed after the voltage reaches zero, until the current has dropped to zero as shown in Figure 5. This will lead to a decrease of the output DC voltage below what is expected from (8.2)
vs + L + vd i s s id Id 1 6 2 0 2 4 2 8 3 2 3 6 4 0 0 V 0 V 0 V 1 6 2 0 2 4 2 8 3 2 3 6 4 0 0 V 0 V 0 V vd t 0 V 0 V 0 V 0 V 0 V 0 V A A vs vL t is t
8.1.3 Three-Phase Full Diode Rectifiers
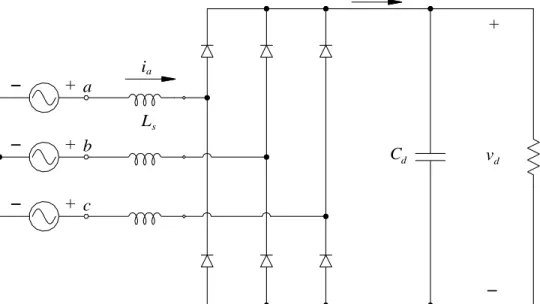
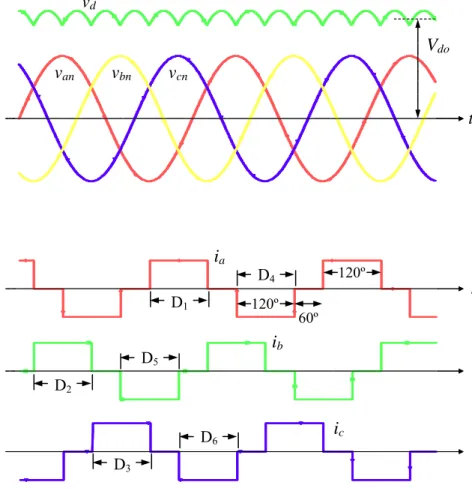
The circuit of Figure 3 can be modified to handle three phases, by using 6 diodes as shown in Figure 6. Figure 7 shows the AC side currents and DC side voltage for the case of high load inductance. Similar analysis as before shows that on the DC side, the voltage is:
l l l l do V V V = 3 2 − =1.35 − π (8.7)
From Figure 6, we see that on the AC side, the RMS current, Is is:
d d s I I I 0.816 3 2 = = (8.8)
while the fundamental current, i.e. the current at power frequency is:
d d
s I I
I 1= 1 6 =0.78
π (8.9)
Again, inductance on the AC side will delay commutation, causing a voltage loss, i.e. the DC voltage will be less than that predicted by equation (8.7).
a + L i s a id R + vd Cd b + c + n
0 s 1 0 m s 2 0 m s 3 0 m s 4 0 m s 0 V 0 V 0 V 0 s 1 0 m s 2 0 m s 3 0 m s 4 0 m s 0 V 0 V 0 V 0 s 1 0 m s 2 0 m s 3 0 m s 4 0 m s 0 V 0 V 0 V vd Vdo van vbn vcn t 0 A 0 A A A ia D1 D4 120º 120º t 60º ib 0 A 0 A D2 D5 t ic D3 D6 t
Figure 7. Waveforms of a three-phase full-wave rectifier with diodes and inductive load.
8.1.4 Controlled Rectifiers with Tyristors
Thyristors give us the ability to vary the DC voltage. Remember that to make a thyristor start conducting, the thyristor must be forward biased and a gate pulse provided to its gate. Also, to turn off the thyristor
the current through it must reverse direction for a short period of time, trr, and return to zero.
8.1.5 One-Phase Controlled Rectifiers
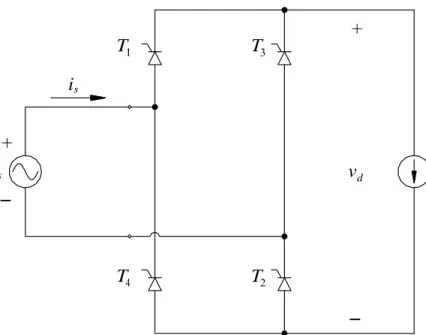
Fig. shows the same 1-phase bridge we have already studied, now with thyristors instead of diodes, and
fig shows the output voltage and input current waveforms. In this figure α is the delay angle,
vs + + vd is Id T1 T3 T4 T2
Figure 8. One-phase full wave converter with thyristors.
Thyristors 1 and 2 are triggered together and of course so are 3 and 4. Each pair of thyristors is turned off immediately (or shortly) after the other pair is turned on by gating. Analysis similar to that for diode circuits will give:
( )
α( )
α π 2 cos 0.9 cos 2 s s do V V V = = (8.10)and the relation for the currents is the same
( )
α( )
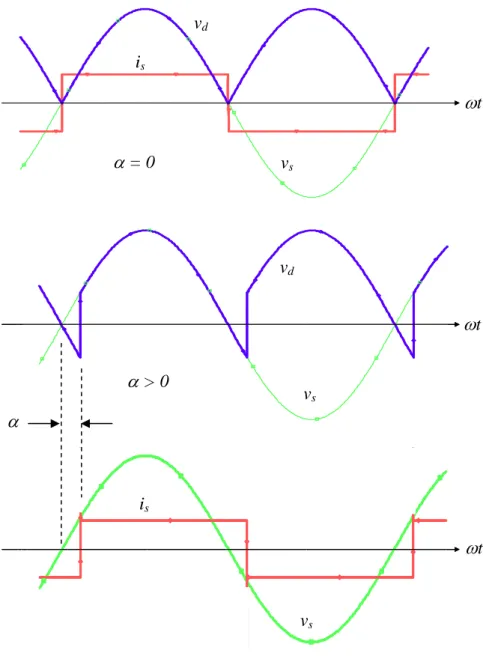
α π 2 cos 0.9 cos 2 1 d d s I I I = = (8.11)It should also be pointed out that in Figure 9 the current waveform on the AC side is offset in time with
respect to the corresponding voltage by the same angle α, hence so is the fundamental of the current,
vd is ωt α = 0 vs 1 6 2 0 2 4 2 8 3 2 1 4 3 5 0 0 V 0 V 0 0 V 1 6 2 0 2 4 2 8 3 2 1 4 3 5 0 0 V 0 V 0 0 V vd ωt -100 0 100 -100 0 100 α > 0 vs α is ωt vs
Figure 9. Waveforms of one-phase full wave converter with thyristors.
On the DC side, only the DC component of the voltage carries power, since there is no harmonic content in the current. On the AC side the power is carried only by the fundamental, since there are no harmonics in the voltage.
( )
d d s sI V I V P= 1cosα = (8.12) 8.1.5.1 Inverter ModeIf the current on the DC side is sustained even if the voltage reverses polarity, then power will be transferred from the DC to the AC side. The voltage on the DC side can reverse polarity when the delay angle exceeds 90º, as long as the current is maintained. This can only happen when the load voltage is as shown in Figure 10, e.g. a battery.
vs + + vd is T1 T3 T4 T2 L Ed + id
Figure 10. Operation of a one-phase controlled converter as an inverter.
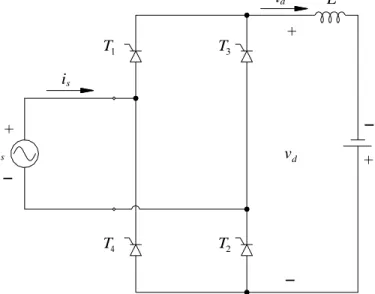
8.1.6 Three-Phase Controlled Converters
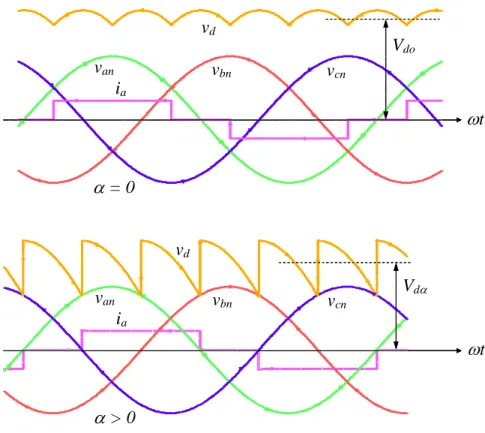
As with diodes, only 6 thyristors are needed to accommodate three phases. Figure 11 shows the schematic of the system, and Figure 12 shows the output voltage waveforms.
a + ia id b + c + n + vd Id ia ia T1 T3 T5 T2 T6 T4
1 5 m s 2 0 m s 2 5 m s 3 0 m s 3 5 m s 0 0 0 0 0 1 5 m s 2 0 m s 2 5 m s 3 0 m s 3 5 m s 0 0 0 0 0 1 5 m s 2 0 m s 2 5 m s 3 0 m s 3 5 m s 0 0 0 0 0 vd Vdo van vbn vcn ia ωt α = 0 1 6 m s 2 0 m s 2 4 m s 2 8 m s 3 2 m s 1 6 m s 2 0 m s 2 4 m s 2 8 m s 3 2 m s s 1 6 m s1 6 m s 2 0 m s2 0 m s 2 4 m s2 4 m s 2 8 m s2 8 m s 3 2 m s3 2 m s s 1 6 m s1 6 m s1 6 m s 2 0 m s2 0 m s2 0 m s 2 4 m s2 4 m s2 4 m s 2 8 m s2 8 m s2 8 m s 3 2 m s3 2 m s3 2 m s s vd Vdα van vbn vcn ia ωt α > 0
Figure 12. Waveforms of a three-phase full-wave converter based on thyristors.
The delay angle α is again measured from the point that a thyristor becomes forward biased, but in this
case the point is at the intersection of the voltage waveforms of two different phases. The voltage on the
DC side is then (the subscript o here again meaning Ls = 0):
( )
α( )
α π 2 cos 1.35 cos 3 l l l l do V V V = − = − (8.13)while the power for both the AC and DC side is
( )
α 3 cos( )
α cos 35 . 1 l l d l l s1 d doI V I V I V P= = − = ⋅ − ⋅ (8.14)which leads to:
d
s I
I 1 =0.78 (8.15)
and the relationship between Vdo and Vdα in Figure 12 is:
( )
αα docos d V
V = (8.16)
Again, if the delay angle α is extended beyond 90º, the converter transfers power from the DC side to
the AC side, becoming an inverter. We should keep in mind, though that even in this case the converter is drawing reactive power from the AC side.
8.1.7 Notes
• For both 1-phase and 3-phase controlled rectifiers, a delay in α creates a phase displacement of the
phase current with respect to the phase voltage, equal to α. The cosine of this angle is the power
factor of the fundamental harmonic.
• For both motor and generator modes the controlled rectifier absorbs reactive power from the
three-phase AC system, although it can either absorb or produce real power. It also needs the power line to commutate the thyristors. This means that inverter operation is possible only with the rectifier is connected to a power line.
• When a DC motor or a battery is connected to the terminals of a controlled rectifier and α becomes
greater than 90º, the terminal DC voltage changes polarity, but the direction of the current stays the same. This means that in order for the rectifier to draw power from the battery or a motor that operates as a generator turning in the same direction, the terminals have to be switched. 8.2 Inverters
Here we study systems that can convert DC to AC through the use of devices that can be turned on and off such as GTOs, BJTs, IGBTs, and MOSFETs, which allows the transfer of power from the DC source to any AC load, and gives considerable control over the resulting AC signal. The general block diagram of the complete system is shown in Figure 13.
Rectifier AC Motor 60 (Hz) AC Filter Capacitor Switch-mode inverter + Vd _
Figure 13. Typical variable voltage and variable frequency system.
8.2.1 One-Phase Inverter
Figure 14 shows the operation of one leg of an inverter regardless of the number of phases. To illustrate the point better, the input DC voltage is divided into two equal parts. When the upper switch,
S1, is closed while S2 is open, the output voltage VAo will be +Vd 2 , and when the lower switch, S2, is
closed while S1 is open, the output voltage will be −Vd 2
vAo + vAN + S1 S2 Vd + Vd 2 Vd 2
To control the output waveform the switches can be controlled by pulsed width modulation, PWM, where the time each switch is closed can be determined by the difference between a control waveform, and a carrier (or triangular) waveform as shown in Figure 15. When the control wave is greater than the triangular wave, S1 is closed, and S2 is open. When the control wave is less than the triangular wave, S1 is open, and S2 is closed. In this way, the width of the output is modulated (hence the name).
T im e 16 m s 1 8 ms 2 0 m s 2 2m s 2 4 m s 26 m s 2 8 ms 3 0 m s 3 2m s 34 m s V 1 (V t r i ) V 1( V c o nt ) - 1 . 0 V - 0 . 5 V 0 . 0 V 0 . 5 V 1 . 0 V
Figure 15. Control (red sinewave) and carrier or triangular waveform (green) determine when the switches are closed. For the times when the control wave is greater than the triangular wave, S1 is closed, and S2 is open. When the control wave is less than the triangular wave, S1 is open, and S2 is closed. Time 16ms 18ms 20ms 22ms 24ms 26ms 28ms 30ms 32ms 34ms V (3)- V(2) -60V -40V -20V -0V 20V 40V 60V
The frequency of the triangular wave is fc, and the frequency of the control wave is fo. We define the
ratio of these as the frequency modulation index, mf.
o c f f f m = (8.17)
Likewise, the amplitude modulation index, ma, is defined as the ratio of the control voltage to the
triangular wave voltage.
triangular control
V V
ma = (8.18)
A one phase, bull wave inverter is shown in Figure 17. It has four controlled switches, each with an antiparallel diode. S1 S2 S4 S3
A
o Vd + Vd 2 Vd 2 B v =AB v -Ao vBo +Figure 17. One-phase full wave inverter.
The diagonal switches operate together such that S1 and S3 open and close together, and S2 and S4
open and close together. The output will oscillate between +Vd2 and
2
d V
− . If the Fourier
transformation of the pulse width modulated square wave shown in Figure 18 is taken, the amplitude of
the fundamental will be a linear function of the amplitude index Vo = maVd/2 as long as ma≤ 1. Then the
RMS value of the output voltage will be:
d a d a o m V V m V 0.353 2 2 1= = (8.19)
T i m e 1 6 m s 1 8 m s 2 0 m s 2 2 m s 2 4 m s 2 6 m s 2 8 m s 3 0 m s 3 2 m s 3 4 m s V ( 2 ) - V ( 3 ) - 1 2 0 V - 8 0 V - 4 0 V - 0 V 4 0 V 8 0 V 1 2 0 V
Figure 18. Output voltage VAB for the one-phase, full wave inverter of Figure 17.
When ma increases beyond 1, the output voltage increases also, but not linearly with ma. The output
amplitude can reach a peak value of Vd
π
4
when the reference signal becomes infinite and the output is a square wave. Under this condition, the RMS value is:
d d o V V V 0.45 2 2 2 1= π = (8.20)
Equating the power of the DC side with that of the AC side gives
pf I V I V P= d do = o1 o1⋅ (8.21)
Thus for normal operation:
pf I m
Ido =0.353 a o1⋅ (8.22)
and in the limit for a square wave:
pf I
8.2.2 Three-Phase Inverter
For three-phase loads it makes more sense to use a three-phase inverter shown in Fig., rather than using three one-phase inverters.
d V +
S1
S4
S3
S6
A
C
S2
S5
B
Figure 19. Three-phase, full wave inverter.
The basic PWM scheme for a three-phase inverter has one common carrier and three separate control
waveforms. If the waveforms we want to achieve are sinusoidal the frequency modulation index, mf, is
low we use a synchronized carrier signal with mf an integer multiple of 3.
T i m e 1 6 m s 1 7 m s 1 8 m s 1 9 m s 2 0 m s 2 1 m s 2 2 m s 2 3 m s 2 4 m s V 1 ( V c o n t 1 ) V 1 ( V c o n t 2 ) V 1 ( V c o n t 3 ) V 1 ( V t r i ) - 1 . 0 V - 0 . 5 V 0 . 0 V 0 . 5 V 1 . 0 V (a)
T i m e 1 6 m s 1 7 m s 1 8 m s 1 9 m s 2 0 m s 2 1 m s 2 2 m s 2 3 m s 2 4 m s V ( 2 ) 0 V 4 0 V 8 0 V 1 1 0 V (b) T i m e 1 6 m s 1 7 m s 1 8 m s 1 9 m s 2 0 m s 2 1 m s 2 2 m s 2 3 m s 2 4 m s V ( 3 ) 0 V 4 0 V 8 0 V 1 1 0 V (c) T i m e 1 6 m s 1 7 m s 1 8 m s 1 9 m s 2 0 m s 2 1 m s 2 2 m s 2 3 m s 2 4 m s V ( 2 ) - V ( 3 ) - 1 2 0 V - 8 0 V - 4 0 V - 0 V 4 0 V 8 0 V 1 2 0 V (d)
Figure 20. Three-phase, full wave inverter showing (a) control and triangular wave, (b) phase A line-to-neutral, (c) phase B line-to-line-to-neutral, and (d) line-to-line signal from phase A to B.
T i m e 1 7 . 0 0 m s 1 7 . 0 4 m s 1 7 . 0 8 m s 1 7 . 1 2 m s 1 7 . 1 6 m s 1 7 . 2 0 m s 1 7 . 2 4 m s 1 7 . 2 8 m s 1 7 . 3 2 m s 1 7 . 3 6 m s 1 7 . 4 0 m s V ( 2 ) 0 V 4 0 V 8 0 V 1 1 0 V (a) T i m e 1 7 . 0 0 m s 1 7 . 0 4 m s 1 7 . 0 8 m s 1 7 . 1 2 m s 1 7 . 1 6 m s 1 7 . 2 0 m s 1 7 . 2 4 m s 1 7 . 2 8 m s 1 7 . 3 2 m s 1 7 . 3 6 m s 1 7 . 4 0 m s V ( 3 ) 0 V 4 0 V 8 0 V 1 1 0 V (b) T i m e 1 7 . 0 0 m s 1 7 . 0 4 m s 1 7 . 0 8 m s 1 7 . 1 2 m s 1 7 . 1 6 m s 1 7 . 2 0 m s 1 7 . 2 4 m s 1 7 . 2 8 m s 1 7 . 3 2 m s 1 7 . 3 6 m s 1 7 . 4 0 m s V ( 2 ) - V ( 3 ) - 1 2 0 V - 8 0 V - 4 0 V - 0 V 4 0 V 8 0 V 1 2 0 V (c)
Figure 21. Shorter time span for the (a) phase A neutral, (b) phase B neutral, and (c) line-to-line signal from phase A to B of the outputs in Figure 20.
The PSPICE netlist for this three phase PWM circuit is given below: 3 phase FULL-BRIDGE INVERTER
************ OUTPUT IS V(2,3) **************** **********INPUT PARAMETERS ****************
.PARAM Vsource = 100 ; DC input to inverter
.PARAM Fo = 200 ; fundamental frequency
.PARAM Mf = 21 ; carrier, multiple of Fo
.PARAM Ma = .8 ; amplitude ratio
.PARAM Fc = {Mf*Fo} ; carrier frequency
VS 1 0 DC {Vsource} ; dc source ******* VOLTAGE-CONTROLLED SWITCHES ***** S1 1 2 40 30 SWITCH S2 1 3 50 30 SWITCH S3 1 4 60 30 SWITCH S4 2 0 30 40 SWITCH S5 3 0 30 50 SWITCH S6 4 0 30 60 SWITCH ************** FEEDBACK DIODES ************* D1 2 1 DMOD D2 3 1 DMOD D3 4 1 DMOD D4 0 2 DMOD D5 0 3 DMOD D6 0 4 DMOD ******************** LOAD ******************
R1 2 5 10 ; load between nodes 2 and 0
L1 5 0 60MH
R2 3 6 10 ; load between nodes 3 and 0
L2 6 0 60MH
R3 4 7 10 ; load between nodes 4 and 0
L3 7 0 60MH
*************** TRIANGLE CARRIER ************** Vtri 30 0 PULSE (1 -1 0 {1/(2*Fc)} {1/(2*Fc)} 1ns {1/Fc}) ******************** REFERENCE ***************** Vcont1 40 0 SIN(0 {Ma} {Fo} 0 0 {-90/Mf})
Vcont2 50 0 SIN(0 {Ma} {Fo} 0 0 {-90/Mf - 120}) Vcont3 60 0 SIN(0 {Ma} {Fo} 0 0 {-90/Mf - 240})
************ MODELS AND COMMANDS ************* .MODEL SWITCH VSWITCH(RON=0.001 VON=.007 VOFF=-.007)
.MODEL DMOD D ; default diode
.PROBE
.TRAN 0.5MS 33.33MS 16MS 0.1MS
.FOUR 200 25 I(R1) ; Fourier transform
.OPTIONS NOPAGE ITL5=0 .END
As long as ma is less than 1, the RMS value of the fundamental of the output voltage is a linear function of it: d a d a l l m V m V V 0.612 2 2 3 1 = ≈ − (8.24)
In the limit, when the control voltage becomes infinite, the RMS value of the fundamental of the output is then: d d l l V V V 0.78 2 4 2 3 1 = ≈ − π (8.25)
Again, equating the power on the DC and AC sides we obtain:
pf I V I V P= d do = 3 l−l1 o1⋅ (8.26)
or for normal PWM operation:
pf I m
Ido =1.06 a o1⋅ (8.27)
and in the limit for the square wave:
pf I
Ido =1.35 o1⋅ (8.28)
Finally, there are other ways to control the operation of an inverter. If it is not he output voltage waveform we want to control, but rather the current, we can either impose a fast controller on the voltage waveform, driven by the error between the current signal and the reference, or we can apply a hysteresis band controller, shown for one leg of the inverter in Figure 22.
vAo + vAN + S1 S2 Vd + Vd 2 Vd 2 T i m e 1 6 m s 1 8 m s 2 0 m s 2 2 m s 2 4 m s 2 6 m s 2 8 m s 3 0 m s 3 2 m s 3 4 m s I ( R ) - 4 . 0 A - 2 . 0 A 0 A 2 . 0 A 4 . 0 A iε Σ Switch-Mode Inverter iε iA * A i + _ Comparator tolerance band
Figure 22. Current control with hysteresis band.
8.2.3 Inverter Notes
• With a sine-triangle PWM the harmonics of the output voltages are of frequency around nfn, where
n is an integer and fn is the frequency of the carrier (triangle) waveform. The higher this frequency
is the easier to filter out these harmonics. On the other hand, increasing the switching frequency also increases proportionally the switching losses. For 6-step operation of a 3-phase inverter the harmonics are even, except the tripled ones, i.e. they are of order 5, 7, 11, 13, 17 etc.
• When the load of an inverter is inductive the current in each phase remains positive after the voltage
in that phase became negative, i.e. after the top switch has been turned off. The current then flows through the antiparallel diode of the bottom switch, returning power to the DC link. The same
happens of course when the bottom switch is turned off and the current flows through the antiparallel diode of the top switch.
8.2.4 Example 1
A three-phase controlled rectifier is supplying a DC motor that has k = 1 (V·s) and R = 1 (Ω). The
rectifier is fed from a 208 (Vl-l) source.
Filter 208 (V)
Figure 23. Figure for example problem 8.2.4. a) Calculate the maximum no-load speed of the DC motor:
Without a load the current is zero, therefore:
ω
ω IR k
k
V = + =
The maximum speed is then found by the maximum DC voltage
max
max kω
V =
The maximum DC voltage is provided by the controlled rectifier for α = 0.
(V) 8 . 281 35 . 1 max = Vl−l = V Therefore, (rad/s) 8 . 280 max = ω
b) The motor now is producing torque of 20 (N·m). What is the maximum speed the motor can achieve?
Now that there is load torque, there is also current:
(A) 20 = ⇒ =kI I T Then (rad/s) 8 . 260 1 1 20 8 . 280 − ⋅ = = − = k IR V ω
c) For the case in b) calculate the total RMS current of the fundamental and the power factor at the AC side
(A) 6 . 15 78 . 0 1 ≈ d = s I I
The power factor is then 1.
d) If the motor is now connected as a generator with a counter torque of 20 (N·m) at 1500 (rpm). What should be the delay angle and AC current?
For a DC generator: (V) 08 . 137 1 1 2 60 2 1500 1⋅ − ⋅ = ⋅ − = − = ω ω R π k T k IR k V
Since this is a generator, the voltage is negative for the inverter.
( )
α cos 208 1.35 (V) 08 . 137 = ⋅ ⋅ − º 22 . 119 = α 8.2.5 Example 2For the system shown in Figure 24, the AC source is constant, and the load voltage is 150 (Vl-l),
20 (A), 52 (Hz), 0.85 pf lagging. Filter 208 (V) α 6-step inverte
Figure 24. Figure for example problem 8.2.5. a) Calculate the voltage on the DC side and the DC component of the current.
For the 6-step inverter
(V) 192 78 . 0 1 , = ⇒ = −l d d l V V V (A) 23 192 85 . 0 20 150 35 . 1 3 ⋅ = 0 ⇒ 0 = ⋅ ⋅ ⋅ = = Vl−lIl pf VdId Id P
b) Calculate the AC source side RMS and fundamental current and power factor.
For a 3-phase rectifier
( )
192 1.35 208 cos( )
cos( )
0.685 cos 35 . 1 ⇒ = ⋅ ⋅ ⇒ = = l−l α α α d V V (A) 94 . 17 78 . 0 1= d = s I I( )
0.685lagging cos = = α pf8.3 DC-DC Conversion
DC to DC conversion is often associated with stabilizing the output while the input varies, however the converse is also required in some applications, which is to produce a variable DC from a fixed or variable source. The issues of selecting component parameters and calculating the performance of the system is the focus of this section. Since these converters are switched mode systems, they are often referred to as choppers.
8.3.1 Step-Down or Buck Converters
The basic circuit of this converter is shown in Figure 25 connected to a purely resistive load. If we
remove the low pass filter shown and the diode, the output voltage vo(t) is equal to the input voltage Vd
when the switch is closed, and zero when the switch is open. The average output, Vo, is then:
d s on T t t d s o V T t dt dt V T V s on on = ⎥ ⎦ ⎤ ⎢ ⎣ ⎡ + = 1
∫
∫
0 0 (8.29) L R (load) vo + io C Low-pass filter o = V iL + v L + Vd vo o V d V t 0 s T = 1 s f on t off tThe ratio of ton/Ts = D, the duty ratio.
The low pass filter attenuates the high frequencies (multiples of the switching frequency) and leaves almost only the DC component. The energy stored in the filter inductor (or the load inductor) has to be absorbed somewhere other than the switch, hence the diode, which conducts when the switch is open. Here we study this converter in the continuous mode of operation such that the current through the
inductor never becomes zero. As the switch opens and closes the circuit assumes one of the topologies of Figure 26. L R + C Vo iL + vL + Vd L R + C Vo iL + vL t vL A B t iL 0 on t off t iL= Io s T = 1 s f Vd - Vo - Vo
Figure 26. Operation of the buck chopper.
We will use the fact that the average voltage across the inductor is zero, and assume a perfect filter
such that the voltage across the inductor is (Vd – Vo) during ton, and –Vo for the remainder of the cycle.
(8.30)
(
)
(
)
0 0 − + − = =∫
∫
s on on T t o t o d o V V dt V dt V(
Vd −Vo)
ton−Vo(
Ts−ton)
=0 (8.31) D T t V V s on d o = = (8.32)Also using the fact that the input and output powers are the same gives:
o o d dI V I V = (8.33) D V V I I d o o d = = (8.34)
We analyzed this under the assumption of continuous mode of operation. In the discontinuous mode, the output DC voltage is less than what is given here, and the chopper is less easy to control. At the boundary between continuous and discontinuous modes, the inductor current reaches zero for one instant every cycle, as shown in Figure 27.
0 s T = 1 s f on t off t vo t iL iL, avg= IL Vd- Vo - Vo iL s T = 8 L 0 0.5 1.0 D IL,max Vd IL
Figure 27. Operation of the buck converter at the boundary of continuous conduction.
From this figure we can see that at this operating point, the average inductor current is IL = ½ iL, and:
(
)
s(
d o)
o d on L V V L DT V V t I = − = − 2 2 1 (8.35) Since the average inductor current is the average output current (the average capacitor current is zero), equation (8.35) defines the minimum load current that will sustain continuous condition.Finally, a consideration is the output voltage ripple. We assume the ripple current is absorbed by the capacitor, i.e. the voltage ripple is small. The ripple voltage is then due to the deviation from the average of the inductor current as show in fig. Under these conditions:
2 2 2 1 1 L s o T I L C Q V = Δ = Δ Δ (8.36) where
(
)
s o L DT L V I = − Δ 1 (8.37)(
D)
LC T V V s o o = − Δ 1 8 1 2 (8.38) t vL A B t iL 0 on t off t iL= Io s T = 1 s f Vd- Vo - Vo o ΔV 2 vo t 0 VoAnother way to view this is to define the switching frequency fs = 1/Ts and use the corner frequency of the filter fcorn =1
(
2π LC)
:(
)
2 2 1 2 ⎟⎟⎠ ⎞ ⎜⎜ ⎝ ⎛ − = Δ s corn o o f f D V V π (8.39)8.3.2 Step-Up or Boost Converter
Here the output voltage is always higher than the input. The schematic is shown in Figure 29.
L
R
+
C
V
oi
L+
v
L+
V
dFigure 29. Schematic diagram of a boost converter.
Based on the condition of the switch, there are two possible topologies as shown in Figure 30. Again, the way to calculate the relationship between input and output voltage we take the average current of the inductor to be zero, and the output power equal to the input power giving:
(
−)(
−)
=0 + d o s on on dt V V T t V (8.40) D V V d o − = ⇒ 1 1 (8.41) D I I d o = − ⇒ 1 (8.42)L R + C Vo iL + vL + Vd L R + C Vo iL + vL t vL A B t iL 0 on t off t iL= Io s T = 1 s f Vd- Vo - Vo + Vd
Figure 30. Two circuit topologies of the boost converter.
To determine the values of inductance and capacitance we study the boundary of continuous
conduction like before and the output voltage ripple. At the boundary of the continuous conduction, the geometry of the current waveform gives:
(
1)
22L D D
V T
Io = s o − (8.43)
The output current must exceed this value for continuous conduction. Using the ripple analysis as shown in Figure 31 we find:
RC DT V V s o o = Δ (8.44)
It is important to note that the operation of a boost converter depends on parasitic components,
especially for duty cycle approaching unity. These components will limit the output voltage to levels well below those given by equation (8.41).
t ΔQ ΔQ iD iD= Io o ΔV vo t 0 Vo DTs (1-D)Ts
Figure 31. Calculating the output voltage ripple for a boost inverter.
8.3.3 Buck-Boost Converter
This converter has a schematic shown in fig. and can provide output voltage that can be lower or higher than the input voltage.
Again the operation of the converter can be analyzed using the two topologies resulting from the operation of the switch as shown in fig.
By equating the integral of the inductor voltage to zero we get:
(
−)(
1−)
=0 + o s s dDT V DT V (8.45) D D V V d o − = ⇒ 1 (8.46)At the boundary between continuous and discontinuous conduction we find
(
1)
22L D
V T
The output ripple, as calculated from Fig. is RC DT V V s o o = Δ (8.48)
L
R
+
C
V
oi
D+
v
L+
V
di
oi
Ls s t vL A B t iL 0 IL= (I + I o) s T = 1 s f - Vo Vd L R + C Vo iD + vL + Vd io iL L R + C Vo + vL + Vd io iL DT (1-D)T d
Figure 33. Operation of a Buck-Boost chopper.
8.3 Example
The input of a step down converter varies from 30 (V) to 40 (V) and the output voltage is to be constant at 20 (V), with output power varying between 100 (W) and 200 (W). The switch is operating at 10 (kHz). What is the inductor needed to keep the inductor current continuous? What is then the filter capacitor needed to keep the output ripple below 2%?
The duty cycle will vary between D1 = 20/30 = 0.667 and D2 = 20/40 = 0.5. The load current will
range between Io1 = 100/20 = 5 (A), and Io2 = 200/20 = 10 (A).
The minimum current needed to keep the inductor current continuous is:
(
d o)
s o V V L DT I = − 2 min ,Since the constant is the output voltage, Vo, and the minimum load current must be greater than Io,min, we
can express it as a function of Vo and make it less than or equal to 5 (A), or:
( )
(
)
(
D)
L T V V V L DT Io = s d − o = o s − ≥ 1 2 2 A 5 ,minTs = 1/10(kHz), Vo = 20 (V), and the maximum value is achieved for D = 0.5, leading to Lmin = 50 (µH).
For the ripple, the highest will occur at 1-D = 0.5, thus:
(Hz) 900 10 10 5 . 0 2 02 . 0 2 3 2 = ⇒ ⎟⎟ ⎠ ⎞ ⎜⎜ ⎝ ⎛ × =π fcorn fcorn (Hz) 900 10 50 2 1 6 = × ⇒ − C π C = 625 (µF)