www.bptrends.com
The 2005
Enterprise Architecture,
Process Modeling &
Simulation Tools Report
Version 1.0 April 28, 2005
Curtis Hall
Paul Harmon
Copyright (c) 2005 Business Process Trends. www.bptrends.com
Contents
Foreword by Celia Wolf ………...………..……….. 1
Introduction ……….……… 4
A Detailed Analysis of EA, Process Modeling & Simulation Tools ………13
CACI’s SIMPROCESS ………. 25
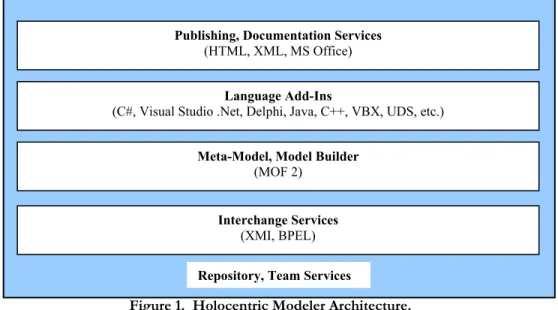
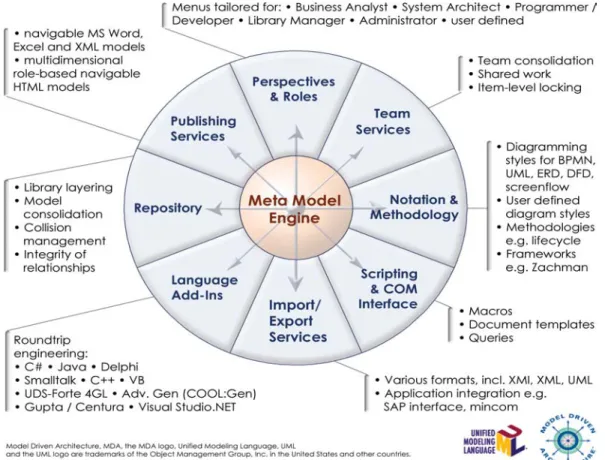
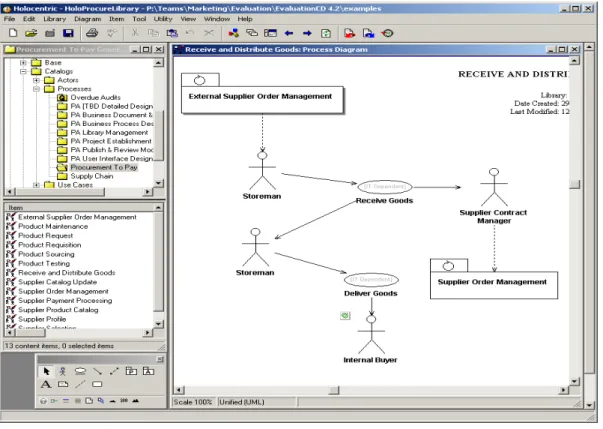
Holocentric’s Holocentric Modeler ....……….……… ……… 41
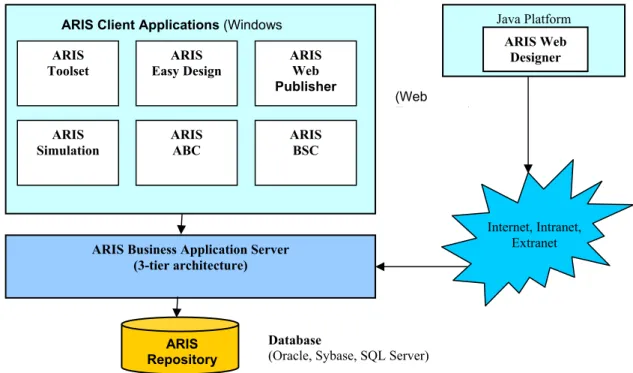
IDS Scheer’s ARIS ………...……….……… 57
iGrafx’s iGrafx ………....………...……… 72
MEGA’s MEGA Suite ………..…..……… 87
Popkin Software’s System Architect ……….……...…………...……… 104
Process Wizard Ltd.’s ProcessWizard ………..…………...…… 118
Proforma Corporation’s ProVision ……… 133
ProModel Solutions’ Process Simulator ………...………...……… 147
xBML Innovations’ xBML Modeling Suite ……….…..……….…… 158
EA, Process Modeling & Simulation Tools Matrix ………...……… 174
Copyright (c) 2005 Business Process Trends. www.bptrends.com 1
Foreword
This is the second in a series of reports that BPTrends plans to produce and publish on business process software products. We are producing these reports to provide our members with an overview of the various types of business process software products available today. In each report we will define the specific market, describe the features important in tools designed for that market, provide detailed reviews of the leading players and their products, and provide a comparison of the key features of the products.
Figure 1 provides an overview of the business process software products market as BPTrends currently defines it. We use circles to represent the major product groupings and have overlapped circles to suggest key relationships. The olive area in the center of Figure 1 represents the product groupings we focused on in the BPTrends 2005 Enterprise Architecture, Process Modeling, and Simulation Tools Report.
Process Modeling Tools Business Process Management Suites Simulation Tools Organization and Enterprise Modeling Tools BPM Applications Business Process Monitoring Tools Business Rule Management Tools BP Languages Workflow Tools EAI Tools Software Modeling & Development Tools Drawing Tools
Figure 1. The Business Modeling Software Product Market.
What Are Enterprise Architecture, Process Modeling, and Simulation Tools?
This report focuses on tools that companies use to analyze and modify business processes. The core tool for this task is a tool that lets business managers or analysts create a diagram or model of a business process and then change that diagram to explore how the process could be improved or redesigned. Some business process change teams prefer process modeling tools that are simple and easy to use. Others prefer more sophisticated tools that can support additional tasks. Many organizations use the same process modeling tool to analyze many different processes. Some create
Copyright (c) 2005 Business Process Trends. www.bptrends.com 2
diagrams of entire value chains and then subdivide the chain into separate processes and subprocesses to understand how everything works together. Similarly, many companies analyze their organizations as a whole to define how all the processes or value chains work together. At the same time they extend the process models to show how resources flow into the processes and how employees and software systems support processes. Others use their process modeling tools to gather cost data on processes. Some use process simulation tools to explore how a process will function before they make physical changes in actual processes.
Tools that provide support for organization analysis and modeling are, today, usually termed Enterprise Architecture tools. Tools that focus entirely on simulation are termed Simulation Tools. Increasingly, however, companies are using business process modeling tools that also incorporate support for enterprise modeling and simulation. Thus, we decided to include all the tools that can be used for Enterprise Architecture, Business Process Modeling, and Process Simulation in the same report.
To simplify the language of the report, we will use the term modeling tool as a generic phrase whenever we want to refer all the tools being considered in this report. We will use the terms enterprise architecture tool, process modeling tool, or process simulation tool only when we wish to refer to tools that provide these specific functions.
We have consciously excluded three other types of tools from this report. We do not consider the simpler graphical drawing or diagramming tools. These tools are widely used for creating simple process diagrams, but they cannot support sustained modeling and redesign efforts. The key to discriminating between the drawing tools and serious process modeling tools is whether they store data about the models in a database or repository. Serious modeling tools create data entries in a database. Thus, a box drawn in a process modeling tool is not simply an image of a box; it is an object in a database. Once you give the box a name you can begin to record information about that process or activity. You can record costs and associated business rules. You can indicate where inputs come from and where outputs go, and you can name the software applications that support that activity. More important, you can create a new diagram and create a new box with the same name and immediately inherit all the data you have already entered to describe that activity. In other words, a serious process modeling tool is the interface for a database that allows you to organize and save information about your business processes. All of the process modeling tools considered in this report store data about processes and can be used to create and manage a database of information about your organization’s processes.
Second, we do not consider either BPM Suites or Software Modeling Tools in this report. The BPM Suites are considered in a separate report, The BPTrends 2005 BPM Suites Report, which we published and posted to BPTrends in March, 2005 BPM Suites include process modeling tools, but they are primarily used to manage the day-to-day execution of business processes. They also provide other capabilities used by those managing processes, including business rule execution engines and real-time process monitoring. Similarly, we have not included the various Software Modeling Tools in this report. Those tools are used by software developers to capture business requirements and to design software applications. A glance at marketing data reveals that vendors in the Process Modeling, BPM Suites, and Software Modeling markets are not competing with each other. In essence, there are three separate market niches. The leading Process Modeling vendors are all flourishing and Process Modeling tools are being used by business managers and analysts who want to create or improve their business processes.
Our objective in this report is to describe the various options available from Enterprise Architecture, Process Modeling, and Process Simulation vendors. Different companies are using these tools for very different purposes. It does not make sense to argue that there is, or should be, a “best” tool with a specific configuration that would be best for all. Thus, we have avoided any comparison that suggests that some tools are the “winners” while others are “less desirable.” Instead, we analyze each
Copyright (c) 2005 Business Process Trends. www.bptrends.com 3
product, explain what specific markets the vendor is pursuing, consider how the tool is adapted for that market, and identify what is special or unique about each product.
To make comparisons as easy as possible, we have explored the capabilities of modeling tools in several ways. These are discussed in the section entitled, “A Detailed Analysis of Enterprise, Process Modeling and Simulation Tools.” Some vendors only implement a subset of the features we describe. That does not necessarily detract from their offering. It could mean that the vendor does not think the feature is required for its target market. Or it could mean that the vendor thinks it is more efficient to partner with another vendor who provides that specific feature. For example, we asked each vendor how it supports simulation. Some have built their own simulation engine into their tool. Others provide links to another simulation tool developed by a third party. Still others do not provide a simulation engine, allowing users to select their own. No one of these solutions makes the underlying Process Modeling tool better or worse, although it may make it more or less popular with a particular user. Users that already have a simulation tool may prefer a business modeling product without an embedded simulation system. Users at companies that do not currently have a standard simulation tool may prefer a modeling tool with its own simulation engine. As we said, it is impossible to say exactly what the ideal business modeling tool should have or not have. We have sought to provide a simple, clean description of the current features available in each product in this report.
Participating Vendors
BPTrends contacted all the Enterprise Architecture, Process Modeling, and Simulation tool vendors we could identify and solicited their participation in this report at a cost of $5,000. All products from participating vendors were evaluated in the same manner: Curt Hall and Paul Harmon prepared a detailed questionnaire that each vendor was asked to complete.. They reviewed the questionnaires, studied the product documentation and any other relevant materials provided by the vendors, and then requested a product demonstration. Finally, they interviewed each vendor to eliminate any confusion and to make certain they had not overlooked anything. They did not conduct any actual product testing.
We intend to maintain and expand this report in the future. Any vendors who would like to be included in future versions of this report should contact me directly.
Thanks to Our Coauthors and Members
I want to thank our friend and colleague, Curtis Hall, for his contribution as the principal analyst and author of this report. Curt’s knowledge and experience as an editor and analyst proved invaluable in researching and writing this Report. I also wish to thank my longtime friend and business partner, Paul Harmon, for bringing his vision, knowledge, and perspectives on the business process performance market to bear on this report. Finally, I want to thank all our BPTrends members and readers who continue to support us. We hope this report is informative and useful to all of you, and we look forward to hearing your comments and suggestions.
Celia Wolf
CEO and Publisher
Business Process Trends
Introduction
Copyright (c) 2005 Business Process Trends. www.bptrends.com 4
Introduction
1. Why the Current Interest in Business Processes?
The press and various analyst groups have spent the last 3 to 4 years discussing the renewed interest in business process change. Business managers, of course, have been interested in business process change for decades, but their interest and those of the press and analysts tend to grow with new innovations and wane when conditions conspire to focus their attention elsewhere. Over the last decade we have witnessed successive waves of interest in Quality Control and Six Sigma, in Business Process Reengineering, in Workflow and Packaged Software Applications, in Balanced Scorecard, and, more recently in Business Process Management software systems (BPM Suites) designed to control the execution of actual applications. And, while all of these initiatives have been explored, organizations have continued to change business processes by automating more and more aspects of the business. Today, Internet and the Web implementations are driving process changes throughout most organizations.
Throughout the entire decade, while the specific initiatives we just described have waxed and waned, companies have continued to work to understand their business processes and to improve them. To help with this effort, most large companies have employed business process modeling tools. Thus, unlike many of the recent BPM Suite vendors, most of the business process modeling vendors have been in existence for several years. In a sense, the process modeling market is more mature than the BPM Suites market. In another sense, however, it is still developing. The recent emphasis on aligning processes and activities with IT resources to track the achievement of objectives and to determine the process specific costs, for example, has led to a number of developments that have resulted in the emphasis on Enterprise Alignment and simulation. Similarly, the development of the Internet and Web has changed the nature of many businesses and has lead to major changes in how software applications are deployed to support business processes. Thus, today’s business process modeling tools market is very dynamic, with all the vendors scrambling to add new features and support for newly evolving standards to their products. .
In a similar way, companies are reevaluating their business process management practices and exploring new, more comprehensive ways to employ process modeling tools. Thus, it is too early to offer a rigid definition of what a business process modeling tool should be or to propose a way of evaluating which business process modeling tool is best. Companies doing Six Sigma work may prefer one type of process modeling tool, while companies redesigning processes for automation may prefer another. Likewise, those using process modeling tools to document enterprise architectures will have still their own particular requirements. Predictably, most business process modeling tools will be considerably different in 12 or 18 months.
2. An Overview of Business Modeling Tools
Business Modeling Tools, as we use the term in this report, are software products that are used by business managers, analysts, or developers to create models of business organizations, to analyze models, and to save information about models.
Business Modeling Tools serve three primary functions. First, they document an existing situation. Second, they assist in analyzing the effects of possible changes. Third, they document plans to change the existing situation in some way. As a result they provide the ability to create various types of diagrams. Diagrams that picture an organization’s current state are often referred to as “As-Is” diagrams. While diagrams that picture how an organization might be as a result of changes are often termed “To-Be” diagrams.
Introduction
Copyright (c) 2005 Business Process Trends. www.bptrends.com 5
Some modeling tools are specialized and only assist in the development of a specific kind of diagram. Thus, some tools only support process modeling, or the development of a business or enterprise architecture. On the other hand, many support numerous different kinds of diagrams and, consequently, can be used for a variety of different purposes.
Simple Drawing Tools Versus Repository-Based Modeling Tools
A key distinction can be made between tools that assist in the development of graphics and those that are based on databases or repositories. The former really only automate what could otherwise be done with a pen and paper – they make it easy to create a diagram. The latter use the graphic as a way of populating a database and for saving information from multiple diagrams, thereby gradually accumulating data about a wide variety of different models. Well designed business modeling tools rely on a metamodel that defines the basic objects one might want to discuss – departments, managerial roles, processes, subprocesses, activity costs, entities generated – and the relationships that exist between them. Consequently, using such a tool, once you have indicated that activity A produces an output that is an input of activity B, then, henceforth, whenever you consider activity B in any other diagram, the tool will “know” that it receives inputs from activity A. Similarly, if you indicated that manager M is in charge of department D, and that activity A is performed by department D, the tool will know that manager M is responsible for activity A. If you subsequently asked the tool to generate a list of all of manager M’s responsibilities, activity A would appear on the list. Thus, using a repository-based modeling tool, you gradually accumulate information about the organization’s structure and processes.
Many managers use simple graphical tools to create organization diagrams or models of process flows. These tools are useful for simple tasks. Increasingly, however, companies seek to collect and integrate information to enable managers to analyze organizational processes in more sophisticated ways. For example, some executives want to be able to examine the performance measures indicating how major value chains are performing. If a given value chain is not performing up to expectations, those same executives would like to drill down and determine the process or subprocess that is deficient. They might even want to determine who manages the activity that is deficient, what it costs to perform the activity last month, or what would happen if half the employees assigned to that activity where switched to another. This kind of integrated information can be maintained by the best architecture and process modeling tools and these types of questions can be asked of tools that provide various types of simulation capabilities.
In this report we ignore the simple graphic tools and focus only on tools that maintain data about the models that are created. Beyond that, however, we consider a wide variety of products.
Modeling Tool Users
Different modeling tools are designed with different groups of users in mind. Some are designed to support a specific group of users – say business managers – while others are intended for more technical users like business analysts or IT developers.
Simulation, for example, can be complex. Consequently, it is difficult to produce a tool that makes it simple for managers to create effective simulations. Thus, there is a natural divide between general purpose process modeling tools that support some simulation and those tools that are, in essence, designed for a more technical audience that understands more about simulation and therefore wants a more sophisticated simulation tool.
Another distinction can be found between modeling tools that are designed primarily for business managers or business analysts and those designed to support both business analysts and IT analysts. The former tend to have a less complicated user interface. This is because they don’t need to consider all the complexities that the latter must support if they were to also support software modeling or code generation in addition to process modeling.
Introduction
Copyright (c) 2005 Business Process Trends. www.bptrends.com 6
In this report we include tools whose primary user audience includes business managers and business analysts. Put a different way, we include tools that can be used to model, analyze, redesign or improve enterprise architectures and business processes. Some of these tools also provide interfaces for IT developers and we include those tools, provided that they also make a serious effort to support business managers or analysts.
We have excluded tools that are primarily designed for software analysts and developers.
In a similar way we have excluded tools that are designed to execute business process management applications. Although these BPM Suites all include process modeling environments, their primary focus is on defining processes that the BPM Suite can manage when the process is actually executed. In addition, most have interfaces more resembling IT analysis and design tools than the tools reviewed in this report.
Support for Process and Architectural Frameworks
Some tools are generic and can be used for any type of architecture or process modeling. Others incorporate support for process or architectural frameworks that make them easier to use for specific types of analysis and modeling. Thus a tool that supports the Supply Chain Council’s SCOR framework provides supply chain managers with a leg-up when it comes to modeling a supply chain process. On the other hand, the SCOR framework doesn’t help someone that’s trying to model a New Product Design Process.
Tools that support frameworks can do so in different ways. SCOR consists of a set of modeling conventions, named processes like Source, Make and Deliver, metrics for evaluating those processes and best practices to help analysts evaluate whether existing processes could be improved. A tool may support SCOR simply by making it possible for a manager to create boxes and label them Source, Make and Deliver. Or it may support SCOR by supporting the specific notation used by the Supply Chain Council. iIt may even go further and package all of the SCOR metrics and best practices in a database so that a developer can quickly determine the appropriate measures for a Source process, for example. Hence, support for the SCOR framework can be rather difficult to determine.
There is a sense in which SCOR is a horizontal process framework. Most companies have supply chain processes and any company with a supply chain process can use SCOR. The TeleManagement Forum is a consortium of telecommunications companies that have developed a framework that describes the specific business processes of telecom companies. The current version, called the eTOM framework, is the third iteration of a Telecom Business Process Architecture. Earlier designs only described the operational processes within telecom companies. As companies began to implement e-business applications, however, they discovered that processes included in general and enterprise management had to be added to the architecture. One of the major advantages of e-business systems is that they integrate management and operations and it is important that everyone have a clear overview of all the processes if they are to see how integration might occur.
Figure 1 shows the eTOM framework. This figure also provides an idea of how a telecommunications company is organized. In essence, a telecom sells time on its network to customers. Since the time is sold and monitored by means of computers that track phone access, Service and Resource are important functions. Since almost all long distance phone calls cross multiple networks, arrangements with other telecom companies – partners – are very important. We suspect that actual phone companies might subdivide their departments somewhat differently; placing marketing and service in separate departments, but remember that most phone sales and service requests come in through a common call center, so this high-level grouping works reasonably well. In any case, Figure 1 provides an idea of how a group of telecom managers felt they could represent their organizations.
Introduction
Copyright (c) 2005 Business Process Trends. www.bptrends.com 7
Figure 1 also provides a nice idea of an organization diagram. In essence, this diagram shows departments, some reporting relationships, and how processes cut across departmental lines. Increasingly, architecture and process modeling tools are including the ability to create high-level organization diagrams, like the one in Figure 1, to help managers obtain a broad prospective of how processes are used within an organization.
Cu
st
om
er
Enterprise Management Processes
S up pl ier s/ P ar tner s CEO Executive Committee Fulfillment Assurance Billing
Operations Support & Readiness Core Process
Selling Order Handling
Problem Handling
CRM Operations Support & Process Mang. Sales & Channel Mang.
CRM Operations Readiness
Market, Product and Customer Relationship Management Service Management
and Operations
SM&O Support & Process Mang. SM&O Readiness RM&O Readiness
RM&O Support & Process Mang. S/PRM Operations
Support & Process Mang. S/PRM Operations
Readiness
Resource Management and Operations (IT) Supplier/Partner
Relationship Management
Marketing Fulfillment Response
Retention & Loyality * Customer Interface Mang *
Customer QoS/SLA Mang.
Billings & Collections Mang. Retention & Loyality * Customer Interface Mang *
Retention & Loyality * Customer Interface Mang *
Strategy, Infrastructure & Product Processes Operations Processes
Service & Specific Instance Rating Resource Data Collection,
Analysis & Control S/P Settlements & Billing
Mang.
Billing Process
Operations Support & Readiness Core Process
Service Problem Mang. Service Quality Analysis Action & Reporting Resource Restoration
S/P Problem Reporting & Mang S/P Performance Mang. Assurance Process Fulfillment Process S/P Buying S/P Purchase Order Management S/P Interface Mang * S/P Interface Mang * S/P Interface Mang *
Service Configuration & Activation Resource Provisioning &
Allocation to Service Instance
Figure 1. A detailed version of the eTOM Business Process Architecture.
Just as there are process frameworks, like eTOM and SCOR, there are architecture frameworks that structure organizational data according to different conventions. The Zachman Framework, for example, is designed to organize company information according to a specific set of categories. At the moment the most interesting work in Business or Enterprise Architectures is taking place in the US government, which is under a congressional mandate to develop and use Enterprise Architectures to structure the management of their processes and to guide their business decisions. Different US government agencies have created different architectural frameworks to organize their information.
Introduction
Copyright (c) 2005 Business Process Trends. www.bptrends.com 8
For example, the US government’s CIO council has defined the Federal Enterprise Architecture Framework (FEAF) which is pictured in Figure 2.
Business Drivers Design Drivers Architecture Drivers Strategic Direction Vision Principles Data Applications Technology Standards Transactional Processes Architectural Models Investment Review Segment Coordination Market Research Asset Management Technology Architecture Business Architecture Data Architecture Applications Architecture Arch itectural Se gments Technology Architecture Business Architecture Data Architecture Applications Architecture Target Business Architecture Data Architecture Applications Architecture Technology Architecture Security Architecture Architecture Current
Figure 2. The Structure of the FEAF Architecture.
A number of government architectures, including the US Department of Defense’s C4ISR framework, and the Treasury Department’s Treasury Enterprise Architecture Framework (TEAF) are variations on the FEAF. In essence, these architectures define departmental goals and strategies, and, in some cases, process architectures, but their focus is primarily on organizing IT resources. As with SCOR, a given tool can support an architecture like FEAF in a minimal way, or it can provide a wide variety of different utilities to make it easy for analysts to document and generate reports that accord with the conventions of one of these architectures.
Some tools provide generic organizational diagramming capabilities. Others supplement their generic capabilities with specific architectural frameworks that make it easier for users to apply specific architectural conventions to structure their organizational models and organize the data they gather about their processes.
There is a large number of different frameworks and vendor support for frameworks varies considerably. Hence, some tools support a wide variety of different frameworks while others specialize in supporting only a few specific frameworks.
Different Notations and Different Methodologies
There are a few popular methodologies, like Balanced Scorecard, Six Sigma, and Lean, and there are popular notations described in books by process methodologists like Burlton or Rummler, or by consulting firms like CSC or Accenture. Most companies have their own methodologies and notations that they have created by combining one or more of these public approaches. In a similar fashion, most of the modeling tools offer proprietary notations in addition to supporting other popular notations.
Introduction
Copyright (c) 2005 Business Process Trends. www.bptrends.com 9
Some modeling tools support 20 or more different types of diagrams and dozens of different notations. Others support only one or a few notations and only a few types of diagrams. Additionally, some allow users to tailor notations or diagrams to suit their own conventions.
Some companies buy modeling tools for use by a specific project team or group. Others seek to standardize on tools that everyone in the organization can use. If a company only wants a tool for a specific purpose, then it will only care that the tool supports a specific set of diagrams using a single notation. On the other hand, if a company wants to standardize on a tool that many different groups can use for diverse tasks, it will probably want a tool that supports a wider variety of notations and methodologies.
For instance, a Six Sigma project team usually does not require a tool that supports very complex process diagrams. They are more concerned with the specific types of diagrams commonly used by Six Sigma practitioners, like “fishbone” diagrams, and by the ability of the tool to determine certain statistical measures. However, a redesign team that plans to change a process and then hand the results off to an IT group that will develop software to automate the process will probably insist on a tool that can not only do simple process diagrams but can also support the popular UML diagrams that software designers typically use. Similarly, business managers who are designing processes that will be automated by packaged applications from a company like SAP or Oracle will probably want a modeling tool that includes features for showing how processes will relate to specific packaged modules.
Standards
There are also concerns about standards—and many have hailed recent efforts to bring more standardization to the process modeling market. Two important standardization efforts include the development of the Business Process Modeling Notation (BPMN) and the Unified Modeling Language (UML) version 2.0.
The BPMN was created by the Business Process Management Initiative (BPMI) organization. BPMN is designed to facilitate the graphical representation of business processes. It is important because it provides both a standard way of describing business processes and it can be used to generate BPEL, an XML-based business process execution language. Specifically, BPMN is designed so that a user can use a BPMN diagram to generate BPEL code. (This would standardize the approach that many BPM Suites vendors are taking.) A number of modeling tool vendors have added BPMN support to their products as well as interfaces for generating BPEL code from BPMN diagrams created in their tools.
Modeling tools that support BPMN make it easy for users to move from a model created in one tool to a BPM Suite that runs BPEL. It’s too early to determine how popular BPMN will become, but some modeling vendors are embracing the notation because of the widespread interest in BPM among some customers.
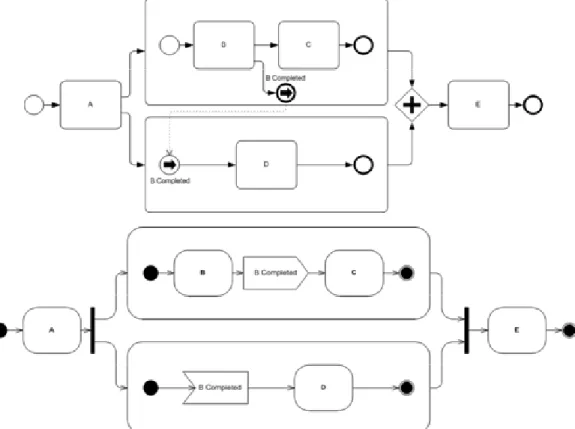
BPMN comes in two versions, a simple version that business managers can use and a more sophisticated version that provides all the details needed to generate software code. Companies that use tools that support BPMN are, in effect, using a tool that both business managers and IT developers can use to coordinate the move from an informal workflow diagram to a detailed specification that a BPM Suite could execute to manage an ongoing process. (See Figure 3.)
Initial versions of the Object Management Group’s (OMG) -UML (UML 1.0, 1.1) standard were primarily used by software developers for process automation efforts. However, UML was never very popular with business users. The latest release of UML, version 2.0, represents a major redesign of the language and includes a much improved Activity Diagram notation which has generated a lot of interest among organizations that use UML for software development. In essence, as with the BPMN, if business modelers use UML Activity Diagrams they can be passed to IT developers who can then use those diagrams as the starting point for software development.
Introduction
Copyright (c) 2005 Business Process Trends. www.bptrends.com 10
The OMG is also working on a business process metamodel which will facilitate translating one model into another. Thus, companies using UML Activity Diagrams can later convert them to BPEL or to Java.
UML Activity Diagrams and basic BPMN diagrams are very similar, and it is possible they will be combined or linked in the near future. (See Figure 3.) No matter what happens, the similarity between BPMN and UML Activity Diagrams suggests that in the near future business modeling tools will be shifting away from their various proprietary notations to one of the standard, public notations.
Figure 3. This diagram is from an article published on BPTrends by Stephen White, entitled Process Modeling Notations and Workflow Patterns. Both picture the same process. The top diagram is a
BPMN diagram and the bottom is a UML Activity Diagram.
In a similar way the OMG is working on a set of standards and metamodels that will make it easier to exchange model information between tools and databases. The most important, at this moment, is XMI, an XML language for exchanging modeling information. Most companies will want to buy tools that support XMI to assure that if they subsequently decide to shift to a new tool or database they will be able to utilize existing models and documentation they have created in the earlier tool. Most modeling tool vendors either support XMI or have announced their intension to do so. Support for the OMG’s business process metamodel, or the business rule metamodel, is premature, since these standards are not yet complete. We mention them only to remind readers that any modeling tool vendor that wants to remain at the cutting edge will need to continue to modify their product in the years ahead. As new standards are completed and published, companies will want to use tools that support those standards. Thus, the competition between tool vendors will intensify in the years ahead as new standards are introduced and the vendors rush to support them.
No matter what standards one is interested in, standards present special problems because they are rapidly evolving. For example, the initial release of UML 1.1 supported a dozen different types of
Introduction
Copyright (c) 2005 Business Process Trends. www.bptrends.com 11
diagrams. The recent release of UML 2.0 changed the names of some diagrams, added others and introduced an even more complex set of notations. Thus, it’s not enough to know if a modeling tool supports UML. One needs to know if it supports UML 1 or 2, and, in most cases, what specific UML diagrams it supports.
Support for Specific Operating Systems or Technical Infrastructures
Up until now we have only discussed architecture or process-oriented features of these tools. All of these tools are also software products and thus users will also be concerned by the software infrastructure and the operating systems that these tools support. Companies committed to Microsoft environments will prefer tools that work with Microsoft infrastructure products. Similarly, companies that want to develop Internet applications will want tools that support Internet protocols and emerging Service Oriented Architecture (SOA) protocols.
There Is No Perfect Modeling Tool
At this point it should be obvious that there are lots of different types of modeling tools that fall within our definition. By focusing on specific groups of users, on specific tasks, and by supporting specific methodologies or frameworks a tool vendor can tailor its offering to assure that is more useful and therefore more popular with a niche audience. The perfect tool for one niche audience – say Six Sigma project teams – may not be the best tool for another audience – say business architects that want to create a repository of all the business processes in the company. It would be nice if we could subdivide the tools and say which is best for each niche, but the market is too small. Thus, most vendors have tried to create tools that can be used by more than one audience. As a result, many vendors offer a core product and then a variety of extension or add-on products that can be used to make the tool more useful to one or more specialized audiences. In addition, most vendors position their product as a contender in more than one niche market. For example, a simulation vendor offers a tool that can be used by both simulation specialists as well as general process modelers. Another vendor offers a tool that is good for both enterprise architecture work and redesign projects. Consequently, at this point in time, we concluded that the best we could do was to try to describe each tool as accurately as possible and let readers decide which mix of features would work best for them.
3. The Market for Business Process Modeling Tools
Modeling tools are used by business managers and business analysts to analyze and document the way organizations and processes work and to determine how processes can be improved.
There are a number of drivers, but they all fall under one of two broad categories. When times are tough, companies want to minimize costs. That entails making processes more efficient, leaner, or more automated. When times are better, organizations seek to grow their markets or enter new markets. In essence, companies seek to take advantage of new opportunities presented by new customers or new technologies, or both. That entails creating new processes, using new technologies to create better processes, or simply reorganizing existing processes to offer more value to customers. Some business activities increase or decrease with the business cycle. Process analysis, modeling and process change is constant, serving first to improve efficiency, then to add new capabilities and then, again to make the new capabilities more efficient, and so on.
What has changed recently is that senior management teams are putting a greater emphasis on process-based management. In effect, senior managers want to develop a more integrated overview of their organizations. They want to be able to see how performance relates to specific processes and activities and how resources are used by specific activities. In other words, managers want to be in a position to change quickly--either to save money or to take advantage of a new opportunity. It is popular, today, to say that executives want their organizations to be more agile. And many business executives have concluded that organizing around processes provides better control and more agility.
Introduction
Copyright (c) 2005 Business Process Trends. www.bptrends.com 12
In many organizations this has translated into matrix management systems in which some managers control the departmental groups while others work to maximize the efficiency of processes that cut across departmental lines. As this trend grows, there is a need for pictures of the organization that stress processes. The old organizational chart with its departments simply doesn’t provide enough information.
The combination of the perennial need for process models and the newer interest in modeling the entire organization and showing how processes and departments coordinate their responsibilities have combined to drive a rapidly growing market for business modeling software products that shows no signs of abating.
Modeling Tools Versus BPM Suites and IT Modeling Tools
Business Modeling Tools, BPM Suites, and IT Modeling Tools are, in a general way, very similar. They all provide users with a way to define a business processes. Some will wish their company could simply buy one tool that everyone could use. To date, however, that approach has not proved popular. The fact remains that although the tools are similar in many ways, the audiences that use them are rather different and require tools that emphasize different capabilities. Thus, today, there are three more or less independent markets: one for vendors selling tools that can be used to analyze, model and redesign organizational architectures and business processes, one for those who want tools to manage the execution of business processes (BPM Suites), and one for those who want to develop software applications. Given the size and specialized concerns of each group, we don’t expect these markets to merge anytime soon.
Put another way, business managers find modeling tools difficult to use. Surveys consistently show that the majority of business managers use text outlines and simple graphic drawing tools to describe business processes. Those business managers who are willing to use more sophisticated products use what this report terms modeling tools. Similarly, most business analysts use modeling tools. Both managers and business analysts like the relatively straight-forward user interface associated with the modeling tools. In addition, they use modeling tools because they have features like Organization Mapping and Activity Based Costing that business people find useful, or they provide simulation capabilities that some business analysts find useful. Those same managers tend to reject modeling tools that become overly complex by including features to support process execution or code generation.
Analyzing Your Need for a Modeling Tool
The reality, however, is that even the market for enterprise or process modeling tools is rather complex. To help you evaluate tools to determine if they provide the support you need for your projects, we have created a list of features that a product might have. We describe these features in the next section and use the same ordered list as we evaluate each product and to organize the matrix at the end of the report that summarizes the features of each product.
Detailed Analysis of Modeling Tools
Copyright (c) 2005 Business Process Trends. www.bptrends.com 13
A Detailed Analysis of Enterprise Architecture,
Process Modeling, and Simulation Tools
1. Product Overview
This section considers in some detail the organization and features of the modeling tools included in this report. The tools at the heart of this report are process modeling tools. Companies use these tools to model, analyze, and redesign business processes. Some of these modeling tools include additional capabilities that facilitate the analysis of business or enterprise architectures. Similarly, some of the modeling tools include support for process simulation. At the same time, there are specialized tools designed just for Enterprise Architecture development, and there are tools that are primarily designed to do more sophisticated simulations. Increasingly, however, companies are tending toward tools that model both architectures and processes and also support process simulation.
Rather than speak of Enterprise Architecture, Process Modeling, and Simulation Tools, we will simply refer to the products as Modeling Tools,except in those specific instances when we refer to tools that only exhibit one of the three capabilities.
We will follow the same outline used in this chapter as we consider each specific product. Similarly, we will follow this same sequence in the Matrix when we summarize the features of each product. We will begin each product review by providing an overview that describes the overall organization and packaging of the tool. Many of the products offer entry level and advanced tools and a variety of add-on modules. We will also note which specific functions the tool is primarily designed to fulfill.
2. Product Architecture
2.1. Architecture Overview
The second section of each product review provides an overview of the general architecture of the tool. It examines deployment options for the tool, including availability of desktop and client-server versions. For the most part, vendors are moving to a server model in which end-users interact with the tool’s graphical modeling and analysis components and its repository via a web browser or portal interface. This makes it possible for users to sign on from anywhere in the world and access process models. At the same time, most vendors also provide a desktop environment for developers who enter the basic diagrams or maintain processes in a repository.
2.2. Usability and User Interface
We also consider usability and User Interface (UI) features – including web deployment capabilities and whether a tool is designed to support general business users, the more technical analyst, or both. Support for a variety of users is important because, increasingly, organizations are moving to tools that provide their business users with the ability to model and analyze processes and then distribute and share their models with other users distributed throughout the organization, including other business users as well as technical analysts and IT personnel. Different types of users need different interfaces if they are to derive the maximum use from the tool.
2.3. Repository Options/Team Development
All of the sophisticated modeling tools rely on metamodels that describe a set of objects and relations. These definitions are used to define a repository in which modeling information is maintained. The repository, in turn, is maintained in a database. Some tools have rather narrowly defined metamodels. That means they can only store information about rather specific types of
Detailed Analysis of Modeling Tools
Copyright (c) 2005 Business Process Trends. www.bptrends.com 14
objects and relationships. Other vendors offer very flexible metamodels, in which case the vendor or user can rapidly define new symbols or notations and can store a much broader range of information about architectures or processes.
Vendors support a wide range of options as to which databases can be used to host their repository. Some tools only support one database that is embedded in the tool. Most allow users to use any of several different databases. Some support both relational and object-oriented databases.
Some organizations will want a tool that supports distributed team development. The functionality provided to support this option varies considerably. Some tools provide basic capabilities that allow users to publish models and model information to HTML, thereby allowing other users to access them in read-only format via a Web browser. Other tools provide more sophisticated repository-based features. These include allowing authorized users to share the analysis and design of a process by enabling them to check-out parts of the process from the repository when they want to work on them and check them back in later. Such tools also provide sophisticated versioning and control procedures designed to synchronize model changes and maintain overall model/design integrity. In addition to supporting multi-user team development, some tools also provide remote access capabilities that allow users to store and manage business models and their associated objects remotely via the Internet.
In contrast to more sophisticated repository-based tools, some tools provide more limited capabilities for managing modeling information and supporting team development. These tools employ various file-based systems techniques for multi-user development, such as record locking and project locking. Record locking means that when a specific record (i.e., diagram or other piece of data) within a project is being worked on, no other user can access or modify it; however, the rest of the project file is available for other users to work on. Project locking allows a user to take a project file off-site to work on. In such instances, the tool is either set to disallow access to all other users, or to provide a warning that the project has been “checked out” and provides essential details (i.e., when and by whom the file was check out). Finally, some products rely on third-party configuration management systems (CMS) and repository tools for managing models and associated design information.
2.4. Integration with Other Products
Modeling tool users increasingly want to link their tools with other third-party tools and applications in order to export and import modeling and other information that can be used for project management, publishing and diagramming, software design, and for databases development efforts. Consequently, in addition to providing basic APIs (COM, ODBC, etc.), some vendors also offer pre-built bi-directional interfaces designed specifically for interfacing their modeling tool with popular programs like Microsoft Project, Word, Access, Visio, IBM Rational Rose, or ERwin. In addition, some vendors even offer options for integrating their products with external applications at runtime (for real-time, on-demand simulation, etc.), also providing support for web services and SOAs via Java RMI, SOAP, and other APIs.
3. Analysis and Process Modeling
Section 3 of each review provides a more in-depth look at the actual graphical modeling and analysis capabilities provided by a product. Section 3 is divided into four subsections, which are each, in turn, subdivided. The four basic subsections are
3.1 Defining Enterprise and Organizational Models 3.2 Defining Processes
3.3 Representing/Handling Subprocesses and Activities 3.4 Simulation
Detailed Analysis of Modeling Tools
Copyright (c) 2005 Business Process Trends. www.bptrends.com 15 3.1. Enterprise and Organizational Models
An Enterprise Model is usually a formal model that describes the kinds of information that an organization wants to track. Figure 1, for example, illustrates the Zachman architecture. Zachman defines categories of information and relationships between the various categories. In essence, this provides a company with a way to organize the kinds of information it is going to keep track of as it analyzes its processes and the resources used in those processes. As a generalization, enterprise models are created or maintained by external groups like the DOD or the Zachman Institute, and the vendor simply makes the model or its elements available within the tool. However, many vendors also offer proprietary enterprise models that they have developed as the result of the experience gained by their consulting groups assisting clients with various enterprise architectures and business process initiatives. DATA What (Things) The Zachman Framework FUNCTION How (Process) NETWORK Where (Location) PEOPLE Who (People) TIME When (Time) MOTIVATION Why (Motivation) DETAILED REPRESENTATIONS (Out-of-Context) Sub-Contractor SYSTEM MODEL (Logical) Designer TECHNOLOGY MODEL (Physical) Builder BUSINESS MODEL (Conceptual) Owner FUNCTIONING ENTERPRISE List of Things Important to the Business List of Processes the Business Performs List of Locations in Which the Business Operates List of Organizations Important to the Business List of Events Significant to the Business List of Business Goals/Strategies Semantic Model Work Flow Model Master Schedule Business Plan Human Interface Architecture Processing
Structure Business RuleModel
System
Design ArchitecturePresentation
Control
Structure DesignRule
Program ArchitectureSecurity DefinitionTiming SpecificationRule
Actual Application Code Actual Business Organization Acutal Business Schedule Actual Business Strategy Business Process Model Application Architecture Logical Data Model Physical Data Model Data Definition Actual Business Data Actual Physical Networks Network Architecture Technology Architecture Distributed System Architecture Business Logistics System SCOPE (Contextual) Planner Abstractions (Columns) P ersp ect ives ( R o w s)
Figure 1. The Zachman Enterprise Architecture.
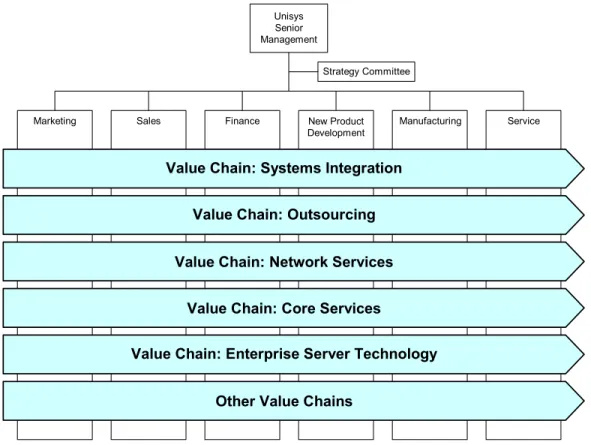
An Organization Model is a more informal model developed to picture how a company is organized. One popular organization model shows departments and value chains to illustrate which departments are responsible for which aspects of specific processes. A company may create an organization model to better understand its operations, or it may create it to serve as a way of organizing the information it is going to track and store. Figure 2 provides an example of an Organization Model. Organization models are often specified by process methodologies, but are informal and developed on a company by company basis. Thus, tools support organization models by providing a modeling notation that can be used to create an organization model.
In section 3.1 we begin by examining how different products support different enterprise architecture models. Many tools, for example provide diagrams that reflect popular architecture and let users organize their repository and diagrams in the categories provided by the specific architecture.
Detailed Analysis of Modeling Tools
Copyright (c) 2005 Business Process Trends. www.bptrends.com 16
We also consider how tools support modeling company organizational structures and relating processes to organizational units. And we look at each tool’s ability to document performance strategies and goals, and the ability to model resources and define usage patterns for their usage. Finally, this section considers a tool’s features for managing process portfolios. These topics are described in detail in the subsections of 3.1.
Unisys Senior Management
Marketing Sales Finance New Product Manufacturing Service Development
Strategy Committee
Value Chain: Systems Integration Value Chain: Outsourcing Value Chain: Network Services
Value Chain: Core Services
Value Chain: Enterprise Server Technology Other Value Chains
Figure 2. An Organization Model Picturing Unisys Value Chains. Enterprise Architecture Models
In 3.1.1 we describe the specific enterprise architecture models supported by the modeling tool. Some of the more popular architectures include Zachman, Enterprise Architecture, TOGAF, and DoDAF. In addition, as noted previously, many vendors also offer their own proprietary enterprise models for use with their tools. Finally, we also consider how some vendors provide organizations with the ability to customize their products to support their specific enterprise architecture modeling needs.
Organizational Models
To varying degrees, modeling tools provide the ability to create models that graphically depict organizational structures and to relate various processes to different organizational units. Some tools provide the ability to create complex, hierarchically structured organizational models that graphically depict how organizations report to other organizations and how specific roles report to organizations. In addition, some tools can relate processes to organizational units through the use of swim lanes and other techniques in a workflow model. Swim lanes graphically depict who or what (e.g., an organization, a system, a specifically defined role, etc.) is responsible for specific activities. The swim lane paradigm is a popular one because it tends to be easily understood by most of the business community.
Detailed Analysis of Modeling Tools
Copyright (c) 2005 Business Process Trends. www.bptrends.com 17
Resource and Cost Modeling
Here we examine the ability of a tool to support modeling a range of resource categories, including equipment, systems, people, roles, consumables, facilities, services, organizations, and so on. We also consider capabilities for enabling end-users to capture information and data related to these resources, as well as the tool’s ability to be used to define resources with such criteria as cost, schedules, and usage patterns.
Mapping Organizational Strategies to Processes/Performance Measures
In section 3.1.4, we examine a tool’s ability to support the documentation of performance strategies and goals as well as features for mapping or associating performance strategies and goals to a process activity. Such mapping capabilities are useful because they can be used to help define the traceability of relationships – for example, goals to activities, or systems to roles, etc.
Managing Process Portfolios
This section considers product features for actively managing a portfolio of processes. For example, some tools provide facilities that allow users to partition the repository with portfolios and manage and maintain models via a portal or Web interface. Other products are designed to work with third party Configuration Management Systems (CMS) or repository tools.
3.2. Defining Processes
Section 3.2 examines the way modeling tools allow users to define processes and how a tool stores information about processes and what mechanisms are used to support and enforce process integrity. It also examines which graphic notations a product supports and the ability to create tailored notations.
Defining Processes
Modeling tools vary in the capabilities they provide for graphically describing and modeling an organization, enterprise architecture, processes within an organization, or processes that span multiple organizations. In addition, some tools provide the ability for users to build models textually by translating Word or Excel programs into graphical models.
Process Information Storage and Integrity
Most tools store process information in a database or repository, and the mechanisms employed to support and enforce model/process integrity can vary. Some tools provide model/process consistency through their pre-defined modeling languages, which include controls for enforcing model and object behavior. Some tools also provide additional utilities in the form of spelling, completeness, and semantic checkers for further ensuring model/process integrity – for example, to verify models for compliance with certain rules to ensure that the business processes are mapped logically and meaningfully and/or according to a specific business process methodology.
Graphical Notations
All the leading modeling tools employ some form of graphical notation and suggest some methodology to support process analysis, process improvement, or process redesign efforts. Most vendors’ tools use proprietary notations. Some support commercial or standard notations. The most popular include Enterprise Architecture, Information Engineering, Rummler-Brache, IDEF, UML Activity Diagrams, and the Business Process Modeling Notation (BPMN). In addition, some vendors also provide the ability for organizations to customize notations to support their specific modeling needs.
The Business Process Modeling Notation (BPMN) was recently created by the BPMI organization. It is designed to facilitate the graphical representation of business processes. Specifically, BPMN is designed so that a user can use a BPMN diagram to generate BPEL code. This would standardize the approach that many BPM Suites vendors are taking. Modeling tools that support BPMN make it easy for users to move from a model created in one tool to a BPM Suite that runs BPEL. It is too
Detailed Analysis of Modeling Tools
Copyright (c) 2005 Business Process Trends. www.bptrends.com 18
early to determine how popular BPMN will become, but some modeling vendors are embracing the notation because of the widespread interest in BPM among some customers.
BPMN comes in two versions, a simple version that business managers can use and a more sophisticated version that provides all the details needed to generate software code. Companies that use tools that support BPMN are, in effect, using a tool that both business managers and IT developers can use to coordinate the move from an informal workflow diagram to a detailed specification that a BPM Suite could execute to manage an ongoing process. (See Figure 3.)
Initial versions of the Object Management Group’s (OMG) Unified Modeling Language (UML 1.0, 1.1) were primarily used by software developers for process automation efforts. UML was never very popular with business users. The OMG’s latest release of their modeling standard, UML 2.0, represents a major redesign of the language and includes a much improved Activity Diagram notation which has generated a lot of interest in organizations that use UML for software development. In essence, as with BPMN, if the business modelers use UML Activity Diagrams they can be passed to IT developers who can then use those diagrams as the starting point for software development.
The OMG is also working on a business process metamodel which will facilitate translating one model into another. Thus, companies using UML Activity Diagrams can later convert them to BPEL or to Java.
UML Activity Diagrams and basic BPMN diagrams are very similar, and it is possible they will be combined or linked in the near future. No matter what happens, the similarity between BPMN and UML Activity Diagrams suggests that in the near future business modeling tools will be shifting away from their various proprietary notations to one of the standard, public notations.
3.3. Subprocesses and Activities
This section examines the capabilities of a modeling tool to represent and manipulate subprocesses. It also examines how end-users define activities and enter and document decision rules, and the ability of a tool to store data related to cost, resources, and time required by specific activities.
Subprocesses and Activities
Most products incorporate the ability to handle subprocesses as part of the overall process model. Precisely how this is done can vary considerably among products. Some tools allow for nesting of subprocesses within processes. Some tools do not allow for nested subprocesses. The capability to nest models can be useful because it provides the ability to drill down from the parent level and obtain a more granular visualization of a process. If a company wants to develop value chain models and use them to see which specific processes are used in which value chains, nested subprocesses can be very useful.
Defining Activities
A process is any sequence of steps that is initiated by an event; transforms information, materials, or business commitments; and produces an output. Most metamodels and notation systems use the term activity as the smallest unit of a process that is normally pictured on a graphical diagram. (Some methodologists prefer step or task, but we will use activity.) Thus activities usually define a unit of work that is performed by one or a group of employees following the same procedure, or by a single software module. Although methods for doing so vary among products, most tools allow end-users to associate information about an activity with the activity pictured in the diagram – for example, resources used by the activity and any steps that take place during the performance of the activity – and then to store the information in the tool’s repository.
Documenting Decision Rules
Some activities are well-defined procedures, while others involve the application of rules and decisions. An example of a possible decision rule is
Detailed Analysis of Modeling Tools
Copyright (c) 2005 Business Process Trends. www.bptrends.com 19 No expense report is processed before supporting documentation arrives.
Similarly, some decision points on diagrams are straightforward, while others require the application of rules just to determine to whom the work should go next.
The ability to associate rules with activities or decision points within a process is an important feature of any modeling tool because it allows end-users to define activities and processes specifically and accurately. .
Rules Entry
Most tools allow users to enter decision rules through a dialog box that provides the ability to define a rule and customize its individual properties. Some tools also allow users to enter rules textually.
Activity Costs, Resources, and Time Data
Most modeling tools allow end-users to associate data about costs, resources, and processing times with specific activities. This information is then stored in the tool’s repository. However, methods for capturing this information vary among products. Some products allow each activity in a process to contain its own cost, timing, and resource information. In effect, this information is tied directly to each activity, and it can be used for various purposes – for example, conducting simulations for different scenarios.
In other tools, costs are associated with the resources used and are stored as parameters of the resources themselves. The parameters of the activity include the resources required to perform the step, as well as the duration necessary to complete it.
3.4. Simulation
This section examines the ability of a modeling product to support simulation of processes as well as capabilities for analyzing simulations. It also considers the use of real-time data feeds for simulation, and interaction of simulations, with operational systems, and the ability to distribute simulations across a network. Finally, it examines a tool’s ability to capture and report on simulated metrics and its ability to apply statistical analysis to simulation data.
Computer-based simulation requires an engine to drive the calculation of model variables. The two methods for doing simulation are
• Systems Analysis – continuous and discrete simulations based on mathematical models and numerical methods.
• Discrete Event – discrete simulations based on an event-handling method.
Systems Analysis-based simulation is mostly associated with academic studies. Discrete Event simulation, on the other hand, is easily driven by the events that are generated in a business process. Thus, the completion of an application, the entry of the application into a database, the approval of funding for the application are all events. Process simulation tools are designed to track the events that occur during the execution of a process. To use a simulation system, the process modeler has to specify what happens when an event occurs. For example, how long does it take to approve an application? Is this a task that one person can accomplish in 15 minutes? How much does the time of that person cost? What resources are used in the approval process? How many minutes elapse between when an application is approved and when it is taken up by the person whose task it is to implement the funding decision? And so forth. To do simulation, you need a process modeling tool that allows you to store information about each activity. You also need to store rules to deal with more complex decisions.
With simpler simulation tools, you submit a set of case data (scenarios) and watch how the process handles the cases. Most tools allow you to track the time each work item remains at each point in the process, where bottlenecks occur, and what the cost would be per item of processing 100 items a
Detailed Analysis of Modeling Tools
Copyright (c) 2005 Business Process Trends. www.bptrends.com 20
week, compared to the cost of processing 1000 items. Information like this can be very useful in deciding if a new process design will be as efficient as you hope.
Unfortunately, the data required and the decisions that must be made to set up a good simulation of a process are not trivial. Large systems are best simulated by creating a model with only key activities. But what are the key activities to model? And what statistical measures work best with different flow patterns? Experienced simulation practitioners have learned these things and can make the decisions quickly. Less experienced practitioners often make bad decisions and quickly find themselves making a much larger commitment than they expected. It is hard to simplify simulation tools too much. Thus, although many process modeling tools provide simulation engines, only a few of their customers actually use the simulation capabilities. On the other hands, individuals experienced enough to do good simulations often prefer more sophisticated simulation tools that give them more flexibility. Thus, although most process modeling products offer simulation, a few are especially popular with those who are experienced at simulation.
The most sophisticated simulation products can not only run sets of cases (scenarios) but can also monitor a system while it is being executed. To monitor a process while it is being executed, the product has to be designed to collect real-time data on an ongoing basis. And this, in turn, makes the tool more like some of the BPM Suites that manage and monitor process execution with less resemblance to most of the process modeling tools considered in this report.
Simulation Capabilities
Most modeling tools provide some form of simulation capabilities, either as part of the tool or as an available, separate add-on module. The most popular technique is Discrete Event simulation. Discrete Event allows users to introduce a higher level of precision into the simulation process because it provides the ability to simulate the model of a business process as it evolves over time, with the passage of time tracked as a series of discrete events rather than as a continuous transformation.
Analytic Capabilities
Analytic features vary among products. This section examines a product’s ability to allow end-users to define multiple business case scenarios and perform process simulation to measure and analyze time, costs, resources, throughput, capacity, and bottlenecks, and associated activities. Such analyses are useful for visualizing and validating processes, uncovering problems, analyzing system states, and defining organizational responsibilities. They are also useful for designing and testing improvements pertaining to resource allocations and other scenarios.
In addition to the general simulation capabilities described above, some tools also include animation. This feature enables users to view an animation of a simulation as it runs in order to watch a business process execute step by step. It also lets you record animations for later playback. When playing back recorded animations, the user can pause, fast forward, and rewind the animation, which makes it a very powerful tool for analyzing business processes.
Finally, most tools offer the ability to export information and data captured during simulation to Excel and other programs in order to take advantage of their analysis and reporting capabilities.
Real-time Data Utilization
Some products provide capabilities in the form of APIs, Web Services (SOAP, etc.), and other interfaces, enabling them to read data in real-time from operational systems and databases for use by a simulation engine. Such functionality is useful for testing and evaluating new process scenarios. Costs data, entity generation, and resource levels are just some of the ways you can use real-time data with simulation engines.