INTERNATIONAL RESEARCH JOURNAL OF MULTIDISCIPLINARY STUDIES SPECIAL ISSUE ON ADVANCEMENT IN FIELD OF COMPUTER SCIENCE AND
INFORMATION TECHNOLOGY
Vol. 4, Special Issue 8, February, 2018 ISSN (Online): 2454-8499 Impact Factor: 1.3599(GIF), 0.679(IIFS)
Web: www.irjms.in Email: [email protected], [email protected] Page No: 1
Analysis of Students Performance for Remedial Teaching: Data Mining
Techniques
1
Ms. Katkar Reshma Jayavant, 2Ms. Kale Rupali Ajitkumar, 3Mr. Lakhdive S. G. 1,2,3
Asst. Professor, Department of Computer Science, Prof. Ramakrishna More ACS College, Akurdi, Pune-44
Abstract—To provide the quality education to the students it is need to improve the students
performance by identifying the slow learners students by providing Remedial Teaching to them. The educational database contains the hidden information which is used to extract the knowledge through Data Mining Techniques.
Knowledge Discovery in Databases (KDD) is a multistep process use for extracting the useful knowledge from data. This knowledge can be used to improve the performance of the student. In this research paper different data mining techniques like Decision Trees, Naive Bayes and Neural Networks are used to evaluate the student performance.
By this task we extract the knowledge that describe the student performance which helps earlier in identifying the dropouts and the students who need the special attention to allow teacher to provide appropriate advising and counseling.
Keywords: Data Mining, Educational Data, Decision Trees, Neural Networks, Naive Bayes 1. Introduction
Assessment of students plays an important role in teaching and learning. By means of assessment, remedial teachers can know learning progress as well as strengths and weaknesses of students; hence they may design different teaching activities accordingly to help students to learn in an effective manner.
Thus, it is necessary to predict the Student’s performance. It helps to identify dropouts and slow learners students to whom remedial teaching can be provided.
2. Background and Related Work
There are number of research papers discussing various problems within the education sector and providing examples for successful solutions reached by using data mining.
Ali Daud et al [8] have present the student academic prediction methods based on family expenditure, family income, student personal information and family assets. The study is applied on 3000 student in the university. SVM classifier is used to classify student based on family expenditure and student personal information. They conclude that family expenditure and personal information features have significant impact on the performance of the student.
M.S. Mythili et al [9] analyze and evaluate the school students’ performance by applying data mining classification algorithms in WEKA. The dataset contain the 260 samples of different school. They apply the classification algorithms J48, Random Forest, Multilayer Perceptron, IB1 and Decision Table. They conclude that Random Forest performance is better than other algorithms.
INTERNATIONAL RESEARCH JOURNAL OF MULTIDISCIPLINARY STUDIES SPECIAL ISSUE ON ADVANCEMENT IN FIELD OF COMPUTER SCIENCE AND
INFORMATION TECHNOLOGY
Vol. 4, Special Issue 8, February, 2018 ISSN (Online): 2454-8499 Impact Factor: 1.3599(GIF), 0.679(IIFS)
Web: www.irjms.in Email: [email protected], [email protected] Page No: 2 Karunendra Verma et el [10] discussed in their review paper classifier used in WEKA such as
common decision tree algorithm C4.5 (J48), two Bayesian classifiers (NaiveBayes and BayesNet), a Nearest Neighbour algorithm (IBk) and two rule learners (OneR and JRip).
Dorina Kabakchieva [11] attempted to predict student performance based on student personal and administrative data such as percentage and grade of previous education and so on. The study was conducted on dataset of 10330 students with 20 parameters. The classification models used are OneR Rule Learner, Decision Tree, Neural Network and K-Nearest Neighbor. It concludes that the Neural Network model predicts with higher accuracy.
3. Data Mining Definition
Data mining is defined as a process used to extract usable data from a larger set of any raw data. It implies analyzing data patterns in large batches of data using one or more software. Data mining has applications in multiple fields, like science and research. Data mining involves effective data collection and warehousing as well as computer processing. For segmenting the data and evaluating the probability of future events, data mining uses sophisticated mathematical algorithms. 4. Data Mining Process:
Data mining is also known as Knowledge Discovery in Data (KDD). In order to apply classification techniques following key steps are perform.
i) Data Preparation
The data set used in this study was obtained from our college in computer science department for S. Y. B. Sc (Computer Science) students in the year 2016-17. Dataset contains 65 records.
ii) Data Selection and Transformation
In this step only those fields were selected which were required for data mining. A few derived variables were selected.
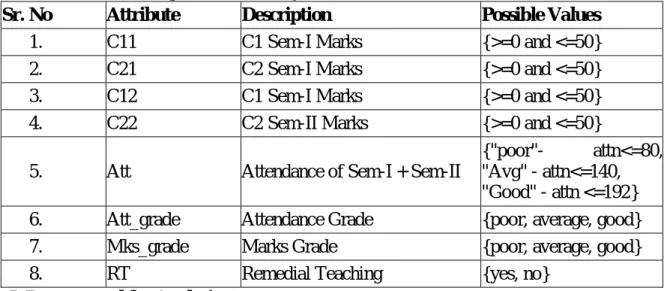
Table I describes the attributes of the data and their possible values. This data is analyzed using classification method to predict the performance of the student. In the data set we considered both semester marks for computer science subject and attendance of a student.
Sr. No Attribute Description Possible Values
1. C11 C1 Sem-I Marks {>=0 and <=50} 2. C21 C2 Sem-I Marks {>=0 and <=50} 3. C12 C1 Sem-I Marks {>=0 and <=50} 4. C22 C2 Sem-II Marks {>=0 and <=50} 5. Att Attendance of Sem-I + Sem-II
{"poor"- attn<=80, "Avg" - attn<=140,
"Good" - attn <=192} 6. Att_grade Attendance Grade {poor, average, good} 7. Mks_grade Marks Grade {poor, average, good} 8. RT Remedial Teaching {yes, no}
Table I. Dataset used for Analysis iii) Implementation of Mining Model
Classification is one of the mostly used and studied data mining techniques. Classification is a technique for predicting a data object’s class or category based on previously learned classes from a
INTERNATIONAL RESEARCH JOURNAL OF MULTIDISCIPLINARY STUDIES SPECIAL ISSUE ON ADVANCEMENT IN FIELD OF COMPUTER SCIENCE AND
INFORMATION TECHNOLOGY
Vol. 4, Special Issue 8, February, 2018 ISSN (Online): 2454-8499 Impact Factor: 1.3599(GIF), 0.679(IIFS)
Web: www.irjms.in Email: [email protected], [email protected] Page No: 3 training dataset, where the classes of the objects are known. There are multiple classification
techniques available in data mining, such as, Decision Trees, K-Nearest Neighbor (K-NN), Neural Networks, Naïve Bayes, etc.
In this study, multiple classification techniques were used in the data mining process for predicting the slow learner students for remedial teaching.
All data mining implementation and processing in this study was done using WEKA
WEKA is open source software that implements a large collection of machine leaning algorithms and is widely used in data mining applications [2]. From the above data, sy_dataset.csv file was created. This file was loaded into WEKA explorer. The classify panel enables the user to apply classification algorithms to the resulting dataset, to estimate the accuracy of the resulting predictive model, and to visualize erroneous predictions, or the model itself.
There is multiple classification algorithms like Decision Trees, Neural Networks, Naïve Bayes etc. implemented in WEKA. The algorithm used for classification is implemented under the “training dataset” in Test options. These predictive models provide ways to predict whether a student will eligible for remedial teaching or not.
The three data mining classification techniques i.e. Netural Networks, Decision Tree, Naive Bayes are used to analyze the dataset.
i) Decision Trees
A decision tree is a flowchart-like tree structure, where each internal node (non-leaf node) denotes a test on an attribute, each branch represents an outcome of the test, and each leaf node (or terminal node) holds a class label. The topmost node in a tree is the root node.
Internal nodes are denoted by rectangles, and leaf nodes are denoted by ovals. Some decision tree algorithms produce only binary trees (where each internal node branches to exactly two other nodes), whereas others can produce non-binary trees.
There are many popular decision tree algorithms like CART, ID3, C4.5, CHAID and J48. From this J48 algorithm is used. J48 algorithm uses pruning method to build a tree. Pruning is a technique that reduces size of tree by removing over fitting data, which leads to poor accuracy in predications. The J48 algorithm recursively classifies data until it has been categorized as perfectly as possible. [4] “How decision trees are used for classification?”
Given a tuple, X, for which the associated class label is unknown, the attribute values of the tuple are tested against the decision tree. A path is traced from the root to a leaf node, which holds the class prediction for that tuple. Decision trees can easily be converted to classification rules.
ii)Naïve Bayes
Bayesian classifiers are statistical classifiers. They can predict class membership probabilities such as the probability that a given tuple belongs to a particular class. Bayesian classification is based on Bayes’ theorem.
Naive Bayesian classifiers assume that the effect of an attribute value on a given class is independent of the values of the other attributes. This assumption is called class conditional independence. It is made to simplify the computations involved and, in this sense, is considered “naive.”
The Bayes theorem is as follows: Let X={x1, x2, ..., xn} be a set of n attributes. In Bayesian, X is considered as evidence and H be some hypothesis means, the data of X belongs to specific class C. We
INTERNATIONAL RESEARCH JOURNAL OF MULTIDISCIPLINARY STUDIES SPECIAL ISSUE ON ADVANCEMENT IN FIELD OF COMPUTER SCIENCE AND
INFORMATION TECHNOLOGY
Vol. 4, Special Issue 8, February, 2018 ISSN (Online): 2454-8499 Impact Factor: 1.3599(GIF), 0.679(IIFS)
Web: www.irjms.in Email: [email protected], [email protected] Page No: 4 have to determine P (H|X), the probability that the hypothesis H holds given evidence i.e. data sample
X. According to Bayes theorem the P (H|X) is expressed as P (H|X) = P (X| H) P (H) / P (X) iii) Neural Networks
An artificial neural network (ANN), often just called a "neural network" (NN), is a mathematical model or computational model based on biological neural network. In other words, it is an emulation of biological neural system [5]. A Multi-layer Perceptron Neural Networks (MLPNN) is used.
It maps a set of input data onto a set of appropriate output data. It consists of 3 layers input layer, hidden layer & output layer. There is connection between each layer & weights are assigned to each connection. The primary function of neurons of input layer is to divide input xi into neurons in hidden layer. Neuron of hidden layer adds input signal Xi with weights Wji of respective connections from input layer. The output Yj is function of
Yj = f (∑ Wji Xi)
Where f is a simple threshold function such as sigmoid 5. Experiment and Results:
The three data mining classification techniques are applied on the student data set namely Netural Networks, Decision Tree, and Naive Bayes. These techniques are used to analyze the result. The dataset consists of total 65 records. The data mining tool Weka3.8 is used for experiment.
Manual result for the prediction of student eligible for remedial teaching or not is based on following rule set.
SN.Rules for class prediction
1. IF Att_grade=”poor” AND Mks_grade=”poor” THEN RT=”yes” 2. IF Att_grade=”poor” AND Mks_grade=”average” THEN RT=”no” 3. IF Att_grade=”poor” AND Mks_grade=”good” THEN RT=”no” 4. IF Att_grade=”average” AND Mks_grade=”Poor” THEN RT=”yes” 5. IF Att_grade=”average” AND Mks_grade=”average” THEN RT=”no” 6. IF Att_grade=”average” AND Mks_grade=”good” THEN RT=”no” 7. IF Att_grade=”good” AND Mks_grade=”poor” THEN RT=”yes” 8. IF Att_grade=”good” AND Mks_grade=”average” THEN RT=”no” 9. IF Att_grade=”good” AND Mks_grade=”good” THEN RT=”no”
A confusion matrix is obtained to calculate the accuracy of classification. A confusion matrix shows how many instances have been assigned to each class. In our experiment we have two classes and therefore we have a 2x2 confusion matrix.
Class A = No (No Remedial Teaching to student) Class B = Yes (Remedial Teaching to student)
A (No Remedial Teaching to student) B (Remedial Teaching to student) A (No Remedial Teaching to student) TP FN B (Remedial Teaching to student) FP TN Table –II A Confusion Matrix
INTERNATIONAL RESEARCH JOURNAL OF MULTIDISCIPLINARY STUDIES SPECIAL ISSUE ON ADVANCEMENT IN FIELD OF COMPUTER SCIENCE AND
INFORMATION TECHNOLOGY
Vol. 4, Special Issue 8, February, 2018 ISSN (Online): 2454-8499 Impact Factor: 1.3599(GIF), 0.679(IIFS)
Web: www.irjms.in Email: [email protected], [email protected] Page No: 5 FN (False Negative): It denotes the number of records classified as false while they were actually
true.
FP (False Positive): It denotes the number of records classified as true while they were actually False TN (True Negative): It denotes the number of records classified as false while they were actually False
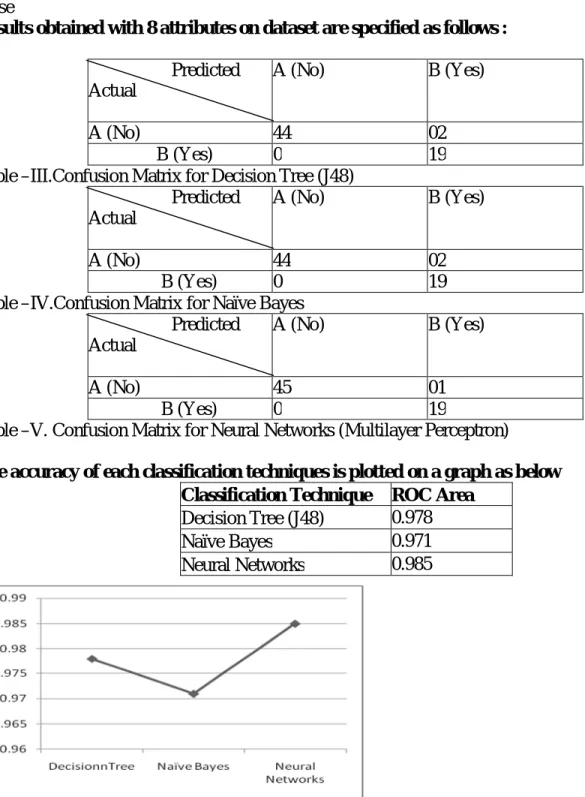
Results obtained with 8 attributes on dataset are specified as follows : Predicted
Actual
A (No) B (Yes)
A (No) 44 02
B (Yes) 0 19 Table –III.Confusion Matrix for Decision Tree (J48)
Predicted Actual
A (No) B (Yes)
A (No) 44 02
B (Yes) 0 19 Table –IV.Confusion Matrix for Naïve Bayes
Predicted Actual
A (No) B (Yes)
A (No) 45 01
B (Yes) 0 19
Table –V. Confusion Matrix for Neural Networks (Multilayer Perceptron)
The accuracy of each classification techniques is plotted on a graph as below
Figure 1: Graphical Representation of Accuracy for three classification Techniques. Classification Technique ROC Area
Decision Tree (J48) 0.978 Naïve Bayes 0.971 Neural Networks 0.985
INTERNATIONAL RESEARCH JOURNAL OF MULTIDISCIPLINARY STUDIES SPECIAL ISSUE ON ADVANCEMENT IN FIELD OF COMPUTER SCIENCE AND
INFORMATION TECHNOLOGY
Vol. 4, Special Issue 8, February, 2018 ISSN (Online): 2454-8499 Impact Factor: 1.3599(GIF), 0.679(IIFS)
Web: www.irjms.in Email: [email protected], [email protected] Page No: 6 6. Conclusion
In the current study, three data mining classification techniques were applied namely decision trees, naïve bayes and neural networks. It was also found that the student’s performance is not totally dependent on their marks and class attendance, in spite, there are many other factors like the locality (Rural, Urban), Friend Circle, Parent education and so on influences the result. From these three results it has been observed that neural networks provide accurate results as compared to others.
7. Future Work:
Using Association rule in mining we can find different relationship among the attributes and predict the student performance. Comparison can be done with the earlier results to check whether accuracy is increased.
REFERENCES
[1] Data Mining: Concepts and Techniques, Han, Elsevier ISBN: 9789380931913,3rd edition
[2] Q. A. AI-Radaideh, E. W. AI-Shawakfa, and M. I. AI-Najjar, “Mining student data using decision trees”, International Arab Conference on Information Technology (ACIT'2006), Yarmouk University, Jordan, 2006.
[3] Chaitrali S. Dangare , Sulabha S. Apte “Improved Study of Heart Disease Prediction System using Data Mining Classification Techniques” International Journal of Computer Applications (0975 – 888) Volume 47– No.10, June 2012
[4] Dr. Yashpal Singh, Alok Singh chauhan “Neural Networks in data mining” Journal of Theoretical and Applied Information Technology , 2005 - 2009 JATIT
[5] S. T. Hijazi, and R. S. M. M. Naqvi, “Factors affecting student’s performance: A Case of Private Colleges”, Bangladesh e-Journal of Sociology, Vol. 3, No. 1, 2006.
[6] Q. A. AI-Radaideh, E. W. AI-Shawakfa, and M. I. AI-Najjar, “Mining student data using decision trees”, International Arab Conference on Information Technology (ACIT'2006), Yarmouk University, Jordan, 2006
[7] B.K. Bharadwaj and S. Pal. “Data Mining: A prediction for performance improvement using classification”, International Journal of Computer Science and Information Security (IJCSIS), Vol. 9, No. 4, pp. 136-140, 2011.
[8] Ali Daud , Naif Radi Aljohani, Rabeeh Ayaz Abbasi , Miltiadis D. Lytras ,Farhat Abbas , Jalal S. Alowibdi “Predicting Student Performance using Advanced Learning Analytics” International World Wide Web Conference Committee (IW3C2), published under Creative Commons CC BY 4.0 License. WWW 2017 Companion, April 3-7, 2017, Perth, Australia.
[9] Mrs. M.S. Mythili , Dr. A.R.Mohamed Shanavas “An Analysis of students’ performance using classification algorithms” IOSR Journal of Computer Engineering (IOSR-JCE) e-ISSN: 2278-0661, p- ISSN: 2278-8727Volume 16, Issue 1, Ver. III (Jan. 2014), PP 63-69
[10] Karunendra Verma1, Arjun Singh2, Purushottam Verma3 “A Review On Predicting Student Performance Using Data Mining Method” International Journal Of Current Engineering And Scientific Research (Ijcesr) Issn (Print): 2393-8374, (Online): 2394-0697, Volume-3, Issue-1, 2016
[11] Dorina Kabakchieva “Student Performance Prediction by Using Data Mining Classification Algorithms” International Journal of Computer Science and Management Research Vol 1 Issue 4 November 2012 ISSN 2278-733X