AN EXAMIMATION OF THE IMPACT OF A FIRST YEAR
EXPERIENCE COURSE ON STEM PERSISTENCE
A DISSERTATION IN
Urban Leadership and Policy Studies in Education
and
Curriculum and Instruction
Presented to the Faculty of the University of Missouri-Kansas City in partial fulfillment of
the requirements for the degree
DOCTOR OF PHILOSOPHY
by
TAMMY S. WELCHERT
B.S., Southwest Missouri State University, 1997 Ed.Sp., University of Missouri-Kansas City, 2003
M.S., Missouri State University, 2006
Kansas City, Missouri 2015
iii
AN EXAMIMATION OF THE IMPACT OF A FIRST YEAR
EXPERIENCE COURSE ON STEM PERSISTENCE
Tammy S. Welchert, Candidate for the Doctor of Philosophy
University of Missouri-Kansas City, 2015
ABSTRACT
A review of STEM literature indicates that increased attention is being paid to STEM
initiatives particularly with K-12 teachers and programs designed to foster interest in
STEM fields at the secondary education level, both of which feed the STEM pipeline.
The President of the United States, Barack Obama, Presidents of Higher Education
Institutions, and an increased global awareness of the shortfall of workers in the STEM
pipeline are driving the increased attention. Recognition that an inability to meet STEM
workforce demands may jeopardize the position of the United States as a world leader is
significant. The purpose of this study was to examine the impact of a first year
experience course, Biology 115: First Year Seminar, specifically with regards to
academic performance and retention, and to evaluate how the impact changes when
course instruction was delivered in a 16-week versus an 8-week model. Three sample
groups (N = 596) consisting of first time college freshmen declared as biology majors
iv
participation. Data was collected from student’s high school and college transcripts and
college applications by the Office of Institutional Research. A three phase analysis
including descriptive statistics and t-tests, principle component analysis, and binary
logistic regression were performed using a hierarchical model informed by Alexander
Astins’ Input-Environment-Output model. The majority of students were female,
residents of the State of Missouri, and White. Analysis results indicated that students
enrolled in the Biology 115 course earned higher grade point averages, were in better
academic standing, and were retained at a higher level than the control group.
Additionally, students enrolled in the course in the 8-Week model earned higher grade
point averages and had higher retention from Year 1 to Year 2 and retention as biology
v
The faculty listed below, appointed by the Dean of the School of Graduate Studies have
examined a dissertation titled “An Examination of the Impact of a First Year
Experience Course on STEM Persistence,” presented by Tammy S. Welchert, candidate
for the Doctor of Philosophy, and certify that in their opinion it is worthy of acceptance.
Supervisory Committee
Carolyn J. Thompson, Ph.D., Committee Chair School of Education
Department of Education Leadership, Policy & Foundations
Loyce E. Caruthers, Ph.D. School of Education
Department of Education Leadership, Policy & Foundations
Malcom E. Linville, Ph.D. School of Education
Department of Curriculum and Instruction Leadership
Rita S. Barger, Ph.D. School of Education
Department of Curriculum and Instruction Leadership
Marilyn Yoder, Ph.D. School of Biological Sciences Department of Cell Biology and Biophysics
vi CONTENTS ABSTRACT ... iii LIST OF ILLUSTRATIONS ... ix LIST OF TABLES ... x Chapter 1. INTRODUCTION ... 1
Statement of the Problem ... 2
Theoretical Basis of the Study ... 6
Purpose of the Study ... 10
Research Questions ... 11
Hypothesis ... 10
Significance of the Study ... 12
Definition of Terms ... 10
Limitations ... 10
Organization of the Remaining Chapters ... 13
2. LITERATURE REVIEW ... 18
Science, Technology, Engineering, and Mathematics (STEM)... 19
vii
Women and Students of Color in the STEM Pipeline ... 48
Theoretical Framework ... 62 Conceptual Framework ... 75 3. METHODOLOGY ... 79 Research Design ... 80 Data Collection ... 83 Sample ... 84 Variables ... 93 Data Analysis ... 115 4. ANALYSIS ... 140 Data ... 141 Analysis ... 148 Conclusion ... 208 5. DISCUSSION ... 210 Summary ... 210
Implications for Policy... 221
viii
Suggestions for Future Research ... 226
Appendix
A. Principle Component Analysis Control Sample Pre-College Variable Correlation Matrix ... 229
B. Principle Component Analysis Control Sample Pre-College Variable Correlation Matrix ... 230
C. Principle Component Analysis Control Sample Pre-College Variable Correlation Matrix ... 231
D. Principle Component Analysis Control Sample Pre-College Variable Correlation Matrix ... 232
E. Principle Component Analysis Control Sample Pre-College Variable Correlation Matrix ... 233
F. Principle Component Analysis Control Sample Pre-College Variable Correlation Matrix ... 234
G. Principle Component Analysis Control Sample Pre-College Variable Correlation Matrix ... 235
H. Principle Component Analysis Control Sample Pre-College Variable Correlation Matrix ... 236
I. Principle Component Analysis Control Sample Pre-College Variable Correlation Matrix ... 237
REFERENCE LIST ... 238
ix
ILLUSTRATIONS
Figure Page
1. Predictors of Persistence based on Tinto with Expansions by Astin, Bean, Stoecker, Pascarella, Wolfe, Willimason, and Creamer ... 71
2. Principle Component Analysis Inclusion Criteria ... 160
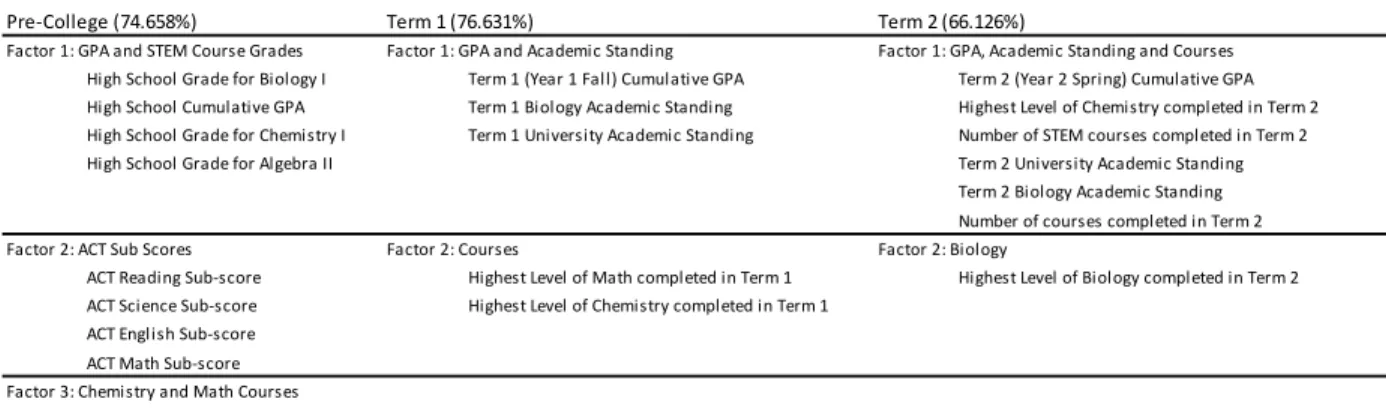
3. Principle Component Analysis Control Sample Extracted Factors
With Percent Variance ... 168
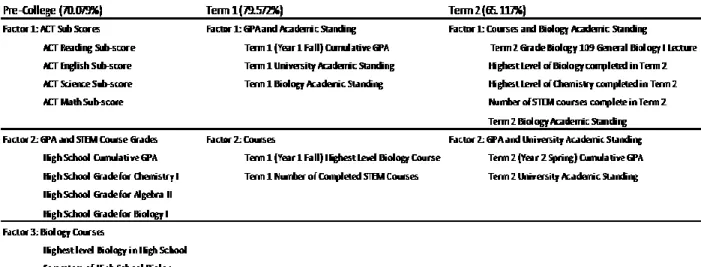
4. Principle Component Analysis 16-Week Sample Extracted Factors
With Percent Variance ... 175
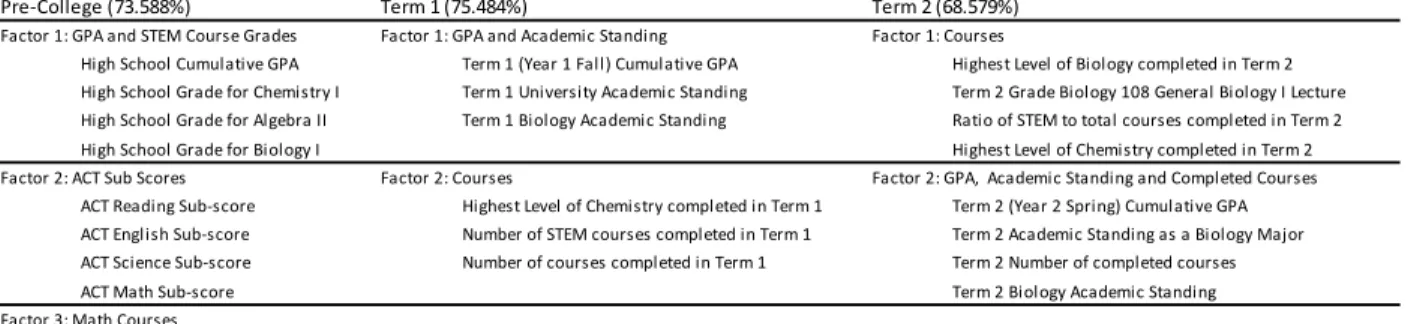
5. Principle Component Analysis 8-Week Sample Extracted Factors
With Percent Variance ... 182
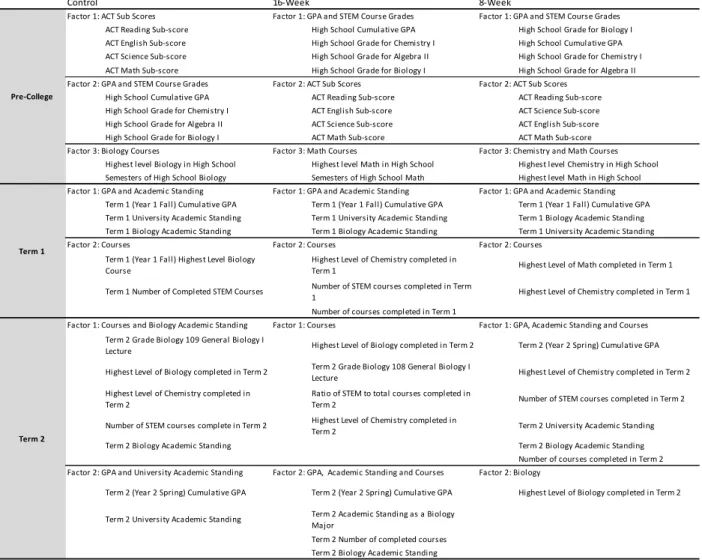
6. Comparison of Extracted Factors resulting from Principle Component Analysis of the Control, 16-Week, and 8-Week
x TABLES
Table Page
1. Percentage of Students to Achieve Math Proficiency in
4th and 8th Grades in the Years 2000, 2005, and 2009 ... 31
2. Carnegie Classification details of the University of Missouri-Kansas City ... 82
3. Research Question One Sample Group Selection Criteria ... 85
4. Research Question One Control Group Selection Criteria ... 88
5. Research Question Two Sample Group Selection Criteria ... 90
6. Research Question Two Control Group Selection Criteria ... 92
7. Input, Environment, and Output Variables for Analysis ... 94
8. Input Variables-Data Source and Available Information ... 96
9. Input Variables from UMKC Application ... 97
10. Input Variables from High School Transcript ... 100
11. Input Variables from Credit by Examination and Post-secondary Transcripts ... 103
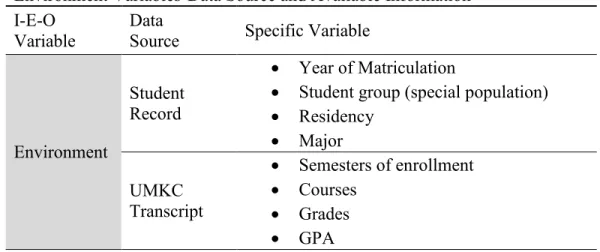
12. Environment Variables-Data Source and Available Information ... 107
13. Environment Variables from Student Record ... 108
14. Environment Variables from UMKC Transcript ... 111
15. Input, Environment, and Output Variables by Regression Block ... 117
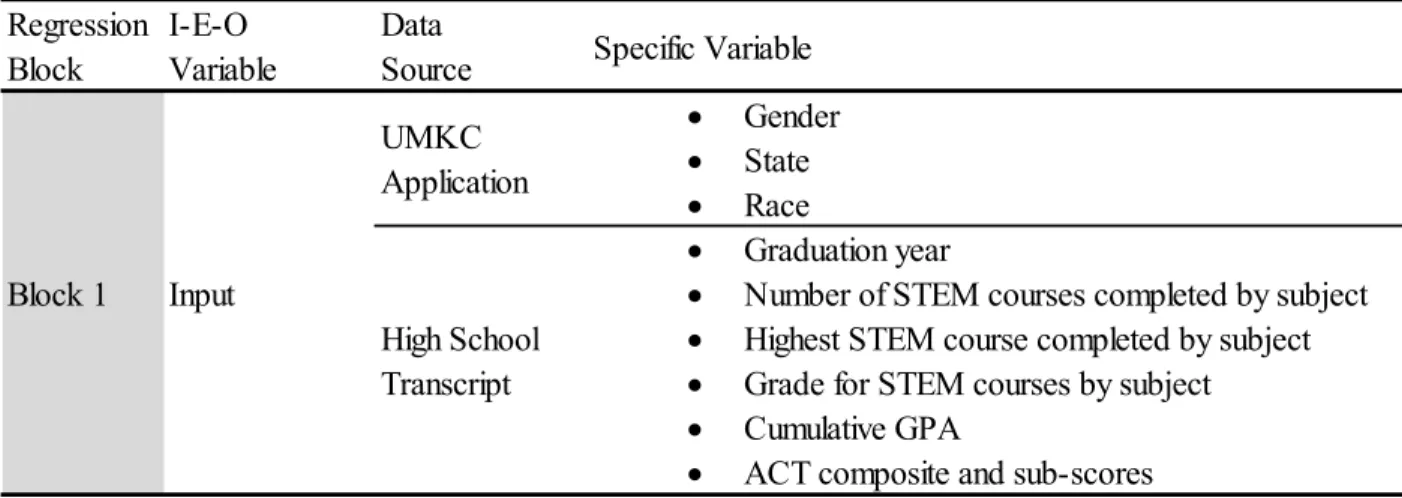
16. Block 1-Input Variable Descriptions and Coding Logic for UMKC Application Data ... 121
xi
17. Block 1-Input Variable Descriptions and Coding Logic for
High School Transcript Data ... 122
18. Block 1-Input Variables: Pre-College Post-Secondary Transcript and AP Test score Report Variable Descriptions and Coding Value ... 126
19. Block 2 Environment Variables: Year 1 Fall Student Record Variable Descriptions and Coding Values ... 129
20. Block 2 Environment Variables: Year 1 Fall UMKC Transcript Variable Descriptions and Coding Values ... 130
21. Block 3 Environment Variables: Year 1 Spring Student Record Variable Descriptions and Coding Values ... 134
22. Block 3 Environment Variables: Year 1 Spring UMKC Transcript Variable Descriptions and Coding Values ... 135
23. Block 4 Output Variables: Year 2 Fall Student Record Variable Descriptions and Coding Values ... 139
24. Input, Environment, and Output Variables by Regression Block ... 142
25. Block 1 Input Variables ... 145
26. Block 2 Environment Variables ... 147
27. Block 3 Environment Variables ... 148
28. Frequency Table by Sample Group for Gender, State, and Race ... 149
29. Independent Sample T-test for Asian Underrepresented and Hispanic/Latino Groups ... 152
30. Independent Samples T-test by Gender... 154
31. Independent Samples T-test by Race ... 156
32. Phase 1 Analysis Summary of T-tests Highest Means for Gender and Race ... 158
xii
33. Comparison of the Mean for Term 1 Cumulative GPA ... 159
34. Control Sample Pre-College KMO and Bartlett’s Test ... 162
35. Control Sample Pre-College Extracted Factors... 163
36. Control Sample Term 1 KMO and Bartlett’s Test ... 164
37. Control Sample Term 1 Extracted Factors ... 165
38. Control Sample Term 2 KMO and Bartlett’s Test ... 166
39. Control Sample Term 2 Extracted Factors ... 167
40. 16-Week Sample Pre-College KMO and Bartlett’s Test ... 169
41. 16-Week Sample Pre-College Extracted Factors ... 170
42. 16-Week Sample Term 1 KMO and Bartlett’s Test ... 172
43. 16-Week Sample Term 1 Extracted Factors ... 171
44. 16-Week Term 2 KMO and Bartlett’s Test ... 172
45. 16-Week Sample Term 2 Extracted Factors ... 174
46. 8-Week Sample Pre-College KMO and Bartlett’s Test ... 176
47. 8-Week Sample Pre-College Extracted Factors ... 177
48. 8-Week Sample Term 1 KMO and Bartlett’s Test ... 178
49. 8-Week Sample Term 1 Extracted Factors ... 179
50. 8-Week Sample Term 2 KMO and Bartlett’s Test ... 180
51. 8-Week Sample Term 2 Extracted Factors ... 181
52. Control Sample Logistic Regression Predictor Variables ... 186
xiii
54. Control Sample Hierarchical Regression Overall Accuracy Results
For Retention ... 188
55. Control Sample Term 3 Biology or Other STEM Major
Regression Statistics ... 189
56. Control Sample Hierarchical Regression Overall Accuracy Results
For Major as Biology or Other STEM ... 190
57. Control Sample Term 3 STEM or non-STEM Major Regression
Statistics ... 191
58. Control Sample Hierarchical Regression Overall Accuracy Results
For Major as STEM or non-STEM ... 192
59. 16-Week Sample Logistic Regression Predictor Variables ... 193
60. 16-Week Sample Term 3 Retention Regression Statistics ... 194
61. 16-Week Sample Hierarchical Regression Overall Accuracy Results For Retention ... 195
62. 16-Week Sample Term 3 Biology or Other STEM Major Regression Statistics ... 196
63. 16-Week Sample Hierarchical Regression Overall Accuracy Results For Major as Biology or Other STEM ... 197
64. 16-Week Sample Term 3 STEM or non-STEM Major Regression
Statistics ... 198
65. 16-Week Sample Hierarchical Regression Overall Accuracy Results For Major as STEM or non-STEM ... 199
66. 8-Week Sample Logistic Regression Predictor Variables ... 200
67. 8-Week Sample Term 3 Retention Regression Statistics ... 201
68. 8-Week Sample Hierarchical Regression Overall Accuracy Results
For Retention ... 202
69. 8-Week Sample Term 3 Biology or Other STEM Major
xiv
70. 8-Week Sample Hierarchical Regression Overall Accuracy Results
For Major as Biology or Other STEM ... 204
71. 8-Week Sample Term 3 STEM or non-STEM Major Regression
Statistics ... 205
72. 8-Week Sample Hierarchical Regression Overall Accuracy Results
1 CHAPTER 1
INTRODUCTION
National policy and initiatives have made science, technology, engineering, and
mathematics (STEM) education a priority in the United States (Stem Education
Coalition, 2012, White House, 2010, NIH, 2009). The STEM fields are the basis of
evolving innovation and the foundation upon which the United States is dependent upon
to maintain its position as a world leader in these areas. United States President Barrack
Obama is leading the nation in this effort and has made improving STEM education one
of his top priorities (White House, 2010). The President has identified three overarching
priorities for science, technology, engineering, and mathematics education necessary for
laying a new foundation for the future prosperity of the United States: increasing STEM
literacy so all students can think critically in science, technology, engineering, and
mathematics; improving the quality of math and science teaching so American students
are no longer outperformed by students in other nations; and expanding STEM
education and career opportunities for underrepresented groups, including women and
minorities (White House, 2010). Adding to the overall increasing level of concern
regarding the ability of the United States to continue to funnel students from high
school into postsecondary educational and in particular into undergraduate STEM
majors, the Business-Higher Education forum (2011) concluded that "increased global
competitiveness, lackluster performance in mathematics and science education, and a
2
created a new economic and technological vulnerability as serious as any military or
terrorist threat" (U.S. Dept of Labor, 2007).
Statement of the Problem
The United States (U.S.) faces three primary barriers, based on a review of the
literature, to accomplishing its goal of being able to supply a quality workforce to
support the predicted increasing demand for workers in STEM fields:
1. The status of the U.S. as a world leader in science and technology is
seriously threatened by the inability to motivate, develop, educate, and retain
a skilled workforce in science, technology, engineering, and mathematics
(STEM) fields (Business, 2011, Hossain and Robinson, 2012, U.S. Dept. of
Labor, 2007, Metcalf, 2010, National Science Board, 2012).
2. The current K-12 system of education in the U.S. is failing to identify,
motivate, and prepare students interested in STEM fields for successful
transition into higher education. Ineffective and insufficiently trained
teachers, the absence of or access to supplemental programs to development
students interest in STEM, a system of student learning assessment that fails
to foster the development of teachers and students, and the lack of support
and professional development opportunities for teachers are all implicated in
this national accusation (Business, 2011, California Council on Science and
Technology, 2009, Hossain and Robinson, 2012, U.S. Dept. of Labor, 2007,
3
3. Enrollment and persistence in STEM majors and the numbers of
undergraduate and advanced degrees awarded in STEM fields are
insufficient to meet the current and projected needs for the STEM workforce
in the U.S. and graduates are not appropriately trained or prepared with the
skills required by STEM employers (Business, 2011, Hossain and Robinson,
2012, U.S. Dept. of Labor, 2007, Lyon, Jafri, and St. Louis, 2012, Metcalf,
2010, Partnership for the New American Economy, 2012).
In 2009, United States President Barrack Obama launched several initiatives
including the Educate to Innovate National Campaign and Race to the Top fund
providing combined financial commitments of over $4.6 billion dollar (White House,
2009). President Obama has since been joined by state and national leaders to address
the growing shortfall the U.S. faces in supplying enough skilled workers to match the
needs of STEM employers. A number of initiatives have resulted from collaborations
that have stemmed from the growing need for a national commitment including Intel's
Science and Math Teachers initiative, the National Math and Science Initiative U-Teach
Program, a commitment from university presidents at over 75 major public universities
to train 10,000 new science and math teachers annually by 2015, the Public
Broadcasting Service (PBS) joining 356 partner stations in the PBS Innovative
Educators Challenge, and the Woodrow Wilson Teaching Fellowship to prepare more
than 10,000 new math & science teachers and support professional development for
100,000 current teachers. In total, these commitments provided additional financial
4
Despite President Obama’s attention and the support he has garnered from
across the nation, the threat that the U.S. is in jeopardy of losing its position as a leader
in science, technology, engineering, and mathematics continues to warrant grave
concern among U.S. STEM employers and others. President Obama and the actions of
the United States continue to be critically and widely scrutinized. Noting accelerating
concerns over whether or not the United States is drawing enough young people to
study science and technology fields in college, “Policy makers”, reported Inside Higher
Education (Lederman, 2009), “have paid comparatively little attention to how the
students who enter those disciplines fare, and whether they stay in those fields once
they enter them”. In 2011, a profound summary of the nation’s concerns was delivered
in a Business-Higher Education Forum Policy Brief, “Key disruptions exist at every
point in the STEM human capital supply chain: in preparation for college; persistence in
STEM majors; inadequate development of high-demand skills in undergraduate
education; poor lineage between employers needs and graduate training and the
diversion of nearly half of STEM graduates into non-stem jobs”.
The recruitment and retention process to funnel students and future STEM
employees into education and training programs in science, technology, engineering,
and mathematics fields is collectively referred to as the STEM pipeline. The term
“pipeline” was introduced to the National Science Foundation (NSF) in the 1970’s and
is a somewhat singular path whereby students discover and develop their interest in
science, technology, engineering, and mathematics beginning in middle school, are
5
entrance into postsecondary education in pursuit of undergraduate degrees in STEM
majors that in turn lead to advanced degrees and training and eventual careers in a
STEM field (Metcalf, 2010). There are growing questions related to the STEM pipeline
both in terms of its accuracy in predicting workforce demand and in the continued
observations of “leaks” at various junctions. The pipeline is inherently “leaky” and has
received growing criticism for an insufficient number of entrance points, its inability to
provide opportunities for the development of relationships between students, teachers,
and STEM professionals that would motivate students to continue their exploration of
science, technology, engineering, and mathematics as possible careers, and its
association with the continued perpetuation of discrimination toward woman and
minorities. One of the most critical statements concerning the pipeline states the
pipeline is a passive resource that “hides the ways in which certain populations are
disciplined, produced, and used for the benefits of others” (Metcalf, 2010).
Persistence, retention, and ultimately degree completion is the goal of any
university. The opportunities available for students to engage with their university are
widely accepted as significantly influencing student’s decisions to continue with their
educational career. In addition, the first year of college is widely influential and
provides the basis upon which the student’s experiences and decisions for career
exploration are founded. For many students a first year experience course is their first
opportunity to engage in a meaningful way with their student colleagues and faculty. It
may be their first opportunity to develop a greater awareness of their interests and much
6
year student (Barefoot, Griffin, and Koch 2012). Within the context of the first year
programs being associated with the greatest contribution to retention, studying the
impact of such opportunities as part of a first year experience course is logical (Habley
and McClanahan, 2004).
Theoretical Basis of the Study
In 2004, the University of Missouri-Kansas City (UMKC) First Year Experience
Committee was convened through a collaboration of the Chancellor's Cabinet, the
Division of Academic Affairs, and the Division of Student Affairs and Enrollment
Management (UMKC First Year Experience Committee, 2006). The committee
presented their final report in 2006 which included separate profiles and retention
statistics for first-time freshman and transfer students enrolled at UMKC. After
reviewing literature, campus support, activities, and programs, campus National Survey
of Student Engagement (NSSE), participation in “Shaping the Future: Aspiration,
Assessment, Action!” a national teleconference by the Policy Center on the First Year
of College and the National Resource Center for the First-Year Experience and Students
in Transition, and attending the annual conference on the First Year Experience, the
report identified components that contributed to the first year experience for the two
student populations that culminated in four conclusions: UMKC has multiple strong
orientation events, it offers a number of welcoming events in the fall, but in contrast has
few outreach programs or faculty/student engagement initiatives and has no orientation
7
The report concluded with recommendations for outcomes that were meant to spur
discussions across campus to serve as the basis for future programming and services.
Following the lead of the First Year Experience Committee, the School of
Biological Sciences began looking closely at its participation in students’ first year
experiences. Within the School, the Undergraduate Programs Office in particular began
reviewing the academic advising services available to students and a central focus of the
review became students who failed to obtain or maintain good academic standing and
were subsequently placed on academic probation. UMKC defines good academic
standing as maintaining a minimum University of Missouri (UM) grade point average
(GPA) of 2.0 on a 4.0 scale (UMKC Catalog, 2009-2013). Students with declared
majors in the School of Biological Sciences are additionally required to maintain a
University of Missouri biology GPA of 2.0. At the end of each semester, students
unable to obtain or maintain this minimum standard are placed on academic probation
by the University Registrar as notified by their academic unit.
The advising models employed by individual academic units at UMKC are
decentralized and vary both in method and delivery (UMKC Catalog, 2013-2014).
Smaller units tend to rely primarily on faculty to deliver much of the advising and
depend heavily on accountability through frequent contact with the students in the
classroom, not in advising sessions. In contract, however, advisers in the largest
academic unit at UMKC, the College of Arts and Sciences, are not able to track students
as personally and much of the advising load, particularly for first and second year
8
professional advisers. Few academic units require students to participate in regular
advising with the exception of new freshman, graduating seniors, and graduate students.
Those units requiring regular advising primarily require only one session per semester
prior to each registration cycle.
Research literature in higher education supports what is widely accepted by
college and university administrators, faculty, and advisers that with intervention,
students can develop the cognitive strategies and motivation that allow for behavioral
modifications that will result in a probationary student’s successful return to good
academic standing. The development of an intrusive advising program requires
increased student accountability and responsibility. When the components of the
advising model are negotiated, goal centered, and student driven, student learning and
development can be promoted and encouraged through regular feedback and
reinforcement (Light, 2001).
King and Kerr (2005) provide the following excerpt as evidence supporting the
critical need and importance of assessment advising programs: “In a relevant review of
the literature, Pascarella and Terenzini (1991) noted that the research results have been
mixed.” However, they cite research by Metzner (1989) showing “that the quality of
advising received only a small and statistically non-significant direct effect on
persistence.” High-quality advising, however, did have a statistically significant positive
effect on persistence transmitted through its positive impact on such variable as grades
and satisfaction and its negative effect on intent to leave the institution” (Pascarella &
9
research may demonstrate that advising promotes student success, there is little
evidence to determine which methods of advising and which models are most effective
in promoting that success. Habley and Morales (1998) concur, stating that the challenge
is to provide compelling evidence that academic advising does make a difference in the
lives of students and the success of institutions. The proven effectiveness of intrusive
advising supports this method as a necessary component for any advising program,
especially one whose clientele are identified as those in greatest need, and more
importantly, those least likely to seek it voluntarily (Upcraft & Kramer, 1995; Austin,
Cherney, Crowner, & Hill, 1997; Kirk-Kuwaye & Nishida, 2001; and Cruise, 2002).
Student involvement in the advising process has been identified as having a profound
impact in helping students take responsibility for their academic performance and in
recognizing factors that hinder or support their academic success. When students are
actively involved in the identification of problems and solutions, they are empowered to
take ownership of the process and the outcome (Raushi, 1993). Research shows that the
higher the level of adviser/student involvement, the greater the chances are for the
student to raise their GPA, both in immediate and 3-year returns (Lynch & Stuckey,
2001; and Abelman & Molina, 2001).
The School of Biological Sciences recognized the need to directly and
aggressively address student’s needs, especially the needs related to first semester
transitions, preparedness for college level participation and requirements, and students
facing academic difficulty. In spring semester 2008, the School of Biological Sciences
10
program was used with students on probation during the subsequent semester (fall
2008). Beginning fall semester 2009, the School offered, for the first time, Biology 115:
First Year Seminar, a first year experience course for new freshman biology majors.
Assessment of the impact of this course on academic performance and persistence,
particularly for STEM majors, will enable data driven decisions to be made that can
influence policy and programming to better align the School of Biological Sciences in
their efforts to effectively address students’ needs at the highest possible level and
positively contribute to the continued success of the school and institution in accordance
with its mission and values and that of the University. Furthermore, this assessment will
further the School of Biological Sciences and UMKC in positively contributing to the
number of students enrolling in and graduating from STEM programs. UMKC is a solid
model for the basis of this analysis and the results of this impact study may provide
beneficial considerations to other institutions with comparable demographic profiles
and first year experience courses, particularly in the Midwest.
Purpose of the Study
The purpose of this study is to examine the impact of a first year experience
course on retention of first-time college freshman enrolled as STEM majors in a first
year seminar course at the University of Missouri-Kansas City (UMKC) using
Alexander Astin's (1993) Input-Environment-Output (I-E-O) model. The Biology 115:
First Year Seminar course offered through the School of Biological Sciences at the
UMKC will be the model for analysis. The primary goal will be to examine the impact
11
experiences related to the Biology 115: First Year Seminar contributes to students'
academic performance and their decisions to persist or not in their initially declared
STEM major.
Research Questions
The following research questions will be addressed:
1. What impact has Biology 115: First Year Seminar had on first-time college
freshman enrolled full-time as declared science, technology, engineering,
and mathematics (STEM) majors in the School of Biological Sciences at the
University of Missouri-Kansas City?
2. How has an alternative eight-week (half-semester) model of Biology 115:
First Year Seminar influenced students’ academic performance and
persistence in the School of Biological Sciences at the University of
Missouri-Kansas City?
Hypothesis
Null hypothesis one. The Biology 115: First Year Seminar has had no impact
on first-time college freshman enrolled full-time as declared science, technology,
engineering, and mathematics (STEM) majors in the School of Biological Sciences at
the University of Missouri-Kansas City.
Research hypothesis one. The Biology 115: First Year Seminar has had a
positive impact on first-time college freshman enrolled full-time as declared science,
technology, engineering, and mathematics (STEM) majors in the School of Biological
12
point averages, an increased percentage of students in good academic standing, and
increased first to second year retention.
Null hypothesis two. The alternative eight-week course model of Biology 115:
First Year Seminar has no demonstrated influence on students’ academic performance
and retention in the School of Biological Sciences.
Research hypothesis two. The alternative eight-week course model of
Biology115: First Year Seminar has positively influenced students’ academic
performance and retention in the School of Biological Sciences as demonstrated by
higher grade point averages and higher rates of first to second year retention.
Significance of the Study
The educational significance of this study is to advance the literature in the field
of the first year experience in general and more specifically to the persistence of
students in science, technology, engineering, and mathematics. This study will seek to
improve the understanding of the impact of the first year experience course and how
variations in course design and delivery influences students’ academic performance and
persistence. Findings from this study may assist in the development of an increased
understanding of experiences and learning opportunities that will lead to increased
retention and graduation of students with declared STEM majors. Additionally, as this
dissertation study is with an interdisciplinary program examination of the analysis will
include perspectives from both disciplines, Urban Leadership and Policy Studies in
13
Definition of Terms
A few of the specific terms used in this study have widely varying definitions
across higher education institutions and within the higher education literature. The
terms STEM major, First-Time College (FTC), First Year Experience (FYE), First Year
Experience course, persistence, and academic performance, as they are used in this
study, is defined below.
Academic performance.Academic performance will be measured as grade
point average earned at the conclusion of the initial semester of enrollment at the
university and earned for each semester of consecutive enrollment.
Census date. The Census Date occurs on the 20th date of classes for the fall and
spring semesters.
Coaching Program. The Coaching Program “provides one-on-one peer
mentoring to first year students, leadership opportunities to returning UMKC students
serving as peer coaches, services for students on financial aid contracts, academic
success workshops, and academic and personal support for Henry W. Bloch Scholars”
at UMKC (UMKC Coaching, 2013).
Environment variable. The environment variable is defined as the various
programs, policies, faculty, peers, and educational experiences to which the student is
exposed (Astin, 1993). For this study the environment variables will be data collected
during the student’s enrollment at UMKC for their initial fall term (Year 1 fall) and the
14
Input variable. The input variable is defined as the characteristics of the
student at the time of initial entry to the institution (Astin, 1993). The input variables
for this study will be from data prior to the student’s initial enrollment in their first term
(Year 1 fall) at UMKC.
First-time college (FTC). First-time college is determined as recorded by the University of Missouri-Kansas City Registrar as the admit type for each student. As
defined by the Integrated Postsecondary Education Data System, a student who has no
prior postsecondary experience attending any institution for the first time at the
undergraduate level. This includes students enrolled in academic or occupational
programs (NCES, n.d.). It also includes students enrolled in the fall term who attended
college for the first time in the prior summer term, and students who entered with
advanced standing (college credits earned before graduation from high school).
First year experience (FYE). First year experience is defined in the Final Draft Report of the UMKC First Year Experience Committee dated May 30, 2006, as an
intentional, cohesive, dynamic program for first year students designed to promote
student success and develop campus community.
First year experience course. Afirst year experience course refers to a specific course offered in the academic unit being studied (Biology 115: First Year Seminar).
This is a one-credit, graded course delivered in person by a single instructor. This
course is offered through the School of Biological Sciences and focuses on assisting
freshman students in making a successful transition from high school to the university
15
involvement, academic advising, and career investigation. This course has been offered
in fall semesters to new freshman since 2009 and was originally modeled after the Steps
for Success program (Welchert, 2008, 2009) developed within the School of Biological
Sciences to assist students placed on academic probation in returning to good academic
standing.
Full time enrollment (FTE). Students must be enrolled in a minimum of 12
credit hours to be identified as full-time at UMKC.
High School Dual Credit. An affordable program for high achieving high
school students that allows them to simultaneously earn credit towards high school and
college requirements.
Legitimate educational interest. A school official generally has a legitimate
educational interest if the official needs to review an education record in order to fulfill
his or her professional responsibility (U.S. Department of Education, Family Policy
Compliance Office, 2013).
Output variable. The output variables are characteristics that result after
exposure to the environment (Astin, 1993). For this study the output variables are
retention and major for the students second fall term (Year 2 fall).
Pell eligible. Students who are Pell eligible meet the minimum requirements for
a Federal Pell Grant. These grants are generally designated for students from families
16
Retention. Retention will be measured as continuous enrollment from one
semester to the next sequential semester and separately from the initial fall semester to
the next subsequent fall semester.
STEM major. STEM majors are determined nationally on the basis of inclusion on the STEM-Designated Degree Program list as announced by the United States
Department of Homeland Security. For this study STEM majors will be confined to
majors in biology, chemistry, physics, and mathematics.
Limitations
Participants for this study are limited to students enrolled at the University of
Missouri-Kansas City as first-time freshmen who enrolled full time as declared majors
in the School of Biological Sciences. As such the ability to generalize findings from this
study will be limited to schools of similar size, selectivity, and with similar student and
faculty profiles located in the Midwest. Additional limitations are necessarily required
based on the format, delivery method, and topics covered in the Biology 115: First Year
Seminar course and findings are limited to courses with similar characteristics.
The use of Astin’s I-E-O model to analyze the data obtained for this study also
introduces limitations. Information obtained as input variables will be obtained as
officially recorded from the students’ applications and official transcripts and test
reports that were submitted to the university. Environmental and outcome variables will
also be obtained from officially recorded university records. Although using official
university records significantly reduces errors or bias of self-reported data it may not
17
scores may be absent; having been completed by the student but not submitted to the
university.
Organization of the Remaining Chapters
Chapter 2 contains a literature review regarding the theoretical context for this
study. The literature review will address the concepts of science, technology,
engineering, and mathematics (STEM) as a field, the STEM pipeline, and United States
STEM workforce. The literature will address the concepts of retention theory, the first
year experience, the first year experience course, and provide a rationale for the use of
Astin’s I-E-O impact model for analysis of the data. Chapter 3 will include the
methodology. This chapter will provide the reader with an overview of the selection of
UMKC and the School of Biological Sciences as an appropriate model, the process for
selection of participants for the study, and a description of how the data will be
collected and analyzed. The data analysis will be included in Chapter 4. Chapter 5 will
contain a summary and discussion of the study, conclusions, limitations of the study,
18 CHAPTER 2
LITERATURE REVIEW
When problems arise, solutions are sought. The inability of the United States to
supply a sufficient number of skilled science, technology, engineering, and mathematics
(STEM) workers to meet workforce demands has drawn much attention and has
increasingly been termed a U. S. crisis. Across the United States statisticians work to
provide the data necessary to make decisions that will direct the future of the Science,
Technology, Engineering, and Mathematics (STEM) workforce in America (Bureau of
Labor Statistics, March, 2012, National Science Board, 2012, ACT, 2006, Aud et al. ,
2013). The answers to the STEM workforce shortfall cannot however be understood
solely through statistics. A deeper understanding of the STEM workforce crisis can only
be fully comprehended by also examining the STEM pipeline that supplies the
workforce. Literature discussing the STEM pipeline sources its beginning in elementary
and middle school (Lyon, Jafri, and St. Louis, 2011). As the pipeline twists and turns
through high school and post-secondary education the pipeline becomes increasingly
leaky and potential STEM workers are purged from the pipeline before reaching their
final destination as a worker in a STEM field.
This literature review will begin by setting the context for this study. An
overview of STEM as a field with an explanation of the STEM players will provide the
map to look more deeply at the people in the pipeline, where the pipeline experiences
19
include a description of global partners. An examination of global and U.S. workforce
and education trends will also be provided. The STEM pipeline will be reviewed along
three primary section of the pipeline: K-12, higher education, and workforce. An
overview of access, leaks, and national response in each area will be provided. As the
focus of this study hovers over a critical transition period that spans the departure from
high school through the first year of college, the next section of this chapter will review
student development and retention theories in higher education. A review of literature
on the first year experience and first year experience courses will conclude the chapter.
The resources available to address the STEM workforce and pipeline are
complex and there is no one source that adequately addresses all aspects examined here
(Ellis, 2010). Sources tend to focus on specific aspects of STEM depending on the
reporting body and targeted audience. To the best of this researchers ability a range of
resources have been utilized to create a thorough review of STEM as a field.
Science, Technology, Engineering, and Mathematics (STEM)
The definition of STEM fields has been scrutinized, debated, and clarified over
the past two decades. The National Center for Education Statistics (NCES), National
Science Foundation, United States Department of Homeland Security (DHS), and the
Bureau of Labor Statistics (BLS) are the four primary organizations providing
definitions of what academic/educational program areas and occupations are classified
under the Science, Technology, Engineering, and Mathematics STEM umbrella
(Koonce, Zhou, Anderson, Hening, and Conley, 2011, Fiegener, 2013, Bureau of Labor
20
broad areas are used to define STEM and careers (Minnesota State Colleges and
Universities, 2008):
Agriculture, Agricultural Operations and Related Sciences
Computer and Informational Sciences and Support Services
Engineering and Engineering Technologies
Biological and Biomedical Sciences
Mathematics and Statistics
Physical Sciences and Technologies
Data analysis is complicated by the different classifications and category’s used by the
National Science Foundation, Department of Homeland Security and the Bureau of
Labor Statistics; the National Science Foundation lists 136 Instructional programs for
STEM disciplines, the U.S. Department of Homeland Security lists 423 STEM
designated degree programs, and the Bureau of Labor Statistics categorizes STEM
occupations under five types of occupations containing 840 subtypes.
The recruitment and retention process to funnel students and future STEM
employees into education and training programs in science, technology, engineering,
and mathematics fields is collectively referred to as the STEM pipeline. The term
“pipeline” was introduced by the National Science Foundation (NSF) in the 1970’s and
is described as a somewhat singular path whereby students discover and develop their
interest in science, technology, engineering, and mathematics beginning in middle
21
experience resulting in their entrance into postsecondary education in pursuit of
undergraduate degrees in STEM majors that in turn lead to advanced degrees and
training and eventual careers in a STEM field (Metcalf, 2010).
Global partners. The United States is not the sole player on the STEM court. This is a global game and the players are many, and most indications are that the United
States is losing the game (U.S. Congress Joint Economic Committee, 2012). A recent
report from the U.S. Congress Joint Economic Committee indicated that the U.S. is
falling behind in international comparisons but urged caution when making
international comparisons with countries that vary dramatically in size, diversity, and
industrial policies. Governments in many parts of the developing world view science
and technology as integral to economic growth and development. These countries have
taken steps to open markets to trade and foreign investment, develop their science and
technology (S&T) infrastructures, stimulate industrial research and development
(R&D), build indigenous R&D capabilities and expand their highest education systems
(National Science Board, 2012).
Organization for Economic Co-Operation and Development. When comparisons are being made, the countries of comparison are referred to by their
association with three distinct groups. The first group is commonly referred to as OECD
22
currently thirty-four countries1 in the OECD population who have provided ratification
documents pledging their commitment to democracy and the market economy (OECD,
2013). The OECD counties span the globe including many of the worlds most advanced
countries but also emerging countries like Mexico, Chile, and Turkey. The Organization
reports working closely with “emerging giants” like China, India, and Brazil and with
developing countries like Africa, Asia, Latin America and the Caribbean.
European Union. The second group used in comparisons is an economic and political union of 27 member states which are located primarily in Europe. The
European Union or EU was created in the after math of World War II and today
proclaims that “everything that is does is founded on treaties, voluntarily and
democratically agreed by all member countries”. The EU is comprised of the following
countries: Austria, Belgium, Bulgaria, Cyprus, Czech Republic, Denmark, Estonia,
Finland, France, Germany, Greece, Hungry, Ireland, Italy, Latvia, Lithuania,
Luxembourg, Malta, the Netherlands, Poland, Portugal, Romania, Slovakia, Slovenia,
Spain, Sweden, and the United Kingdom (European Commission, 2012, National
Science Board, 2012).
Asia-8. The Asia-8 is reported to function like a loosely structured supplier zone for China’s high technology manufacturing export industries (National Science Board,
2012). The countries of India, Indonesia, Malaysia, the Philippines, Singapore, South
1 OECD member countries include Australia, Austria, Belgium, Canada, Chile, Czech Republic, Denmark,
Estonia, Finland, France, Germany, Greece, Hungary, Iceland, Ireland, Israel, Italy, Japan, Korea, Luxembourg, Mexico, Netherlands, New Zealand, Norway, Poland, Portugal, Slovak Republic, Slovenia, Spain, Sweden, Switzerland, Turkey, United Kingdom, and United States (OECD, 2013).
23
Korea, Taiwan, and Thailand comprise the Asia-8 and are the third most documented
comparison group in STEM discussions. In the Science and Engineering Indicators
(National Science Board) 2012 report Asia’s growing recognition as a major world
science and technology center is primarily attributed to China but the Asia-8 have also
played a role. The report states these countries are committed to “boosting the quality
of, and access to, higher education and developing world-class research and S&T
infrastructure”.
Global labor force trends. The National Science Foundation (NSF) in
conjunction with the National Center for Science and Engineering Statistics (NCSES)
produced a report in 2012 (Fiegener) outlining three important considerations related to
the workforce shortfall of STEM workers in the United States. The report indicated that
worldwide, the number of workers engaged in research has been growing since 1995
noting that the number of researchers in the United States and the European Union has
experienced steady growth but at a lower rate than in China and South Korea where the
number of researchers have tripled and doubled respectively. The report stated that
among businesses located in the United States, research and development employment
is disproportionately domestic with one-quarter of R&D employment being in foreign
locations. The report also indicated that preliminary data from 2009 indicates a
substantial shift in the balance between R&D employment by U.S. firms abroad and
R&D employment by foreign firms in the United States.
As mentioned previously, competition is a global game. In a presentation from
24
conjunction with the Bill and Melinda Gates Foundation, the National Science
Foundation, Johns Hopkins University, and others, it was commented that “global
competition, market instabilities and changing trends in immigration are placing
increasing pressures on the world economy” (Brighton, Burgstahler, Martinez, and
Morrison, 2009). This is consistent with comments from the National Science Board
which reported in 2012 that global R&D expenditures over the past decade have grown
faster than global gross domestic product (GDP), an indication of widespread efforts to
make economies more knowledge and technology intensive.
Global trends in STEM education. In a report filed in April, 2012 to the U.S.
Congress Joint Economic Committee, it was noted that while the U.S. produces the
greatest number of STEM degree recipients, when these numbers are adjusted for the
overall number of degrees and for population the picture looks grim with the U.S.
comparing unfavorably with other global competitors. This observation was consistent
with an earlier report released in January 2012 from the National Science Board which
reported that in 2008 about 5 million first university degrees were awarded in science
and engineering worldwide. While numbers of degrees awarded in the United States
increased, they did so at a rate much reduced from countries such as China and Taiwan
whose numbers of degrees awarded doubled between 2000 and 2008. The report further
noted that China overtook the United States in the number of doctoral degrees awarded
in natural science and engineering in 2007 but that the United States according to 2008
data has managed to award the largest overall number of science and engineering
25
next in line for number of science and engineering doctoral degrees awarded according
to the report.
In the Science and Engineering Indicators (National Science Board, 2012) report
it was reported that there are no comparison measures of the global science and
engineering (S&E) labor force, but fragmented data indicates rapid growth concentrated
in developing countries in the number of individuals who pursue education beyond the
secondary level. The report notes two statements of particular interest: globally well
above half of all engineering degrees are awarded in Asia, and that China has driven the
rise of first university S&E degrees from 280,000 in 2000 to 1 million in 2008
representing about 50% of all first university degrees, 60% of science and engineering
degrees, and 70% of natural science and engineering degrees (the U.S. equivalents are 4
percent, 15%, and 28% respectively). The report further indicated that the increase is
degrees awarded goes beyond first degrees noting that since 2000, the number of natural
science and engineering doctorates awarded in Japan and India has increased to
approximately 7100 and 8000 respectively, and the same degrees from China have more
than tripled to about 26,000 in 2008, exceeding the comparable number of doctorates
awarded in the U.S. With respect to degrees awarded in the United States, the report
indicated that a large proportion of these degrees go to non-U.S. citizens, noting that
most of the post-2000 increase in U.S. natural science and engineering (NS&E)
doctorate degrees were awarded to temporary visa holders who in 2009 earned about
26
counting foreign students with permanent visas, have earned 39% to 48% of U.S.
NS&E doctorates since 2000.
United States labor force trends. There is consensus that the key to U.S.
competitiveness in an increasingly global economic environment is the adequacy of
supply and the quality of the workforce in the STEM fields (U.S. Dept. of Labor, 2007).
In 1957, the Soviet launch of Sputnik, the world’s first orbiting satellite, provided an
opportunity for the United States to reexamine its role as a global citizen and in the
wake of this reflection a new competitive spirit emerged which birthed the beginnings
of STEM as an area of specialized attention. In the decades since, despite having once
been well-established as a country of national superiority with respect to STEM, and
despite decades of warnings about the erosion of science and math education leading to
the dwindling supply of STEM employees, the United States now finds itself in a
precarious position (California Council on Science and Technology, 2009, U.S.
Congress Joint Economic Committee, 2012). Science, technology, engineering, and
mathematics (STEM) occupations are instrumental roles in expanding and developing
new products and generating technological progress (Cover, Jones, and Watson, 2011).
The Occupational Employment Statistics survey of STEM occupations is defined as
consisting of 97 specific occupations that make up about 6 percent of the U.S.
employment. These occupations include those in computer and mathematical sciences,
architecture and engineering, and life and physical sciences.
U.S. employment rates and wages. The Bureau of Labor Statistics is the
27
in their 2010-2020 projections (2012) that total employment in the U.S. is expected to
increase by 20.5 million jobs by 2020. Jobs requiring a master’s degree are expected to
grow the fastest, those requiring a high school diploma the slowest. The Bureau further
stated that slower population growth and a decreasing overall labor force participation
rate are expected to lead to slower civilian labor force growth. According to the Bureau
of Labor Statistics report (2007) on STEM occupations and job growth, the need for
technical workers will continue to grow.
The Partnerships for a New American Economy confirms the need for qualified
skilled workers in STEM fields in the United States as they relate to employment rates.
The report indicated full employment opportunities available for U.S. STEM workers
with advanced degrees. The report noted the significantly lower rate of unemployment
of 3.15 percent for U.S. citizens with doctorates and 3.18 percent for those with
master’s degrees as compared to the overall national unemployment rate of over 8
percent. The concern over the displacement of U.S. workers by the number of foreign
born workers was additionally addressed and found to be of little concern noting that
even in STEM fields with the highest numbers of foreign born workers (26.1% with
doctorates and 17.1% with master’s degrees) the unemployment rate remained low.
The highest concentrations of STEM occupations are usually in areas with
technology centers and research parks. A visual essay of STEM occupations presented
in Monthly Labor Review reported the metropolitan areas where STEM occupations
accounted for at least 15% of total jobs were San Jose-Sunnyvale-Santa Clara, CA;
28
Durham, NC (Cover, Jones, and Watson, 2011). In the same report it was reported that
the areas with highest concentrations of STEM occupations tended to have higher
wages for those occupations and most have mean wages significantly above the U.S.
average ($77,480 for STEM versus $43,460 U.S. average). The Partnership for a New
American Economy reported that foreign born STEM workers are paid on par with U.S.
STEM workers and that there is no verifiable evidence to suggest that foreign born
STEM workers affect the wages of U.S. workers by providing a less expensive source
of labor. The lower unemployment rates and higher relative wages in STEM
occupations indicate the strong demand for STEM workers (U.S. Congress Joint
Economic Committee, 2012).
STEM Pipeline
“Not since the mid-1950’s has our nation faced a more serious shortage of
skilled workers in science, technology, engineering, and mathematics fields” (ACT,
2006). The recruitment and retention process to funnel students and future STEM
employees into education and training programs in science, technology, engineering,
and mathematics fields is collectively referred to as the STEM pipeline. The term
“pipeline” was introduced to the National Science Foundation (NSF) in the 1970’s and
is a somewhat singular path whereby students discover and develop their interest in
science, technology, engineering, and mathematics beginning in middle school, are
encouraged and motivated throughout their high school experience resulting in their
29
majors that in turn lead to advanced degrees and training and eventual careers in a
STEM field (Metcalf, 2010).
In fall 2013, approximately 55.3 million students will attend public or private
elementary and secondary schools and a record 21.8 million students are expected to
attend American Colleges and Universities (Axelson, 2010). These numbers alone
effectively demonstrate the one critical aspect of the STEM pipeline that is of concern:
the number of skilled workers potentially available to pursue STEM occupations is
limited based on access to higher education. There are leaks in the pipeline and the
majority of these leaks occur from the 9th grade through entrance into the workforce
following achievement of an undergraduate degree (Snyder, Dillow, and Hoffman,
2009, Lowell, Salzman, Berstein, and Henderson, 2009, Maltese and Tai, 2011,
Engberg and Wolniak, 2013). In this section of the literature review the STEM pipeline
will be examined from three focal points: access, leaks, and response. Each focal point
will be reviewed in light of three primary areas: K-12 education, higher education, and
the STEM workforce.
Access.
K-12 education. As stated above just over 55 million students will engage in elementary and secondary education in the United States. According to data from the
National Center for Education Statistics (U.S. Dept. of Education, 2011), about 1.3
million children are expected to attend public prekindergarten this fall; a number that is
30
the STEM workforce but the reality is that few of them will persist in the STEM
pipeline.
Preparation. Access to the STEM pipeline for students in K-12 education begins early; some data suggests that students make up their minds by fifth grade if they like
math and science (Axelson, 2010). Access to the STEM pipeline is widest at the K-12
level where education is centered on preparation and motivation that will carry students
through to high school graduation and entrance into a college or university. Preparation
for college must overcome three primary obstacles: math and science preparation, social
and emotional development, and knowledge of and access to opportunities.
In recent years the United States K-12 education system has been scrutinized for
a lack of proficiency in preparing students sufficiently in math and science (Business,
2011, Hossain and Robinson, 2012, California Council on Science and Technology,
2009, ACT, 2006). According to ACT (formerly American College Testing) data fewer
than half of all 12th grade test takers met the college readiness benchmarks in math and
science; numbers were particularly low in math proficiency for Students of Color
(Business, 2011, Lyon, Jafri, and St. Louis, 2011). Table 1 illustrates data reported by
the National Center for Education Statistics (Aud et al., 2013) showing the percentages
of students in 2000, 2005, and 2009 who were able to demonstrate proficiency of math
31 Table 1
Percentage of Students to Achieve Math Proficiency in 4th and 8th Grades in the Years 2000, 2005, and 2009
Year 4th Grade 8th Grade
2000 22 25
2005 35 28
2009 38 33
National Center for Education Statistics (Aud et al., 2013).
In 2009 38% of fourth graders and 33% of eighth grades performed at or above the
proficient level in math; an increase from 22% of 4th grades and 25% of 8th graders in
2000 and 35% or 4th graders and 28% of 8th graders in 2005. For science, 32% of 4th
graders and 29% of 8th graders were reported to be at or above the proficient level in
2009. State averages for science proficiency ranged from 17-47% for 4th graders and
15-43% for 8th graders. According to the National Math and Science Initiative U.S.
students recently finished 25th in math and 17th in science in the world compared to 31
other countries (2013).
In addition to the critical foundation in math and science, social and emotional
development is essential. Skills such as leadership and decision making allow student to
develop relationships with professionals such as teachers, counselors, and scientist
while progressively learning content knowledge and career requirements. Development
of self-awareness can help them make informed decisions about what they are interested
32
known to influence student’s decisions such as the students’ parents, teachers,
counselor, and friends are meaningful (Hossain and Robinson, 2012). When combined
with experiences to engage with and learn from professionals in science and scientist
these relationships can foster socioeconomic skills, such as communication,
self-confidence, self-efficacy, teamwork, cooperation, and leadership “not only help
students to learn about science but also to translate their experiences into future
aspirations and achievements” (Lyon, Jafri, and St. Louis, 2011).
Motivation. Students who do not find personal meaning or relevance in STEM will not pursue it beyond what is required in their school curriculum (Lyon, Jafri, and
St. Louis, 2011). Several sources site fewer than 1 in 3 college bound high school
seniors are interested in STEM as a college major (Business, 2011, Hossain and
Robinson, 2012, ACT, 2006). Stem education is failing to motivate American citizens
to attain skills and knowledge required to meet the challenging economic and leadership
needs (Hossain and Robinson, 2012). Students must be engaged in hand’s-on projects
and allowed to experience science in a way that the student can deem relevant (Axelson,
2010, Lyon, Jafri, and St. Louis, 2011, Maltese and Tai, 2011). When students are
motivated through direct participation and can engage in an authentic, personally
meaningful experience with an adult who can share their personal experiences with the
student, the experience serves as a building block for development and the creation of
social capital for the student (Lyon, Jafri, and St. Louis, 2011, California Council on
Science and Technology, 2009). Students need to be inspired beginning in middle
33
problem-solving skills in the high school grades to motivate them to continue to explore
STEM as a career options and to see themselves in these roles. (Hossain and Robinson,
2012). When connections are able to be made through ongoing conversations between
teachers and counselors and students and their families, the motivation that may have
begun can be perpetuated and common misconceptions about STEM studies requiring
significantly more investment and work can be dispelled (Lyon, Jafri, and St. Louis,
2011, Hossain and Robinson, 2012).
Opportunity. Knowledge of opportunities to explore STEM fields and persist in the STEM pipeline beyond high school graduation is critical. This is especially true for
first generation college students who may not be aware of the opportunity to attend
college or if aware may not begin to explore the opportunity until late in high school
(Lyon, Jafri, and St. Louis, 2011). In their report, Beyond the Pipeline, Lyon, Jafri, and
St. Louis (2011) note an interesting aspect of opportunity; for many students
opportunity is sporadic. They indicate that students who participate in engaging
programs are more likely to graduate high school, go to college, and major in science
than their peers but their ability to participate is influenced by a number of factors
including registration fees, lack of transportation, competitive application process, poor
literacy skills, etc. Knowledge of opportunities is not consistently communicated to
students and programs are not designed in a non-linear fashion so that students who
may rediscover their interest in science and are able to start at a later time in programs
34
Higher Education. The ability of students to earn a college degree is believed to be a critical component of the STEM pipeline that provides talent that will fuel
America’s competitive ability (Business, 2011). There are significant challenges
associate with students’ abilities and interest in persisting through the section of the
STEM pipeline that transitions from high school to college. For many students these
challenges begin with access. The challenges that will be reviewed in this section are
high school graduation rates, selection of STEM as a major, and the ability of
institutions of higher education to foster and maintain student’s motivation and interest
in STEM as a career path.
High school graduation. High school graduation is a necessary step for students to persist in the STEM pipeline and make the transition from high school to higher
education. According to the National Science Board, Science and Engineering
Indicators, 2012 report, “nationwide, 87.1% of the early- to mid-career population had
at least a high school credential in 2009, a slight increase from the 85.0% who held such
a credential in 2000.” Based on data collected from the Census Bureau, 2000 Decennial
Census, Population Estimates Program and American Community Survey in various
years, the National Science Board reports that the percentage of graduates 25-44 years
old in the United States was 85% in 2000, 85.5% in 2005, and 87.1% in 2009. These
percentages were slightly higher for the state of Missouri with 87.7, 88.0, and 89.4%
reported respectively or the same time frames (2012). The National Research Council
reported that the United States has fallen from first to eleventh place in the OECD in the