Vol. 158: 165-175, 1997 MARINE ECOLOGY PROGRESS SERIES
Mar Ecol Prog Ser Published November 17
- - -
PSP detoxification kinetics in the mussel
Mytilus galloprovincialis. One- and two-
compartment models and the effect
of
some environmental variables
'Centro de Investigacions Marifias, Conselleria de Pesca, Xunta de Galicia, Aptdo. 13. E-36620 Vilanova de Arousa, Spain 'Instituto de Investigaciones Marinas, Eduardo Cabello, 6, E-36208 Vigo, Spain
3Centro Costero de Vigo, Instituto Espafiol de Oceanografia, Aptdo 1552, E-36280 Vigo, Spain
ABSTRACT Paralytic shellfish poisoning (PSP) toxins are accunlulated by bivalves during toxic plankton blooms. In these bivalves the toxins are distributed into different body tissues which have varying affinities for them, and later these toxins are transferred by the bivalves to other trophic levels. After the disappearance of the toxic cells, shellfish remain t o x ~ c for a vanable period of time, depend- ing on the detoxification kinetics. We studied these kinetics in mussels Mytilus galloprov~ncialis previ- ously exposed to a bloom of the PSP producing dinoflagellate Gymnodinium catenatum The toxin pro- file observed in the mussels was very similar to that of G. catenatum, showing that toxin transformations (chemical or enzymatic) had little or no importance in this case. The detoxification rates at all the sampling points decreased progressively from ca 0.25 to 0 d-' following a n inverse hyperbolic- like curve. These rates were related to different degrees to the environmental factors studied (salinity, temperature, and light transmission as a measure of seston volume, and in vivo fluorescence a s a measure of phytoplankton concentration) and to fresh body weight during each sampling period (esti- mated by multiple regression). In general, detoxification rates became increasingly independent of the variables cited a s the experiment progressed. One- and 2-compartment detoxification models, both with 2 variants (with fixed and variable detoxification rates depending on the environmental variables and body w e ~ g h t ) , were used to describe the detoxification kinetics observed. Neither of the 2 variants of the l-compartment models correctly described detoxification. The 2-compartment models, on the other hand, particularly the environmentally controlled variant, fit the observed detoxification kinetics very well. There was only a slight difference between these last 2 models, which would suggest that the actual effect of the environmental variables considered in the detoxification process is unimportant. KEY WORDS. PSP Detoxification lunetics Salinity
.
Temperature . Seston volume . Phytoplankton concentration Body w e ~ g h t . Mussel Gymnodini~lm catenatumINTRODUCTION
The incidence of phycotoxins is having a very adverse effect upon bivalve culture all over the world (Shumway et al. 1988, Shumway 1990, Shumway & Cembella 1993). Paralytic shellfish poisoning (PSP) toxins have a prominent place among these com-
'E-mail: [email protected]
"Present address: Centro Costero d e Vigo, Instituto Espaliol de Oceanografia, Aptdo 1552, E-36280 Vigo, Spain
pounds. Their high toxic power together with the bivalve's ability to accumulate them make it possible for these organisms to attain concentrations that can seriously threaten the health of the consumer. In order to avoid this risk many countries have implemented monitoring programmes which include early detection of toxic episodes a n d diverse mechanisms to prevent contaminated products from reaching the market. These mechanisms, mostly of collecting and marketing closures, result in immediate financial losses and cause major disruptions in the culture cycle.
0 Inter-Research 1997
166 Mar Ecol Prog Ser 158: 165-175, 1997
The development of dynamic models linking toxic cell concentration and environmental variables with toxin accumulation in the bivalve body could provide a very valuable tool for predicting the timing and dura- tion of the closure periods and for optimizing culture conditions. Thus, such models may partially mitigate the economic losses and increase the safety levels of the monitoring programmes. Notwithstanding, there have been very few attempts in this direction: see Silvert & Subba Rao (1992), Blanco et al. (1995) and Silvert & Cembella (1995). Only the last-mentioned study deals with PSP toxins and only the first one addresses a n environmental condition (temperature).
The strong dependence of bivalve feeding behaviour and metabolism on the environmental conditions has been reported in a number of studies (Bayne et al. 1976a, b, Hawkins & Bayne 1992); hence toxin assimi- lation and detoxification should also be affected by en- vironmental conditions. There is evidence, from field studies, that this effect actually exists (Sampayo et al. 1990, Shumway 1990, Marcaillou-LeBaut et al. 1993) but it may b e masked by the different behaviour of tox- ins in the different body tissues. Blogoslawski & Stew- art (1978), Cembella et al. (1993), and Bricelj & Cem- bella (1995) have shown that the digestive gland, gill, muscle, mantle, gonad and kidney differ substantially in their ability to accumulate toxins. Cembella et al. (1993) reported that in Placopecten magellanicus a n d Spisula solidissima this difference in accumulation is due to clearly differentiated intoxication and detoxifi- cation kinetics. This type of tissue-specific kinetics suggests that when modelling changes in global toxin concentration in bivalves it is necessary to include a s many compartments as tissues. The models derived talung these considerations into account would include a n excessive number of variables a n d rates, which may be attributed to 2 additional aspects: (1) toxins a r e not only eliminated from tissues but also transferred be- tween them, and (2) the environmental variables prob- ably affect the detoxification rates a n d transfer rates. Consequently, these models would be impractically complex. Nevertheless, in some species in which body mass or affinity for toxins is clearly biassed towards one or a few tissues, or in which several compartments have similar kinetics, the aforementioned complex models can be adequately replaced by others contain- ing only 1 or 2 compartments.
In this study w e examine the adequacy of both 1- and 2-compartment models to describe the detoxifica- tion kinetics of PSP toxins in mussels Mytilus gallo- provincialis previously exposed to a Gymnodinium catenatum bloom, a s well a s the effects of tempera- ture, salinity, seston volume, phytoplankton concen- tration a n d body weight on the detoxification rates obtained.
MATERIAL AND METHODS
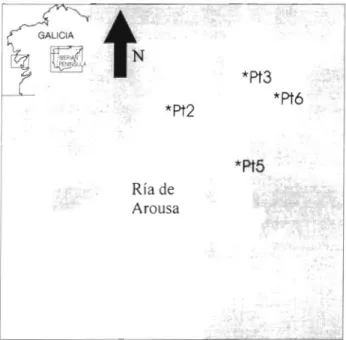
Sampling and analysis. In November 1994, mussels intoxicated by a bloom of Gymnodinium catenatum, which had started 12 d earlier and persisted on the sampling date, were collected from Bueu (Ria d e Pon- tevedra, Spain), then placed into 1 cm mesh-size cul- ture baskets, a t a density of 60 mussels per basket, and transferred to the Ria de Arousa, where they were dis- tributed among 4 rafts (Fig. 1) at 2 depths (3 and 8 m ) . The sampling points were chosen from the 10 points at which the Centro para o Control d a Calidade do Medio Maririo (Conselleria d e Pesca, Xunta d e Galicia, Spain) weekly monitors the principal physical, chemical, and biological oceanographic variables. These points and depths were chosen for the following reasons: (1) they have a low probability of reintoxication; and (2) they constitute the set of stations and depths that had, dur- ing November and December of the 3 previous years, the minimal covariation of salinity, temperature, fluo- rescence and light transmission. The probability of reintoxication was quantified using data on the con- centration of G. catenatum, and it was considered absolutely indispensable to study the detoxification kinetics w~thout the strong interferences that reintoxi- cations may introduce. It was also considered highly advisable to minimize the collinearity among the envi- ronmental variables, and thus provide good estirna- tions of their individual effect on the detoxification rate (which is increasingly inaccurate as collinearity in- creases). This was accomplished by means of the prin- cipal component analysis (PCA) of the above-men- tioned data.
. .
Ria de
.
dArousa
Blanco e t al. PSP detoxification k i n e t ~ c s 167
Over a 70 d period, samples of 20 mussels were col- lected from each point a n d depth, first on a weekly basis and later at longer intervals as detoxification slowed up.
Mussels were measured, weighed a n d all the tissues homogenized. The toxins contained in a 10 g aliquot were extracted by mixing the aliquot vigourously with 10 m1 of HCl 0.1 N; the mixture was centrifuged (1000 X g ) , recovering the supernatant. The 2 previous steps were repeated twice with 5 m1 of HC1. Finally, the total supernatant was brought to 20 m1 and the pH adjusted with HC1 to 3-4.
Toxin analyses were carried out by HPLC follow- ing the procedure proposed by Franco & Fernandez (1993). The identification a n d quantification of C1 a n d C2 toxins were carried out by means of hydrolysis a n d the subsequent determination of Gonyautoxin 2 (GTX2) a n d Gonyautoxin 3 (GTX3). The standards of these 2 toxins were provided by the National Research Council of Canada. The quantification of decarbamoyl- Saxitoxin (dcSTX) was m a d e with standards provided by the Bureau Communitaire d e Reference (European Union).
Temperature, salinity, light transmission and in vivo fluorescence of chlorophyll a were sampled twice a week during most of the experiment, with a Sea-
ENVIRONMENT
-
e
2%
: a 2
without environ. U g p With linear control mental effed of the environment fixed rate.
%Ss
rate variable with conditions.Q 3
a
.X1
1
MUSSEL ENVIRONMENT Comp. I Transference 1' 1
detox,,
Bird 25 conduct~vity/temperature/depth profiler (CTD) equipped with a Seatech Fluorometer a n d Trans- missometer.
The effects of the environmental conditions and wet body weight on the detoxification rate was quantified by multiple regression with backwards elimination using the Minitab 10xtra Statistical Package. A PCA was also carried out with the same package in order to detect collinearity between the predictor variables in the regression. Three types of estimations based on the regression analysis were m a d e : (1) individual estima- tions, including each detoxification period; (2) global estimation, including all detoxification data obtained during the experiment; and (3) partial estimations, including the f ~ r s t (fast) detoxification perlod to esti- mate the detoxification rate of the first compartment and the last 3 to estimate the rate of the second com- partment.
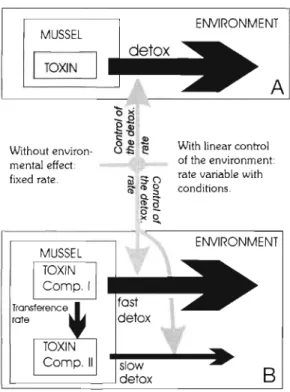
Models. Two models w e r e used -in relation to d e - toxification: l - a n d 2-compartment (Fig. 2). The 1- compartment model assumed that the entire toxicity in the mussel body is not affected or is affected in the same way in all body tissues by the environmental variables and body weight. The relationship, there- fore, was assumed to b e constant or linear, thus:
DTR = K (fixed rate model) or
DTR = a
+
b X Salinity + c X Temperature+
d X Fluorescence+
e X Transmittance+
f X Body weight (variable rate model) a n dwhere K = constant, TOX = total toxin concen- tration, DTR = detoxification rate a n d a to f a r e con- stants.
The 2-compartment model also assumed that d e - toxif~cation rates were constant or linearly related to the environmental conditions a n d body w e ~ g h t , but different depending on the compartment. I t was also assumed that a toxin flow from compartment 1 (rapid detoxification) to compartment 2 (slow detoxification) existed.
DTRl = Kl (fixed rate model) or
DTRl = a l
+
b 1 X Salinity+
c l temperature + d , X Fluorescence+
e , X Transmittance+ f,
X Body weight (vanable rate model) DTR* = K2 (fixed rate model)or Fig 2 Conceptual representation of t h e (A) l - c o m p a r t m e n t D T R ~
= a 2 + b 2 salinity + c 2 T~~~~~~ ture + d 2 a n d (B) 2 - c o m p a r t m e n t m o d e l s . T h e solid a r r o w s r e p r e s e n t
Fluorescence
+
e2 X Transmittance+ f2
X toxin flows a n d g r e y o n e s r e p r e s e n t t h e e n v i r o n m e n t a l c o n -I trol of t h e rates
168 Mar Ecol Prog Ser 158: 165-175, 1997
and
d(TOX1 ) = - DTR, X TOXI - CR x TOXI d t
d(T0X2 ) = - DTR2 x TOX2
+
CR X TOX, d twhere CR is the transport rate from the first to the second compartment and all the remaining abbrevia- tions are the same a s in the previous model. The numerical subindices indicate the compartment.
Detoxification rates between consecutive sampling dates were computed by means of the following expression:
where DTRjk is the detoxification rate from Day i to Day k and TOXi a n d TOXk a r e the toxicities measured on the corresponding days.
RESULTS
Environmental variables a n d body weight The environmental conditions and body weight changed in both time and space (Fig. 3). The tempera- ture fluctuation throughout the period studied was
2.2"C (ranging from 13 to 15.2'C). The experiment was carried out during a typical winter situation, with thermal inversion, and therefore with higher tem- peratures at the bottom than at the surface. Salinity was directly related to temperature and also exhibited the lowest values at the surface. It ranged from 27.3 to 34.4% over time. The range of the spatial change of this variable was lower than in temporal variation, but in all cases it was greater than 1%. Both spatial and temporal differences were smaller at the bottom that at the surface. Fluorescence and light transmission also showed great spatial and temporal differences. Fluo- rescence varied during the experiment from less than 0.08 relative units (r.u.) to 0.63 r.u. (roughly equivalent to 0.3-1.9 pg of chlorophyll a I-'), having a maximum range among all the sampling points and depths (on the same day) of ca 0.45 r.u. Light transmission also varied greatly during the experiment (from 60 to go%), but its maximum range among the sampling points a n d depths (on the same day) was the smallest (in relative terms) of the variables considered (12 %). Body weight also exhibited great differences a n d a slightly ascend- ing general trend. Only in 2 out of the 8 sampling points was the final body weight lower than the initial weight. Moreover, these 2 points are also the ones with the greatest fluctuations in salinity during the period studied.
Toxin profile
The toxin profile of the mussels found Temperature Salinity Fluorescence Light Transmission Body Weight in this study was characterized by high "C %, Relative Units Percentage Grams relative proportions of C l , C2 and decarbamoylSaxitoxin (dcSTX) as well as by the presence of C 3 , C4, GTXG, GTX5, GTX2+3 in small amounts and traces of Neosaxitoxin (NeoSTX). We have considered only the first 3 toxins cited as they represent most of the toxi- city in the mussels and, in addition, we have reliable standards for these toxins. Throughout the experiment c o appar- ent change in the relative contribution of these 3 toxins in relation to the remaining ones was observed by the visual examination of the chro- matograms.
0 14 33 69 0 14 33 69 0 14 33 69 0 14 33 69 0 14 33 69 7 22 46 7 22 46 7 22 46 7 22 46 7 22 46
DAYS OF
EXPERIMENTDetoxification rates
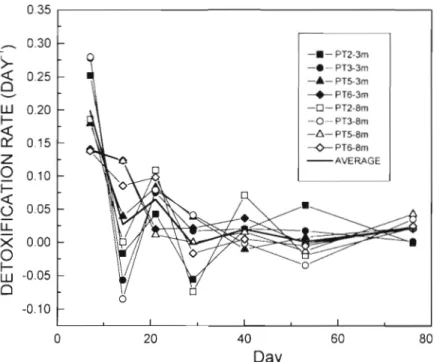
Fig. 3. Evolution of the environmental variables and mussel fresh body weight Detoxification rates varied between during the experiment. Fluorescence is expressed in relative units and Light 0.27 and -0.08 d-l (both values re-
Blanco et al.. PSP detoxification kinetics 169
Fig. 4 . Variation of the detoxification rates during the experiment at the different depths and sampling points (Pt)
depth). Average values of the 8 sam- pling points ranged approximately from 0.20 to 0 d-l. They showed a decreasing trend during the first 3 wk of the ex- periment and then stabilized at low values (Fig. 4 ) .
Regression analysis of the detoxification rates
When the detoxification rate was ad- justed by multiple regression with the 5 variables considered in this study, both the significance levels and the relevant variables (those included in the final step of the backwards elimination multi- ple regression) showed differences on the different sampling dates (corre- sponding to the detoxification penods). In the second, fourth and fifth detoxifica- tion periods the regression was not sig-
FLUORESCENCE
0.5 BODY WEIGHT TEMPERATURE
SALINITY TRANSMISSION
SALINITY TRANSMISSION
Fig. 5. Loadings of the envi- 0.0
TEMPERATURE sel fresh body weight on the
ronmental variables and mus-
a
first 2 principal components-0.51
I
(PC1 and PC2) extracted from
-1.0 -0.5 0.0 0.5 1.0 -1.0 -0.5 0.0 0.5 1.0 TRANSMISSION -
-
FLUORESCENCE I 1.o
0.5- N 0.0 0a
-0.5- -1 .othe data corresponding to the (A) first (Days 0 to 7), (B) third
Days 14 to 21), (C) sixth (Days -1 .O
40 to 53), and (D) seventh -1.0 -0.5 0.0 0.5 1.0 -1.0 -0.5 0.0 0.5 (Days 53 to 76) detoxification periods
Pc1
Pc1
TRANSMISSION ¤ - FLUORESCENCE..
I ' 1.0- . 0.5- O.O . -0.5- -1.o
- A
TEMPERATURE'.
SALINITY.m
BODY WEIGHT I '.
l .B
BODY.
WEIGHT ?TEMPERATURE SALINITY I 'Mar Ecol Prog Ser 158: 165-175, 1997
nificant. In the first period, light transmission, salinity
and body weight were the relevant variables, the first
variable having a negative coefficient and the last 2 being positive. In this case, the regression fitted very well, which would explain the highest percentage of variance found in the 7 detoxification periods (92.4 %). PCA showed that salinity, body weight and, to a lesser extent, temperature, were related to PC1 (Fig. SA), making it impossible to distinguish the individual par- ticipation of each variable. In the third period, only
body weight had a significant effect, but opposite to that which it had in the first period. As in the previous case, it was strongly related to PC1 (Fig. 5B), to which salinity a n d temperature were also highly related. In the sixth period, temperature had a negative effect, but
the percentage of variance explained was only 51 % of the total variance. In this case, temperature was closely related to salinity (r = 0.93) and therefore the effects of these two cannot be distinguished (Fig. 5C). In the sev- enth period the variance explained (86 %) was the sec- ond highest (after the first period) and temperature and body weight were the relevant variables, both
having positive coefficients. In this case all variables had high loadings on PCI, so it is again impossible to quantify their individual effect (Fig. 5D).
In addition to the previous 'per sample period' esti- mations, the integration of the environmental variables a n d body weight into the proposed models required some model-specific regression analyses. Thus, the 1-
compartment model assumes that all the toxins in the mussel body behave in the same way at any given time a n d , consequently, a unique regression (including all
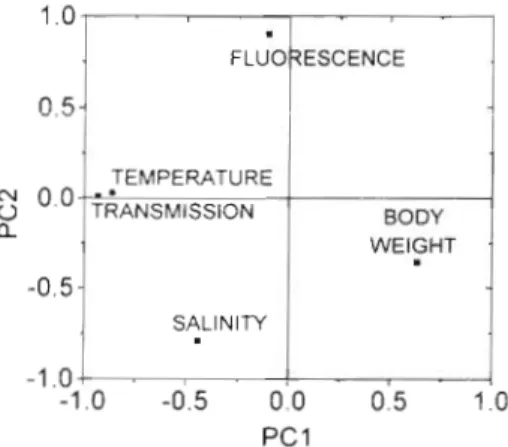
the data in the experiment) between the detoxification rate a n d the same predictor variables as in the previ- ous cases should be used. In this regression, only tem- perature and salinity were found to make a relevant contribution, accounting for 36 O/o of the total variance.
-0.5
SALINITY
Fig. 6. Loadings of the environmental variables and mussel fresh body weight on the first 2 principal components
extracted from all the data obtained in the experiment
The equation obtained was:
DTR = -0.39 - 0.0229 X Salinity
+
0.081 X Temperature The PCA extracted 2 components, the first with high loadings of temperature and light transmission (both positive), and the second with a highly negative load- ing on sallnity and positive in the case of fluorescence (Fig. 6). In consequence the effects of the variables of each pair cannot be individualized.The assumption that a 2-compartment model cor- rectly describes the detoxification kinetics implies that if the detoxification rates are affected by the environ- mental variables, then they might be affected differ- ently in each compartment. In this case we assumed that the first detoxification data (from the first to the second week) represented the actual values of the first, more dynamic compartment, and from the third obser- vation to the end, represented the values of the second compartment.
During the first detoxification period, the regression equation obtained was:
DTR, = 1.50
+
0.0829 X Salinity - 0.0567 X Trans- mittance+ 0.0677
Body weightLight transmission a n d salinity were highly corre- lated during this period. The pairs salinity-temperature and light transmission-fluorescence also had high correlation coefficients.
After the third week of the experiment the detoxifi-
cation rates correlated poorly with the environmental variables. Fluorescence was the only one that affected
them significantly but it explained a reduced variance
percentage (about 18%)). The relation is expressed as: DTR2 = -0.0221
+
0.31997 X Fluorescence During this period, fluorescence did not correlate well with any other predictor variable and therefore no influence of these variables on the regression equation can be expected.Fixed rate models
When a model having a unique compartment with fixed detoxification rates (not affected by environmen.- tal variables) was fitted, the actual toxicity values sys- tematically deviated from the model (Fig. 7A). The first observation fell below the expected toxicities, while all the rest were higher than expected. Therefore, there was a n obvious lack of fit due to the structure of the model rather than to error. In this case, a detoxification rate of 0.15 d-' produced the best fit.
In a 2-compartment model with fixed detoxification rates for each compartment, it is necessary to estimate 4 parameters: the 2 detoxification rates, the net trans-
Blanco et al.: PSP detoxificat~on kinetics 171
-
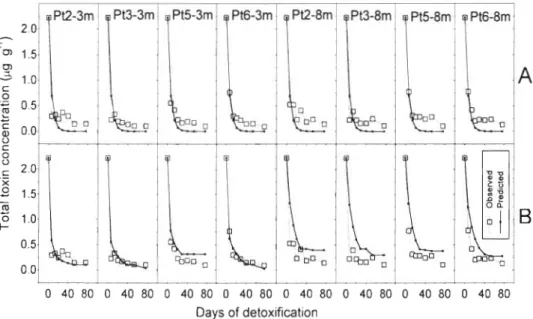
Fig. 7. Detoxification kinetics and fitted l-compartment mod- els for each sampling point (Pt) Series A shows the fitted fixed rate model (\v~thout environ- mental effect) a n d series B the corresponding vanable rate models (environmentally deter- mined rates). Toxin concentra- tion is expressed a s pg of total
toxins per g of mussel meat Days of detoxification
fer rate between compartments and the initial propor- tion of toxicity in each compartment. When this model was implemented, the predictions obtained fitted the actual data much more accurately than those obtained using the l-compartment model (Fig. 8 A ) . In this case, the systematic deviation disappeared; only on the sec- ond day did we observe a noticeable discrepancy at almost all of the sampling points and depths. In this case, the estimated detoxification rates were 0.21 and 0.02 d-' for the first ( C o m p l ) and the second (Comp2) compartments respectively. The initial proportions of the toxic pools were 93% in Compl and 7 % in Comp2 a n d the rate of change from Compl to Comp2 was 0.09 d-'.
Fig. 8 Detox~fication kinetics and fitted 2- compartment models for each sampling point (Pt). Series A shows the fitted fixed rate model (without envi- ronmental effect) and series B the corresponding variable rate models (environmentally determined rates). Toxin con-
Variable rate models
When the environmental variables were considered in the model (by linearly determining the detoxifica- tion rates; Fig. 2), toxicities generally had a better fit than with the corresponding (1- or 2-compartment) fixed rate models. The l-compartment model, in which the detoxification rates were estimated from the 5 vari- ables studied by multiple regression, provided a better fit than its fixed rate counterpart at some of the sam- pling points. However, a t others it was not as good (Figs. ?B & 8B). Fitting was better at sampling points located at the surface rather than at the bottom, 0.065 d-' and 90.8% respectively.
centrat~on 1s expressed as pg I-1. .- L . . - I - - - l-. . ._-I
of total toxlns Der
.
a " of mussel 0 40 80 0 40 80 0 40 80 0 40 80 0 40 80 0 40 80 0 40 80 0 40 80Mar Ecol Prog Ser 158: 165-175, 1997
0 10 20 30 40 50 60 70 80
DAYS OF EXPERIMENT
Fig. 9. Variation of the proportions between toxins during the detoxification period. Outliers are not shown
Differences between toxins
The 3 toxins under consideration did not behave in a uniform way. C1 and C2 were well correlated (r = 0.767) but they both showed a poor correlation with dcSTX (r = 0.587 a n d r = 0.318, for C1 and C2 respec- tively). Correlations between their detoxification rates were lower than between concentrations. Only in the case of the C1 detoxification did the environmental variables account for more than 20 % of the total vari- ance (25%). The relative contribution of each toxin to the total toxin concentration was also variable and independent of the environmental conditions and body weight, although a parabolic evolution may be ob- served over time in the relationship between the 2 C toxins a n d dcSTX (Fig. 9).
DISCUSSION
The toxin profiles observed matched those reported for proliferations of Gymnodinium catenatum very we11 (Anderson et al. 1989, Franca et al. 1993, Oshima et al. 1993), which would suggest that toxins were not sub- stantially transformed by the metabolism of the mussel. Detoxification rates found in this study fit in the range of values obtained by other authors for PSP in mussels (Sommer & Meyer 1937, Aatvik & Framstad 1981, Lassus et al. 1989, Chebib e t al. 1993, Silvert &
Cembella 1995). They are also within the range corre- sponding to other toxins such as Domoic acid (Silvert &
Subba Rao 1992, Wolgeschaffen et al. 1992) or diar- rhetic shellfish poisoning (DSP) (Haamer et al. 1990, Marcaillou-Lebaut et al. 1993, Blanco et al. 1995).
It seems apparent that, regardless of external factors, there was a progressive decrease in the detoxification rates as detoxification progressed. This decreasing trend is not constant: the rate is high during early de- toxification and drops to almost zero after several weeks. When the total toxin concentration is examined instead of the corresponding rates, the evolution may be described as a detoxification in 2 phases: a fast one, which takes place during the early detoxification period, and a slow one, lasting from the end of the first phase to the end of detoxification. This type of 2-phase kinetics was found by Silvert & Cembella (1995), Lassus et al. (1989), Bricelj et al. (1991) and White et al. (1993) for PSP toxins and by Marcaillou-Lebaut et al. (1993) for DSP toxins. It was also mentioned by Shumway (1990) a s the usual detoxification behaviour. The progressive decrease in the detoxification rate indicates that the kinetics of this process only appears to have 2 phases, a n d that it is actually a continuous process. In our opinion this process has 2 components: the metabolic faecal losses and the elimination of the toxic cells and cell fragments from the digestive sys- tem. Hawkins & Bayne (1984) and Hawkins et al. (1990) showed that metabolic faecal losses are relevant to mussels even at the level of the energetic balance of nutrition. These losses take place when the old cells of the digestive tubules break down and their con- stituents are released into the tubule lumen, to be dis- carded later with faeces. When this mechanism is com- bined with the high and unspecific binding of the PSP toxins by the cell membranes of the digestive gland (Louzao et al. 1992), it may cause the progressive decrease of the detoxification rate in accordance with the following description. During the process of intoxi- cation, due to the high affinity of the membranes for PSP toxins, the older (and outer) cells should accumu- late most of the toxin and only a small fraction of it should be transferred to the inner cells or to other tis- sues. When intoxication ceases, the first cells involved in the metabolic faecal losses are the outer (and the most toxic) ones, which transfer their toxicity to faeces and thus produce a strong decrease in toxicity. We think that this process may be supplemented by the elimination of the toxic phytoplankton cells and cell fragments from the digestive, as suggested by Silvert & Cembella (1995) and Bricelj & Cembella (1995). How- ever, we do not consider the latter process to be the only mechanism involved in the rapid initial detoxi- fication for 2 reasons: (1) only a small amount of toxin (relative to the initial amount) remains in the bivalves
Blanco et al.: PSP del
after the first few days of detoxification, which would seem unlikely if a structure-the digestive gland tubules-with a very high binding capacity for PSP is involved in the process; a n d (2) in some cases the number of cells needed to fill the entire digestive sys- tem contain fewer toxins than those released during the initial detoxification.
Toxins a r e stored in varying quantities in different body tissues (Blogoslawski & Stewart 1978, Beitler & Liston 1990, Bricelj et al. 1990, 1991, Martin et al. 1990, Cembella et al. 1993, Cembella e t al. 1994, Bricelj & Cembella 1995, Cembella & Shumway 1995), so we would expect to find a detoxification behaviour based on a number of compartments. It is obvious from our results that detoxification kinetics cannot be correctly described by means of a l-compartment model. A 2- compartment model, however, seems to offer a n ade- quate description of the detoxification process even when the actual situation is much more complex. Using the analysis of a toxicity time series including 2 PSP episodes, Silvert & Cembella (1995) found that a 2-compartment model w a s sufficient to describe the toxin kinetics in another mussel (Mytilus edulis), which agrees with our findings.
Environmental conditions a n d body weight affected detoxification, but their importance varied in time. T h e regression estimation corresponding to each period suggests that the first period was the period most affected by environmental conditions and body weight. Salinity had a positive effect perhaps because of reduced filtration rates a t low levels of this factor, as suggested by the decrease in body weight at the sam- pling points with the least salinity, or perhaps because it is inversely related to the fluorescence, which is a n index of phytoplankton concentration, a s shown in PCA. In this case, a s in many others commonly found in nature, the precedence of factors has to b e analysed with caution, given that in well-correlated pairs the factor measured with the greatest error (in this case fluorescence) is excluded from the regression by the process of backwards elimination.
Light transmission had a negative effect, which means that seston volume has a positive effect. There are a number of mechanisms that may help provide a n explanation of this relationship a n d also of the possible effect of fluorescence. However, in our opinion, the most likely explanation is the effect of the seston volume on the digestive processes a n d , in particular, on metabolic faecal losses. The rates of both processes a r e strongly affected by the volume of seston ingested a n d therefore depends on the filtrationhngestion rate a s well a s on the seston concentration in volume.
Body weight seems to have varying effects during the different detoxification periods. In the 3 cases which showed a direct relationship (positive coefficient) the
effect may be explained by the toxin dilution effect produced by the increase in biomass a s was observed by Bricelj & Cembella (1995). If the biomass increases a n d the toxin content remains unchanged, then the toxin/biomass ratio decreases. We cannot explain the inverse response found in a n additional case, but this case was also the only o n e in which the loading of this variable on PC2, which is related to food availability, w a s opposite to that of fluorescence, indicating that body weight increase was not related to food resources. Therefore, the most likely explanation would b e that this was the effect of a sampling error.
Temperature also presented positive a n d negative coefficients. In 2 out of 3 detoxification periods, the coefficients were positive as was the case in the last period, in which the regression coefficient for tem- perature was significant a n d the total explained vari- ance was high. Our data a r e not consistent enough to b e able to offer a n unequivocal description of the effect of temperature throughout the entire detoxification period, although it seems to b e more positive towards the e n d of the detoxification period.
An analysis of the effect of the inclusion of the envi- ronmental factors in the 1- or 2-compartment models shows that, in general, the fit is better w h e n these factors a r e included than when they a r e not included, which would suggest that the variables considered have a real effect on the detoxification kinetics. Not- withstanding, the increase in the fit of the 2-cornpart- ment model with environmental factors was not sub- stantially better than the fit of the 2-compartment model without environmental factors. Additionally when the main discrepancies a r e analysed, they exhibit a clear pattern. In the case of the l-compart- ment model, the detoxification corresponding to all the bottom (8 m) sampling points w a s underestimated by the model, a n d in the 2-compartment model the d e - toxification a t sampling point 2 is overestimated. Therefore, the discrepancies a r e most likely d u e to other variables not considered in this study rather than to a n intrinsic lack of fit of the model including envi- ronmental variables. It also seems obvious that in some cases the inclusion of environmental variables may partially account for some variation that may also b e attributed to the inclusion of the second compartment. This means that the quantification of the effect of the environment depends on the model assumed for the detoxification kinetics. Therefore, in order to deter- mine the real extent of environmental control it would b e necessary to measure the actual toxicities in each compartment.
Even though interconversions between PSP toxins have been observed in shellfish (Sullivan e t al. 1993, Oshima 1995), n o clear evidence was observed in our study.
Mar Ecol Prog Ser 158: 165-175, 1997
LITERATURE CITED
~ a t v i k B, Framstad K (1981) Assay and detoxification experi- ments with mytilotoxin in mussels (Mytilus edulis L.) from
NordBsstraumen, Western Norway. Sdrsia 66:143-146 Anderson DM, Sullivan J J , Reguera B (1989) Paralytic shell-
fish poisoning in NW Spain: the toxicity of the dinoflagel-
late Gymnodinium catenatum. Toxicon 27(6):665-674 Bayne BL, Thompson RJ, Widdows J (1976a) Physiology I. In:
Bayne BL (ed) Manne mussels: their ecology and physio-
logy. Cambridge University Press, Cambridge, p 121-206
Bayne BL. Widdows J , Thompson RJ (1976b) Physiology 11. In:
Bayne BL (ed) Marine mussels: their ecology and physio- logy. Cambridge University Press, Cambridge, p 207-260 Beitler MK, Liston J (1990) Uptake and tissue distnbution of PSP toxins in butter clams. In: Graneli E, Sundstrom B,
Edler L. Anderson DM (eds) Toxic marine phytoplankton. Elsevier, New York, p 257-262
Blanco J. Fernandez M, Manno J , Reguera B, Miguez A, Maneiro J , Cacho E, Martinez A (1995) From Dinophysis spp. toxicity to DSP outbreaks: a preliminary model of toxin accumulation in mussels. In: Lassus P, Arzul G , Erard E, Gentien P, Marcaillou C (eds) Harmful marine algal blooms. Lavoisier. Intercept Ltd, Paris
Blogoslawski WJ, Stewart ME (1978) Paralytic shellfish poi- son in Spisula solidissima: anatomical location and ozone detoxiflcation. Mar Biol 45:261-264
Bricelj VM, Cembella AD (1995) Fate of gonyautoxins in surf- clams, Spisula solidissima, grazing upon toxigenic Alex- andrium. In: Lassus P, Arzul G, Erard E, Gentien P, Mar- caillou C (eds) Harmful marine algal blooms. Lavoisier, Intercept Ltd, Paris, p 413-418
Bricelj VM, Lee JH, Cembella AD (1991) Influence of dino-
flagellate cell toxicity on uptake and loss of paralytic shell- fish tox~ns in the northern quahog Mercenana mercenaria. Mar Ecol Prog Ser 74:33-46
Bricelj VM, Lee JH, Cembella AD, Anderson DM (1990) Uptake and kinetics of paralytic shellfish toxins from
the dlnoflagellate Alexandrium fundyense in the mussel Myllus edulis. Mar Ecol Prog Ser 63:177-188
Cembella AD, Shumway SE (1995) Anatomical and spatio- temporal variation in PSP toxin composition in natural populations of the surfclam Spisula solidissima In the Gulf of Maine. In: Lassus P, Arzul G, Erard E, Gentien P, Mar- caillou C (eds) Harmful marine algal blooms. Lavoisier, Intercept Ltd, Paris, p 421-426
Cembella AD, Shumtvay SE, Larocque R (1994) Sequestering
and putative biotransformation of paralytic shellf~sh toxins
by the sea scallop Placopecten magellanicus: seasonal and
spatial scales in natural populations. J Exp Mar Biol Ecol 18O:l-22
Cembella AD, Shumway SE, Lewis NI (1993) Anatomical dis-
tribution and spatio-temporal variation in paralytic shell- fish toxin composition in two bivalve species from the Gulf
of Maine. J Shellfish Res 12(2):389-403
Chebib H, Cembella AD, Anderson P (1993) Differential paralytic shellfish toxin accumulation and detoxification lunetics in transplanted populations of Mytilus edulis exposed to natural blooms of Alexandrium excavatum. In: Smayda TJ, Shmizu Y (eds) Toxic phytoplankton blooms
at the sea. Elsevier, Amsterdam, p 383-388
Franca S, Alvito P, Sousa I, Mascarenhas V (1993) The dino- flagellate Gymnodinium catenatum isolated from the
coast of Portugal: observat~ons on development, toxicity
and ultrastructure. In: Srnayda TJ, S h m z u Y (eds) Toxic phytoplankton blooms at the sea. Elsevier, Amsterdam, p 383-388
Franco JM, Fernandez P (1993) Separation of PSP toxlns by RP-HPLC, with postcolurn reaction and fluorometric
detection. Chromatographia 35:613-620
Haamer J, Andersson PO, Lange S, Li XP, Edebo L (1990)
Effects of transplantation and reimmersion of mussels Mytdus eduLis Linnaeus, 1758, on thelr contents of okadaic acid. J Shellfish Res 9:109-112
Hawkins AJS, Bayne BL (1984) Seasonal variation in the bal-
ance between physiological mechanisms of feeding and
digest~on in Mytilus edulis (Biva1via:Mollusca) Mar Biol
82:233-240
Hawkins AJS, Bayne BL (1992) Physiological interrelations,
and the regulation of production. In: Gossling E (ed) The
mussel Mytilus: ecology, physiology, genetics and culture. Elsevier, Amsterdam, p 171-222
Hawkins AJS, Navarro E, Iglesias JIP (1990) Comparative allometries of gut content, gut passage time and metabolic faecal loss in Mytilus edulis and Cerastoderma edule. Mar Biol 105197-204
Lassus P, Fremy JIM, Ledoux M, Bardouil M, Bohec M (1989) Patterns of experimental contamination by Protogony- aulax tamarensis in some French commercial shellfish. Toxlcon 12:1313-1.321
Louzao MC, Lopez-Corona PP, Vieytes MR, Botana LM (1992) Union de saxitoxina a receptores d e fracciones celulares hepatopancreas de mejillon Mytilus galloprovincialis Lmk. Cuad Area Clencias Mannas, Seminario de Estudos Gale- ~ O S 665-72
Marcaillou-Lebaut C, Bardin B, Bardouil M, Bohec M, Le
Dean L, Masselin P, Truquet P (1993) DSP depuration rates of mussels reared in a laboratory and an aquaculture
pond. In: Smayda TJ, Shimizu Y (eds) Toxic phytoplankton blooms at the sea. Elsevier, Amsterdam, p 531-535 Martin JE, White AW, Sullivan JJ (1990) Anatomical distribu-
tion of paralytic shellfish toxins in soft-shell clams. In. Graneli E, Sundstrom B, Edler L, Anderson DM (eds) Toxic marine phytoplankton. Elsevier, New York, p 379-384
Oshima Y (1995) Chemical and enzimatic transformation of
PSP toxins in marine organisms. In: Lassus P, Arzul G , Erard E, Gentien P, Marcaillou C (eds) Harmful marine
algal blooms. Lavoisier, Intercept Ltd. Paris, p 475-480
Oshima Y, Itakura H, Lee KC, Yasumoto T. Blackburn S, Hallegraeff G (1993) Toxin production by the dinoflagel-
late Gymnodinium catenatum. In: Smayda TJ, Shimizu Y (eds) Toxic phytoplankton blooms at the sea. Elsevier, Amsterdam, p 907-912
Sampayo MA, Alvito P, Franca S, Sousa I (1990) Dinophysis spp toxicity and relat~on to accompanying species. In. Graneli E. Sundstrom B, Edler L, Anderson DMM (eds) Toxic marine phytoplankton. Elsevier, New York. p 215-220
Shumway SE (1990) A review of the effects of algal blooms
on shellfish and aquaculture. J World Aquacult Soc 21(2): 65-104
Shumway SE, Cembella AD (1993) The impact of toxic algae
on scallop culture and fisheries. Rev Fish Aquat Sci 1: 121-150
Shumway SE, Sherman-Caswell S, Hurst JW (1988) Paralytic shellfish poisoning in Maine: monitoring a monster. J Shellfish Res 7(4):643-652
Silvert W. Cembella AD (1995) Dynarmc modelling of phyco- toxin lunetics in the blue mussel. Mytilus edulis, with implications for other marine invertebrates. Can J Fish Aquat Sci 52.521-531
Silvert W, Subba-Rao DV (1992) Dynamic model of the flux of domoic acid, a neurotoxin, through a Mytilus edulis population. Can J Fish Aquat Sci 49:400-405
Blanco et al.: PSP detoxification kinetics 175
Sommer H, Meyer KF (1937) Paralytic shellfish poisoning. Arch Path01 24:560-598
Sullivan JJ, lwaoka WT, Liston J (1993) Enzymatic trans- formation of PSP toxins in the littleneck clam (Protothaca staminea). J Biochem Biophys Res Comm 114:465-472 White AW, Nassif J , Shumway SE, Whittaker DK (1993)
Recent occurrence of paralyt~c shellfish toxins in offshore Editonal responsibility: Otto Kinne (Edltor),
Oldendorf/Luhe, Germany
shellfish in the Northeastern United States. In: Smayda TJ, Shimizu Y (eds) Toxic phytoplankton blooms at the sea. Elsevier, Amsterdam, p 435-440
Wohlgeschaffen GD, Mann KH, Subba Rao DV. Pocklington R (1992) Dynamics of the phycotoxin domoic acid: accumu- l a t ~ o n a n d excretion in two commercially important b~valves. J Appl Phycol 4:297-310
Submitted. March 18, 1997; Accepted. August 25, 1997 Proofs received from a uthor(s): October 17, 1997