THE INTERSECTION OF ENERGY AND
JUSTICE:
E
XPLORING THE
S
PATIAL
,
R
ACIAL AND
S
OCIOECONOMIC
P
ATTERNS OF
R
ESIDENTIAL
H
EATING
A
FFORDABILITY
,
C
ONSUMPTION AND
E
FFICIENCY
IN WAYNE COUNTY, MICHIGAN
DOMINIC J. BEDNAR
The Intersection of Energy and Justice: Exploring the Spatial, Racial and Socioeconomic Patterns of Residential Heating Affordability, Consumption and Efficiency in Wayne County,
Michigan
By Dominic J. Bednar
A thesis submitted in partial fulfillment of the requirements for the degree of
Master of Science (Natural Resources and Environment) at the University of Michigan
August, 2016
Faculty advisor(s):
Gregory A. Keoleian, Peter M. Wege Professor of Sustainable Systems, Tony G. Reames, Research Fellow
A
BSTRACTWithin the Detroit metropolitan area, some residents are crippled by the surmounting utility costs making it an arduous endeavor to adequately regulate temperatures in their homes for a reasonable cost given their income. Disparities in household income and energy affordability have been well studied; however, research on differences in the relationship between race, place and energy is lacking. This research explores these relationships using data from the U.S. Energy Information Administration’s Residential Energy Consumption Survey (RECS). Regression models were developed to predict annual heating energy consumption and energy use intensity (EUI). From these models, data from the U.S. Census Bureau were used to create small area estimates of mean annual heating energy consumption, EUI and energy affordability burden at the census block group level. Results were mapped using geographic information systems (GIS) to identify spatial patterns of energy consumption, efficiency and affordability in Wayne County, Michigan.
The results of this study reveal that spatial, racial and socioeconomic disparities in energy affordability, consumption and efficiency in Wayne County, Michigan exist. Spatial clustering of heating consumption, EUI and energy burden were evident within the Detroit metropolitan area. Higher levels of EUI and energy burdens were concentrated in the urban center of Detroit, while lower levels were found in the suburban areas of the county. There are no statistical relationships between race and heating energy consumption; however, block groups with higher percentages of African American and Hispanics householders have highly significant correlations with EUI, and indicate higher consumption per square foot. Significant correlations were also found between block groups with higher home ownership and income with lower heating EUI.
A
CKNOWLEDGEMENTSThough only my name appears on the cover of this master’s thesis, a great many people have contributed to its production. I owe my gratitude to all those people who have made this master’s thesis possible and because of whom, my graduate experience has been one that I will cherish forever.
I would first like to thank my thesis advisor Dr. Gregory Keoleian. I have been amazingly fortunate to have an advisor who gave me the freedom to explore on my own, and at the same time the guidance to recover when my steps faltered. Greg sets high standards for his students and he encourages and guides them to meet those standards. I am indebted to him for his continuous encouragement, guidance and belief in me as a scholar.
I am grateful to my co-advisor, Dr. Tony Reames for introducing me to the topic and for his encouragement and practical advice. I appreciate the long discussions that helped me sort out the technical details of my work. Tony taught me how to question my thoughts and how to best express my ideas. He consistently allowed this paper to be my own work, but steered me in the right the direction whenever he thought I needed it. His patience and support helped me
overcome many crisis situations and finish this thesis.
Many friends have helped me stay sane through these difficult years. Their support and care helped me overcome setbacks and stay focused on my graduate study. I greatly value their friendship and I deeply appreciate their belief in me.
My immediate family has been a constant source of love, concern, support and strength all these years. I would like to express my heart-felt gratitude to my family. My extended family has encouraged me throughout this endeavor, reminding me of the lost academic in the family – my grandmother.
My late grandmother, Ms. Louise Sanders whom this thesis is dedicated to continues to serve as my guiding light. Her continuous prayers for my prosperity in education imbued an everlasting flame within me that will never dim.
Finally, I must express my very profound gratitude to my parents, Carol and Joseph and to my girlfriend, Abisola for providing me with unwavering support and continuous encouragement throughout my years of study and through the process of researching and writing this thesis. This accomplishment would not have been possible without them. Thank you.
TABLE OF CONTENTS Abstract ... i Acknowledgements ... ii List of Tables ... iv List of Figures ... iv Introduction ... 1 Background ... 3 Fuel Poverty ... 3
Low Income as a Root Problem ... 5
Rising Energy Costs ... 6
Local Energy Consumption as a Global Issue ... 9
Energy Efficiency ... 10
Barriers to Retrofit ... 12
Targeting Fuel Poverty ... 14
Methodology ... 17
Description of Study Area ... 17
Data ... 21
Model Parameters ... 23
Specifying a Regression Model for Heating Energy Consumption and EUI ... 24
Small area Estimation for Wayne County ... 26
Results ... 28
Residential Heating Consumption ... 28
Residential Heating Energy Use Intensity (Efficiency) ... 29
Residential Heating Energy Burden ... 30
Statistical Evidence of Spatial Correlation ... 32
Conclusion ... 34
Policy Implications ... 36
Appendices ... 40
Appendix A: Henry Hub Natural Gas Spot Price ... 40
Appendix B: Support for low-income Energy Needs ... 41
L
IST OFT
ABLESTable 1: Regression Model Inputs and Results ... 26
Table 2: Pairwise Correlation to Estimated Heating Energy Consumption and Energy Use Intensity ... 34
L
IST OFF
IGURES Figure 1: Study Region: Wayne County, Michigan ... 18Figure 2: Median block group Household Income ... 19
Figure 3: Dot Density Map Illustrating Block Group Level Racial Residential Segregation ... 20
Figure 4: Median Block group Structure Year Built ... 21
Figure 5: Methodological Framework for Modeling and Mapping ... 24
Figure 6: Estimated Residential Heating Consumption in kBTU ... 29
Figure 7: Estimated Residential Energy Use Intensity (Efficiency) in kBTU/ft2 ... 30
I
NTRODUCTIONEach day, countless material hardships plague millions of Americans from securing food, medical care, housing and their ability to keep their keep their home powered through utility services. Following the Great Recession, nearly 14 million American households had utility bills in arrears, and 2.2 million households experienced utility shutoffs (Siebens, 2011). Households in the Detroit, Michigan metropolitan area were hit particularly hard during the Great Recession. A survey of material hardships in the period following found that one in two respondents
reported experiencing some type of material hardship (Gould-Werth and Seefeldt, 2012).
In the Detroit metro region, disparities in utility hardships were evident by socioeconomic status and race, with groups traditionally thought of as economically
disadvantaged experiencing higher rates of arrears and shutoffs. Low-income households were disproportionately more likely to have utility bill arrears and to experience a shutoff compared to higher income households. While roughly 14% of high-income households fell behind on utility payments, nearly 40% of low-income households reported being behind on utility payments (Gould-Werth & Seefeldt, 2012). Regarding utility shutoffs, two percent of high-income
households experienced utility disconnects compared to 14% of low-income households (Gould-Werth & Seefeldt, 2012). Moreover, blacks were almost twice as likely as non-blacks to report being behind on utilities payments and more than three times more likely to experience a utility service shutoff than non-blacks (Gould-Werth & Seefeldt, 2012).
household spends 7.2% of their annual income on residential energy costs, also known as their
energy burden – a key metric assessing the measure of utility hardship, the average low-income household has an energy burden nearly double that, spending 13.8% of annual household income on residential energy costs (U.S. Energy Information Administration [EIA], 2013a). Residential energy hardships often beget other material hardships, including housing, food insecurity and foregoing medical care (Dillman, Rosa, & Dillman, 1983).
Amid solutions to alleviate high energy burdens, energy efficiency improvements have proven instrumental in reducing residential energy consumption, associated fuel costs and greenhouse gas emissions. Studies exploring the spatial dynamics of residential energy find distinguishable disparities across regions (Reames 2014, Fahmy, Gordon, & Patsios, 2011, Min, Hausfather, & Lin, 2010). Yet, few interventions utilize systematic approaches to identify and target energy inefficient homes. Moreover, there are few studies that compare the spatial
correlation between residential energy affordability, consumption, efficiency, race/ethnicity and socioeconomic status for a more holistic understanding of residential energy dynamics across regions. This paper explores the interactions of spatial, racial and socioeconomic patterns of residential heating affordability, consumption and efficiency in Wayne County, Michigan. Alongside energy consumption and efficiency disparities, ineffective targeting of inefficient homes are highlighted as the impetus to fuel poverty in this study. The rest of the paper summarizes the development of two regression models using data from the EIA to estimate residential heating energy consumption and heating energy use intensity (EUI). Next, using geographic information systems (GIS) and U.S. Census block group level data, the spatial distribution of average residential heating energy consumption, EUI and heating energy burden
are estimated and mapped. Spatial distributions are then correlated with respective racial and socioeconomic characteristics of the block groups. Lastly, insights are provided on the future use of this study and the relative social, environmental and policy implications.
B
ACKGROUNDF
UELP
OVERTYEnergy burden disparities are better understood through the concept of fuel poverty. Fuel poverty is the interplay between low household incomes, rising energy costs and energy
inefficient homes (Boardman, 1991). Also referred to as energy insecurity (Hernandez, 2013), fuel poverty reflects an inability of a household to meet basic energy needs or to adequately heat or cool their home (Boardman, 1991). A household is considered fuel poor when it does not have adequate financial resources to meet winter home-heating costs because the dwelling’s heating system and insulation levels prove to be inadequate for achieving affordable household warmth (Boardman, 1991a). Fuel poverty has been well studied in the literature, particularly within the UK. Boardman (1991) coined the first official definition of fuel poverty used politically to assess the extent of the problem in the UK. Households in fuel poverty were defined as those spending 10% or more of their income on home energy expenditures (Boardman, 1991b). According to the Home Energy Affordability model in the U.S., an affordable burden for all home energy bills is six percent of gross household income and two percent for just home heating and cooling costs (Fisher, Sheehan & Colton, 2013). Household expenditures greater than these percentages are considered unaffordable. Hernandez, Aratani, and Yang (2014) examined the disproportionate share of household income allocated to energy expenses among families with children. They found that the largest population of families with
Midwest. Approximately half of the total analyzed households living in fuel poverty were African American and about a third were White.
Fuel poverty has important social, environmental and policy implications because it hampers the share of household income that can be spent on other necessities, such as, food, shelter and health care (Triskko, 2012). Fuel poverty as a hurdle to meet these basic needs denies one’s freedom of choice. “People should have the freedom to choose to be warm. If the only option is to be cold because there is insufficient income to purchase adequate warmth, then the individual is denied their freedom of choice” (Boardman, 1991). Moreover, “everyone needs to purchase fuel to provide essential energy services, such as warmth, hot water and lighting. These are not discretionary purchases but absolute necessities” (Boardman, 1991). Purchasing electricity or fuel for household warmth is a major challenge for low-income households. “As such, fuel poverty can be understood as an expression of injustice, involving the compromised ability to access energy services and thereby to secure a healthful living environment” (Walker & Day, 2012). Access to “[e]nergy is essential to meeting basic needs: cooking, boiling water, lighting and heating. It is also a prerequisite for good health – a reality that has been largely ignored by the world community” (World Health Organization, 2006).
While the economic and physical burden constitutes households as living in fuel poverty, there are a number of concomitant health implications. “The combination of prolonged winters and poor housing stock mean that significant proportions of European and North American households currently live in cold and damp homes” (Liddell & Morris, 2010). Households living in these physical conditions have enabled scholars to examine the enduring and potentially
cumulative health effects that might be associated with living in cold conditions. Health effects include increased risk of influenza, pneumonia, asthma, arthritis, and accidents at home (World Health Organization, 2007). As the rise of varying health impacts linked to fuel poverty became evident, preventable health impacts became the primary rationale for tackling fuel poverty in many different parts of the world (Lidell & Morris, 2010; Wilkinson, Smith, Joffe, & Haines, 2007).
L
OWI
NCOME AS AR
OOTP
ROBLEMThe federal poverty level for a family of five is $28,410; yet, nearly 40 percent of all American workers earn less than $20,000 annually (SSA, 2014). Since 1979, costs of living have steadily increased, while wages remained stagnant or in some cases declined. The Economic Policy Institute found that the average low-wage worker earned five percent less in 2013 than they did in 1979. In contrast, the hourly wages of high-wage workers rose 41 percent (Mishel, Gould & Bivens, 2015). In 2010, 62% of Hispanic households and 68% of African American households had average annual incomes below $50,000, compared with 46% of White households and 39% of Asian American households (Trisko, 2012). Additionally, African Americans are more than twice as likely to live in poverty: the group most impacted by energy prices (Congressional Black Caucus Foundation Inc. [CBCF], 2004). Due to income
inequalities, the burden of energy price increases is disproportionately experienced by African American and Hispanic households (Trisko, 2012). Rising energy costs exacerbate this injustice, stretching affordable energy for warmth far beyond attainable reach.
R
ISINGE
NERGYC
OSTSLow-income households are paralyzed by rising energy costs, making it difficult to regulate temperatures in their homes given their income. In 2014, residential electricity
customers across the U.S. experienced large increases in retail electricity prices, with the average residential price increasing 3.1% over the previous year, the highest annual growth rate since 2008 (EIA, 2014). The trend of rising cost continues; however, it is not uniform across the country. For example, residential electricity rate increases during 2014 ranged from 1.3% in the Pacific Coast states to 9.9% in New England EIA, 2016a; EIA, 2016b).
Home energy prices and spending trends for home energy have since exceeded general inflation rates. From 2000-2010, nominal home energy prices grew by 37%, while the Consumer Price Index grew by 27% (Pivo, 2012; CPI, 2010 and 2011). During the same time interval, spending on home energy grew even faster with renter’s nominal spending increasing to 53%, while average spending on all goods and services only rose by 22% (Pivo, 2012; CES, 2000 and 2010). Regarding average natural gas rates, prices have had a number of spikes in the past years, reaching record heights of $12.69 per million British thermal units (MMBtu) during June 2008 (See Appendix A). However, the December 2015 natural gas spot price at the benchmark Henry Hub was $1.93 per MMBtu. This was the lowest monthly average since March 1999. The U.S. Energy Information Administration’s (EIA) Short-Term Energy Outlook anticipates rises in natural gas prices averaging $2.65 per MMBtu in 2016 and $3.22 per MMBtu in 2017.
The impact of rising energy costs on low-income households has long been researched by scholars. Dillman, Rosa and Dillman (1983) found that low-income households were more
likely to sacrifice comfort and other critical needs when fuel prices rise while higher income households were more likely to invest in more efficient appliances. Thus, as Boardman (2012) stated, “raising fuel prices, therefore, cannot tip [low-income households] into greater energy efficiency investments, only into behavioral change. The most likely response is greater hardship, because there is insufficient money for those on a tight budget to spend more – they can only continue to spend at the old rate and thus purchase less energy.”
Examining energy cost and consumption disparities among households provides
important information on how to best alleviate fuel poverty. However, only a few studies have explored both racial and income disparities of residential energy consumption. Throgmorton and Benard III (1986) reported that African American households consumed substantially more natural gas than White households when controlling for home ownership status, housing type (single versus multi-family units), the effects of climate, and differences in energy-saving capital investments. Adua and Sharp (2011) explored both – racial, income and spatial differences in natural gas consumption. From 1993 to 2005, they found that African Americans consumed significantly more than Whites per annum. This remained so even after controlling for housing characteristics (e.g. age of home, number of bedrooms, size, and type of housing unit) and investment in energy efficiency (e.g. insulation level, window types, and thermostat operated heat) (Adua & Sharp, 2011). They also found that when compared to Whites, African
Americans lived in homes that were older, not as well insulated, and less likely to have double pane windows.
These studies, among others support the Physical-Technical-Economic-Tradition (PTEM) research, which assumes changes in energy demand result directly from changes in buildings and equipment characteristics as well as economic and environmental factors (Adua, 2010;
Lutzenhiser, 1993; Lutzenhiser and Hackett, 1993; Schipper and Grubb, 2000; Starr et al., 1992; Tommerup et al., 2007; and U.S. Department of Energy [EIA], 1992). Min, Hausfather and Lin (2010) provide an in-depth analysis of how home energy use characteristics vary by different energy end use categories in households across the country. While these studies provide rich information on energy consumption, neither explore associated energy burdens or energy intensities which may be more relevant for understanding disparities in utility hardship and energy inefficient households.
Residential energy costs are a significant portion of household budgets for low-income households (Roberts, 2008; Hernandez and Bird, 2010). Energy burdens for low-income households are often much greater than higher-income households. The U.S. Department of Health and Human Services reported that low-income households spend nearly 14% of their income on fuel costs compared to 3.6 percent for non low-income households (HHS, 2014). The range for low-income energy burden per fuel type is 12.5% for natural gas to 22.4% for fuel oil. Trisko (2012), found that the 59 million U.S. households earning less than $50,000 before taxes spend an estimated 17% of their after-tax income on energy. These conditions remain even as data from the EIA show that low-income households live in smaller homes, consume less energy and have smaller utility bills relative to average and higher-income households (EIA, 2013b). The share of household income spent for energy falls disproportionately on lower income families; however, even more so for African Americans.
The Congressional Black Caucus Foundation (2004) in its report “African Americans and Climate Change: An Unequal Burden,” concluded that increases in the price of energy negatively affect African Americans more significantly than the general population. African Americans spend a significantly higher fraction of their expenditures on direct energy purchases than non-African Americans across every income decile (CBCF, 2004). Despite emitting less greenhouse gas, African American families are more vulnerable to shifts in the prices of fossil fuels (CBCF, 2004).
LOCAL ENERGY CONSUMPTION AS A GLOBAL ISSUE
Environmental consequences of fuel poverty include unnecessary energy consumption and elevated carbon emissions from energy inefficient dwellings (Walker et al., 2012;
Boardman, 2010; Jenkins, 2010). The U.S. residential sector consumes approximately 21 quadrillion Btu annually, accounting for 22% of both the nation’s total energy consumption and energy-related CO2 emissions (EIA 2011a, 2012a, 2012b). In the residential sector, space heating is responsible for about 42% of energy consumption (EIA, 2013a). Although no longer the largest end use category, space heating places a foothold in total energy consumption. In Michigan, households experience harsher winters, increasing the demand for space heating to 55% of total energy consumption (EIA, 2013a). Within Detroit, the gamut of energy
consumption varies considerably with respect to the age of dwellings. Consequently, Michigan households spend six percent more for energy than the U.S. average (EIA, 2013a). Michigan homes are typically older than homes in other states, which contributes to a large fraction of energy lost through the building envelope. Building envelope retrofits represent the greatest potential to reduce energy consumption, regulate temperatures in homes and reduce CO2
emissions.
E
NERGYE
FFICIENCYA better and more effective measure of relative consumption is to analyze energy use intensity, a proxy for energy efficiency. According to the US Department of Energy, “Declines in energy intensity are a proxy for efficiency improvements, provided a) energy intensity is represented at an appropriate level of disaggregation to provide meaningful interpretation, and b) other explanatory and behavioral factors are isolated and accounted for” (DOEa).
The building sector provides the largest potential for significantly reducing residential energy consumption. EIA’s 2009, Residential Consumption Survey (RECS) show that newer homes in the U.S. are 30% larger but consume about as much energy as older homes. An analysis of RECS revealed that U.S. homes built in 2000 and later consume only two percent more energy on average than homes built prior to 2000, despite being on average 30% larger. However, the Census 2010-2014 American Community Survey, reported that nearly 85% of all U.S. housing units were built before 2000 and over half (56.2%) built before 1980. New homes consumed 21% less energy for space heating on average than older homes, mainly because of increased efficiency in the form of heating equipment and better building shells built to more demanding energy codes. Energy efficient improvements in newer homes are great in practice; however, retrofitting older homes remains a broken link in the chain of energy efficiency and energy affordability.
2010). The building envelope – the interface between the interior of the building and the external environment, includes the roof, walls and foundation, and serves as a thermal barrier. The building envelope plays an instrumental role in determining the amount of energy
consumed, retained within, and fuel necessary to maintain thermal comfort relative to the external environment. If the insulation fails to function properly, condensation of moisture within the wall assembly might occur, leading to compromised durability and unhealthy conditions inside the building (Mostafavi, Farzinmoghadam, & Hoque, 2013). By sealing air leaks and adding insulation from average values to recommended values, the average home in climate zone five, which includes south-eastern Michigan can save 12% on its total utility bill (16% of heating and cooling costs) and the average home in the southern U.S. can save 11% on its total utility bill (20% of total costs) (U.S. EPA & DOEa). In older homes, residents often experience a greater level of inefficiency, resulting in unnecessary consumption of energy; and consequently, much higher utility bills. Thermal efficiency is often prioritized in the design and construction of new housing, as it is essential protection to combat the relatively severe winters experienced in colder climates where winter temperatures are often below freezing (Boardman, 1991).
Severe winters widen the energy consumption gap between older and newer homes. According to EPA, an ENERGY STAR labeled new home is at least 15 percent more energy efficient than a home built to the 2004 International Residential Code and includes additional energy-saving measures that typically make it 20-30 percent more energy efficient than standard homes (EPA, 2008). An ENERGY STAR home can save homeowners between $200 and $400 per year on their utility bills on average (U.S. EPA & DOEb). The U.S. Department of Energy
(1992) also showed that home retrofits to building envelope efficiency and new home envelope efficiency respectively accounted for 20 and 10 percent of the four quadrillion Btu of delivered residential energy saved. Insulation retrofits would reduce energy consumption, consumer energy bills, but also contribute to environmental sustainability, reducing greenhouse gas emissions and improving air quality. These energy efficiency projects are low-hanging fruit for reducing energy cost, consumption and greenhouse gas emissions; however, a number of barriers halt low-income residents from capturing this potential.
BARRIERS TO RETROFIT
Poorer and more vulnerable households typically live in lower quality housing and have fewer resources and opportunities to invest in improvements to home heating efficiency and technology (Boardman, 2010). These improvement barriers manifest themselves into economic barriers, such as upfront capital costs and the renter-tenet split incentive problem, in addition to social and cultural barriers that inhibit participation in energy efficiency programs. Capital costs of energy efficient retrofits and technologies often hinder low-income residents from reaching the so called “low-hanging fruit” retrofit projects. Financial incentives, including tax credits, rebates and low-interest loans exist to help combat the barrier of upfront costs. These financial instruments, generally are not taken advantage of by low-income households. Looking at the respective incomes that actually claimed and received residential energy tax credits, one can see that only five percent of the 15-30k annual income group received tax credits (Crandall
-Hollick & Sherlock, 2016). Conversely, the 50-100k annual income group received roughly 15% of residential energy tax credits and the 100-200k annual income group claimed to receive around 33% of the total residential energy tax credits (Crandall-Hollick & Sherlock, 2016). Many of these benefits only provide incentives after they have been installed and have begun
making a return on investment. Low-income residents often prioritize items such as food and healthcare alongside other household expenses before the thought of allocating funds to tackle energy efficient improvements surface. Energy unaffordability is commonplace for low-income and minority communities, forcing them to prioritize spending of limited resources and resort to various coping mechanisms e.g. non-payment, buying less food, and limiting heating use
(Hernandez & Bird, 2010; Harrison & Popke, 2011).
The Benningfield Group (2009) found that approximately 88% of multifamily households are renters, whereas 86% of all single-family homes are owner-occupied. Additionally, renter household incomes (approximately $31,000/year) are roughly half those of owner households (approximately $61,000/year) (Benningfield Group, 2009). Multifamily resident’s income is sizably lower than owner-occupied homes, illuminating the cost disparity in providing energy efficient solutions.
Alongside capital costs for improvements, the split-incentive barrier makes incorporating energy efficient solutions difficult for residents. As the majority of residents are renters, there exists little incentive to invest in long-term energy saving solutions for property they do not own, especially if they do not plan to remain in the dwelling for long term. Conversely, landlords also have little incentive to invest in long-term energy savings because renters are responsible for utility costs. This is known as the split-incentive barrier, a principal–agent problem, occurring when landlords, as the energy efficiency improvement decision-maker, decide against making the investment because they receive no direct benefit from doing so (Bird and Hernandez, 2012). Private renters, often low-income residents, have been recognized as in a particularly difficult
situation as landlords can have few incentives to invest in the efficiency of the buildings they own, and tenants can be reluctant ask for home improvements for fear of rent rises or even eviction.
Social and cultural barriers often exacerbate economic barriers to energy efficient improvements (Stobaugh & Yergin, 1979; Sovacool, 2009). Reames (2016) argues that in low-income and minority communities, special care is needed to address social barriers such as competing social and economic priorities, and pervasive distrust and fear in government. He posits that “the pursuit of equity in energy efficiency participation requires recognition of social diversities that may impede the adoption of energy technologies.” Place-based understanding of energy dynamics is important to being effective in energy efficiency program implementation. Moreover, “community-based, spatially targeted energy efficiency efforts recognize both the unique assets and challenges of place for more effective delivery of programs to meet the distinct needs of the target population” (Reames, 2016). While many barriers to retrofit homes have placed a chokehold on energy savings, particularly for low-income residents, targeting households that would benefit from energy efficiency improvements and policy solutions remains a challenge.
T
ARGETINGF
UELP
OVERTYIdentifying fuel poor households is major challenge because of the collection of information required. “The absence of detailed information on residential energy end use characteristics for the United States has in the past presented an impediment to the effective
2010). “Few utilities have developed systems to identify high usage, low-income customers; many simply concentrate their investment in energy efficiency improvements for those with poor payment records” (Power, 2006). Data from utility companies would provide useful information on consumption levels, leading to potential households in fuel poverty risk; however, these data are often proprietary.
Dubois (2012) analyzed three different fuel poverty identification strategies to combat the myriad levels of data collection. Specifically, she looked at direct identification through
database crossing, decentralized identification and geographical identification (Dubois, 2012). Central databases do not exist including useful information such as incomes, energy expenses and energy efficiency characteristics of buildings at the level of each household. Hence, data crossing among several administrations, for example, in charge of social benefits that contain information on incomes, and electricity and gas supplies have information on energy expenses (Dubois, 2012). Further, very limited information is available on the energy efficiency
characteristics of buildings. Decentralized identification or “participatory identification” (Jehu-Appiah et al., 2010), requires members of the community to identify poor households based on their own definition and perceptions. This is useful as residents living in fuel poor regions have a better ability to detect inefficiencies and affordability disparities. While this method could be pragmatic, working knowledge of households and efficiency standards is needed. Geographical identification lends itself very useful as it provides a local model that comprises of energy characteristics of housing structure and an evaluation of householder characteristics. The underlying idea is that there are higher probabilities of fuel poverty in particular areas and/or housing types (Dubois, 2012). Although there is a risk of inclusion of non-poor households in
this method, it provides a unique, comprehensive method for targeting specific regions while uniting multiple data sources.
The body of literature investigating geographical approaches to target fuel poverty has primarily explored areas in the UK (Fahmy et al., 2011; Walker et al., 2012; Walker et al., 2013). Fahmy, Gordon, and Patsios (2011) develop regression models to predict the incidence of fuel poverty in England using sample survey data and applies resultant weights to Census spatial data sets. This approach requires that the best predictors of fuel poverty will model different
household types. Similarly, Walker and Day (2012) develop a small area fuel poverty risk index using environmental and socioeconomic variables via geographical methods. Significant clusters of high and low-risk small areas were identified using Local Moran’s I (Walker & Day, 2012).
In the U.S., Min, Hausfather, and Lin (2010) presents a framework for modeling
residential energy end uses. Combining regression based statistical models from RECS data with U.S. Census zip code level information, the results of this study have useful implications for residential energy efficiency planning. Reames (2014) explored the spatial distribution of urban heating EUI and found significant correlations between census block groups with high average heating EUIs and high percentages of racial minorities and low-income households.
The combination of annual incomes too low to sustain basic costs of living, rising energy costs and inefficient homes maintain energy burden disparities between low and high-income households. While research that employs geographical approaches to identify and target residents vulnerable to fuel poverty have taken a major step in supporting policy makers in the
UK, these studies do not consider the importance that race, location and socioeconomic status have on residential heating affordability, consumption and efficiency. This void holds true for studies in the US. This study helps fill that void, considering location, housing unit and householder characteristics in the models to estimate average heating fuel consumption and average heating energy use intensity (EUI).
M
ETHODOLOGYD
ESCRIPTION OFS
TUDYA
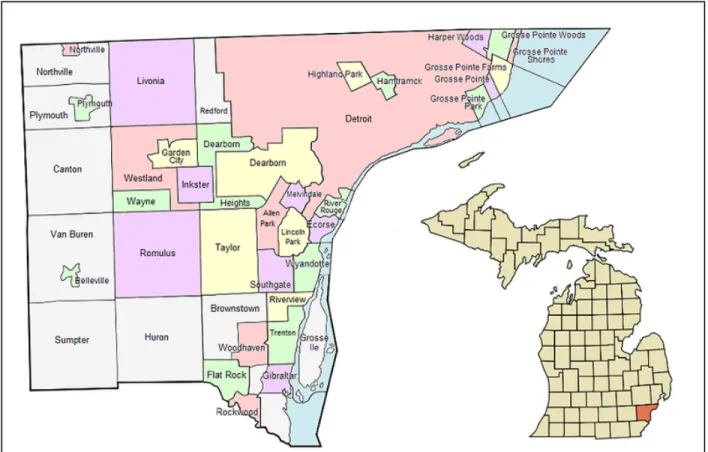
REAWayne County, Michigan forms the spatial context for this study (See Figure 1). The land area spans 612 square miles and the population per square mile was 2,974 in 2010. The 2010 Census recorded a population of 1,820,584 residents in 821,693 housing units. Figure 2 displays median block group incomes for Wayne County residents, ranging from $6,833 to $183,462 per year. Figure 3, is a dot density map, illustrating the actual spatial distribution of individuals by race in Wayne County. The population of Wayne County is 72.4% White, 12.6% African American and 16.3% Hispanic. Wayne County is segregated both racially and
economically. Considering both Figure 2 and 3, one can see that Wayne County is segregated both racially and economically. The Pew Research Center developed a single Residential Income Segregation Index (RISI) score for the nation’s top 30 metropolitan areas. The score is calculated by summing the share of lower-income households living in a majority lower-income tract and the share of upper-income households living in a majority upper-income tract. The maximum possible RISI score is 200. According to Pew Research on Social and Demographic Trends, the Detroit metropolitan area's Residential Income Segregation Index(RISI) score increased from 43 in 1980 to 54 in 2010 (Fry and Taylor, 2012). The maximum possible RISI
score is 200, indicating that 100% of lower-income and 100% of upper-income households would be situated in a census tract where a majority of households were in their same income bracket. Having a majority African American population residing in the City of Detroit and a majority White suburban population, the Detroit metropolitan area remains the most segregated in the nation (Logan and Stults, 2011). Furthermore, Figure 4 describes the distribution of housing stock age, displaying the median year built for block group housing structures.
Considering Figures 2, 3 and 4 together, one can see that low-income and minority communities reside in the oldest homes in the county.
Source: https://en.wikipedia.org/wiki/File:Wayne_County_Michigan_labels.png
FIGURE 4: MEDIAN BLOCK GROUP STRUCTURE YEAR BUILT
D
ATAThis study utilizes two national data sets, the 2009, Residential Energy Consumption Survey (RECS) and the 2010, U.S. Census American Community Survey (ACS). RECS enable the development of regression models to describe the relationship between housing unit and householder characteristics to heating consumption and EUI. Similar data collected by both RECS and ACS allow estimates of total heating energy consumption and EUI at the spatial resolution of block group levels.
The RECS is a national dataset administered by the EIA to represent occupied housing units in the United States. The representative housing samples span four Census regions, the nine Census divisions, and 16 states. The 16 states vary in geography, climate, and population size. Trained interviewers gather energy characteristics on the housing unit, usage patterns, and household demographics. This information combines data from energy suppliers to estimate energy costs and usage for heating, cooling, appliances and other end uses for improving efficiency, demand and building design. The data is organized in two categories, household characteristics and consumption and expenditure. The 2009 RECS collected data from 12,083 households in housing units statistically selected to represent the 113.6 million housing units that are occupied as a primary residence.1 In Michigan, RECS recorded 274 home observations to represent the state’s 4,529,680 occupied housing units. Since the scope of this study focuses on annual space heating and associated costs, six of the total 274 observations were removed from the sample because they did not include heating data, resulting in 268 total observations for this study2.
The ACS is an ongoing survey that provides useful information annually about the U.S. and its citizens. Information from the surveys generates data about jobs and occupations,
educational attainment, demographics, housing characteristics and other useful topics. This study uses data on household income, demographics and housing unit characteristics. Individuals are legally obligated to answer all questions as accurately as possible. The total Wayne County, ACS census block groups recorded are 1,822. Block groups with no population or zero housing units
1(http://www.eia.gov/consumption/residential/about.cfm) 2
were removed, resulting in 1,808 block groups.
M
ODELP
ARAMETERSWhen creating models of residential space heating consumption and EUI, the conceptual framework used is an adaption of the high-resolution statistical model of residential energy end use characteristics (Min et al, 2010). Since individual housing data is not readily available, to explore residential heating dynamics at scale, this study employs small area estimation statistical techniques (Min et al., 2010; Fahmy et al., 2011; Reames, 2014).
Small area estimation requires a two-step process. Figure 5 displays a schematic of the methodological framework. The first step uses household and housing unit variables XRECS, from the RECS data to develop two statistical regression models – one to predict residential heating energy consumption and the other to predict heating EUI. The second step multiplies sampling weights, βi, from the aforementioned models to matching variables in the RECS data, XCENSUS, from the ACS data to estimate heating consumption and EUI at the census block group level.
FIGURE 5: METHODOLOGICAL FRAMEWORK FOR MODELING AND MAPPING
SPECIFYING A REGRESSION MODEL FOR HEATING ENERGY CONSUMPTION AND EUI
The objective of the first step is to develop two statistical regression models that explain the relationship between the two response variables, heating energy consumption and EUI, with the predictor variables, housing unit characteristics (age of home, type of heating fuel, type of home and size of home) and controlling for household characteristics (household ownership, number of household members and household income). Dependent variables were natural log values of per-household final consumption and EUI for heating. The models can be formulated as:
ln (𝑌&'() ) = 𝛽-+ 𝛽&/01234 032)∗ 𝒳789: + 𝛽&/01';/<=∗ 𝒳789: ,
(Eq.1)
ln (𝑌8?@) = 𝛽-+ 𝛽&/01234 032)∗ 𝒳789: + 𝛽&/01';/<=∗ 𝒳789: .
(Eq.2)
RECS notation is used to differentiate for model creation in this step, and estimation in the subsequent step using Census data. Step one uses sampling weights, XRECS, from the RECS, 2009 data to model energy consumption and EUI. Using the observed data from the state of Michigan, a statewide ordinary least squares (OLS) regression model is developed for each response variable, measured in thousand British thermal units (kBtu) and kBtu per square foot per annum. The goal of the OLS is to model the relationship between the response and predictor variables; simply, how housing units and household characteristics influence total heating fuel consumption and EUI. EUI in this study is measured as the ratio of total annual site energy consumed for heating to the housing unit’s square footage of heating space. A larger EUI value indicates the home is not as energy efficient. For this model, total heating consumption is the site energy of the home, including all fuel types (natural gas, electric heat, fuel oil, liquid petroleum and kerosene). Regression model inputs and results are displayed in Table 1.
TABLE 1: REGRESSION MODEL INPUTS AND RESULTS
Categories Heating Consumption Model 1: Energy Use Intensity (EUI) Model 2:
Type of Housing 𝛽 S.E. 𝛽 S.E.
Apt 2-4 0.1431 0.1317 0.6728*** 0.1864
Apt 5> -0.2989* 0.1401 0.2987* 0.1511
Mobile Home 0.5173* 0.2361 0.1090 0.2271
Single Family Detached Reference Reference
Single Family Attached 0.01531 0.1402 0.0948 0.1809
Decade Constructed Before 1950s 0.3317 0.1739 0.328 0.17 1950s 0.3223 0.1802 0.3521 0.1786 1960s 0.0681 0.1769 0.1126 0.1848 1970s -0.0026 0.1832 -0.0159 0.188 1980s 0.0383 0.1693 0.0843 0.1808 1990s -0.0124 0.216 -0.1232 0.2125 2000s Reference Reference Primary Heat
Natural Gas Reference Reference
Propane 0.0138 0.0855 -0.098 0.1055
Electricity -1.627*** 0.1404 -1.381*** 0.1677
Wood -1.170 0.6978 -1.198 0.6732
Fuel Oil Heat -0.6926* 0.270 -0.6823** 0.2061
Control Variables
Household Income 0.0228 0.026 -0.0012 0.0259
No. Household Members -0.0506* 0.0256 -0.0619* 0.0266
Home Ownership 0.0806 0.0853 -0.01029 0.0874
Total No. of rooms 0.0203 0.0279 -0.1048*** 0.0254
Model Statistics Intercept, 𝜷𝟎 10.87375 0.2568 4.269 0.248 N 268 - 268 - Adjusted R2 0.5242 - 0.5183 - * Significance p < 0.05 ** Significance p < 0.01 *** Significance p < 0.001
SMALL AREA ESTIMATION FOR WAYNE COUNTY
Step two applies variable coefficients from the regression models, βi as weighting factors to corresponding variables in the ACS to estimate then map the median annual heating energy
County. The corresponding variables are standardized as the ratio of the number of housing units in a block group with a certain characteristic to the total number of housing units in the block group3. This is done for each corresponding variable (age of home, type of heating fuel, type of home, size of home, household ownership, number of household members and household income). These values then become comparable with binary variables in the RECS data set. These values are then mapped via geographic information systems (GIS) to estimate
consumption and EUI:
ln (𝑌&'() ) = 𝛽-+ 𝛽&/01234 032)∗ 𝒳9'3101 + 𝛽&/01';/<= ∗ 𝒳9'3101 , (Eq.3) ln (𝑌8?@) = 𝛽-+ 𝛽&/01234 032)∗ 𝒳9'3101 + 𝛽&/01';/<= ∗ 𝒳9'3101 4.
(Eq.4)
To explore disparities in energy affordability, the estimated median annual natural gas heating expenses was calculated for each block group by multiplying the 2009 average
residential natural gas price for Michigan, as reported by the EIA (See Equation 5). In 2009, the average price for natural gas in Michigan was $0.010963 per kBtu. Heating energy burden was then calculated for each block group using Equation 5.
3 If block group A has 100 homes, and 50 are single family attached, then the corresponding variable for single family attached is 50/100 = .5 which would be multiplied by 0.015 (from Table 1).
4 From the estimated log values ln (𝑌
&'() ) and ln (𝑌8?@ ) that we obtain from the regression models, actual
estimated energy can be obtain by this equation: (𝑌&'() ) = exp 7J:8K
L ∙ ln(𝑌&'() ) ; (𝑌8?@) = exp 7J:8K
L ∙ ln(𝑌8?@ )
The scaling value exp(RMSE2/2) is needed when using a log-linear model because without it we systematically underestimate the expected value of (𝑌&'() ) 𝑜𝑟 (𝑌8?@). (Wooldridge 2006: 219). RMSE means root mean square
100 ∗R330(< S()0T(< U(1 &'()234 8VW'3=2)0T'J'=2(3 &/01';/<= @3X/Y' (Eq.5)
R
ESULTSR
ESIDENTIALH
EATINGC
ONSUMPTIONFigure 6 displays the spatial distribution of the estimated annual mean block group heating energy consumption in Wayne County, Michigan. Heating consumption amongst the highest quintiles is primarily located in the north-east region of the study area, within the boundaries of Detroit. Annual block group heating consumption in the county ranges from a minimum 17,684 kBtu to a maximum 116,694 kBtu. The average consumption value for Wayne County is 80,665 kBtu with a standard deviation of 16,342. When compared to the median structure year built (Figure 4), this map suggests that heating consumption is larger amongst older homes. There are moderate levels of consumption (shown in yellow) in the western region of the county where homes were more recently constructed. Additionally, when comparing consumption to demographics (Figure 3), these results suggest that areas with majority African American populations consume more per annum than areas with majority White populations. Exploring household income (Figure 2) alongside consumption, highlight that low-income residents consume more than non low-income residents, contradicting results by the EIA. Considering heating consumption as an initial predictor of energy unaffordability leads to investigate these values normalized by square-foot, or energy use intensity. Areas with high consumption levels have lower incomes. Further, areas with low to moderate levels of consumption have higher incomes.
FIGURE 6: ESTIMATED RESIDENTIAL HEATING CONSUMPTION IN KBTU
R
ESIDENTIALH
EATINGE
NERGYU
SEI
NTENSITY(E
FFICIENCY)
Figure 7 displays the spatial distribution of the estimated annual mean block group heating EUI in Wayne County, Michigan. Along the west end of the county encasing the boundaries of the city of Detroit, there is a swath of census block groups with low estimated EUI, shown in green, indicating a higher level of energy efficiency. This confirms research that newer homes are designed and constructed with more energy efficient standards. The minimum EUI in the county is 25 kBtu/ft2 with a maximum value of 97 kBtu/ft2. The average EUI value for Wayne County is 54 kBtu/ft2 with a standard deviation of 9.8. Moderate levels of EUI, shown
the central region of Detroit, indicating lower levels of energy efficiency. This matches areas where houses are older (Figure 4) and may suggest that older homes are less energy efficient than newer homes a few miles outward.
FIGURE 7: ESTIMATED RESIDENTIAL ENERGY USE INTENSITY (EFFICIENCY) IN KBTU/FT2
R
ESIDENTIALH
EATINGE
NERGYB
URDENIn contrast to the EUI map, census block groups that are lower income in Figure 1 have higher energy burdens shown in Figure 8. This differs from Figure 5 in that moderate levels of heating consumption exist on the west side of the county; however, their respective energy burden is much lower than other block groups with moderate levels of energy consumption
within the county. The City of Detroit, is surrounded block groups with significantly lower heating energy burden. The minimum energy burden in the county is 0.42% with a maximum value of 13.3%. The average energy burden value for Wayne County is 2.64% with a standard deviation of 1.6%. Moderate to high levels of energy burden are concentrated in the city of Detroit. Moderately low estimated energy burdens exist north Detroit. Areas with higher consumption levels have lower energy burdens. Conversely, areas with higher incomes have lower energy burdens.
S
TATISTICALE
VIDENCE OFS
PATIALC
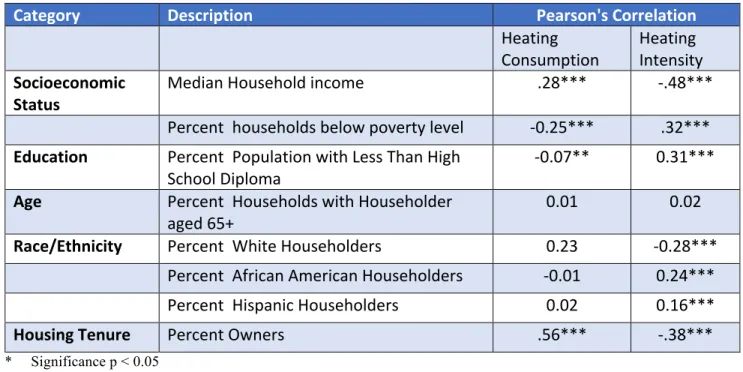
ORRELATIONTo understand the relationship between heating consumption and EUI, with race/ethnicity and socioeconomic status, a bivariate analysis using pairwise correlation was conducted. Table 2 displays these categories and their respective Pearson correlation coefficient for heating
consumption and heating EUI.
Considering the socioeconomic status category, there is a highly significant positive correlation between median household income and heating consumption. This confirms what Figure 2 and 6 illustrate, as income increases, so does heating consumption. Conversely, there is a highly significant negative correlation with median household income and EUI. This
correlation is demonstrative in Figure 2 and Figure 7, illustrating that as median household income decreases, EUI increase. Simply, residents with lower incomes live in more inefficient homes. Similarly, when considering the percent of householders below the poverty level, there is a highly significant negative correlation with heating consumption and a highly significant positive correlation with EUI. This illustrates that as there are increases in householders living in poverty while they consume less energy, they are more likely to live in more inefficient housing units.
Investigating education beyond a high school diploma, there is a highly significant negative correlation with heating consumption and a highly significant positive correlation with EUI. This indicates that when the number of individuals with education below a high school diploma decreases, energy consumption increases. Further, that when this demographic of householders increases, so does the EUI, meaning more inefficient homes for those with lower
levels of education. When considering the age category, there are no significant correlations between heating consumption and EUI for householders above the age of 65.
When considering correlations among race/ethnicity and heating consumption, there are no significant correlations between the percentage of White, African American or Hispanic householders. However, when analyzing EUI, there is a highly significant negative correlation with Whites and EUI, meaning that as the percent of Whites decreases, energy efficiency decreases. African Americans and Hispanics have highly significant positive correlations with EUI. This demonstrates that as the percent of African American and Hispanic households in a block group increases, homes are more likely to be less efficient. This correlation confirms what Figures 3 and 7 indicate with respect to the racial composition of Wayne County and energy efficiency. Considering the housing tenure of the residents, owning a home has a highly significant positive correlation with heating consumption and a highly significant negative correlation with EUI.
TABLE 2: PAIRWISE CORRELATION OF ESTIMATED HEATING ENERGY CONSUMPTION AND ENERGY USE INTENSITY
Category Description Pearson's Correlation
Heating
Consumption Heating Intensity Socioeconomic
Status Median Household income .28*** -.48***
Percent households below poverty level -0.25*** .32*** Education Percent Population with Less Than High
School Diploma -0.07** 0.31*** Age Percent Households with Householder
aged 65+ 0.01 0.02
Race/Ethnicity Percent White Householders 0.23 -0.28*** Percent African American Householders -0.01 0.24*** Percent Hispanic Householders 0.02 0.16***
Housing Tenure Percent Owners .56*** -.38***
* Significance p < 0.05 ** Significance p < 0.01 *** Significance p < 0.001
C
ONCLUSIONThis study unravels a physical argument on residential buildings to inform solutions to residential heating energy affordability, consumption and efficiency disparities. Median heating consumption, EUI and energy burden are estimated at the block group level for Wayne County, Michigan by developing a multilevel regression model that applies regression coefficients to census data. This research furthers our understanding of the spatial patterns and relationships between race, place, socioeconomic status and residential energy dynamics at a small area level. The missing link – identifying vulnerable communities of fuel poverty is uncovered through the use of a geographic approach in tandem with pairwise correlations. The revised models
et al., 2012; Reames, 2012) to provide reliable estimates of heating energy burden, consumption and efficiency.
The findings presented in this study reveal spatial and statistical disparities in energy affordability, consumption and efficiency in Wayne, County Michigan. Higher levels of heating consumption are found within and just outside of the Detroit city boundaries. Lower levels of heating consumption are on the outskirts of Wayne County. Considering EUI, energy inefficient block groups are spatially clustered central to Detroit, while the smallest EUI, or more energy efficient block groups, are spatially distributed along the outer edges of the county. The block groups with the highest energy burden are all concentrated within the Detroit city boundaries. Although few areas of low energy burden exist within the city of Detroit, very low burdens encapsulate the border of the city.
There are no statistical relationships between race and heating energy consumption; however, block groups with higher percentages of African American and Hispanics householders have highly significant positive correlations with EUI. Strong correlations also exist between socioeconomic status, education and housing tenure with heating consumption and EUI. The strong correlations with EUI reveal the need to explore energy efficiency outside of heating consumption to understand the associated disparities. These results uncover answers to race and energy related questions that other scholars have struggled to find.
The intersection between income, energy burden and demographics unveiled in this study illustrate that low-income, African American and Hispanic communities are more likely to suffer
from fuel poverty than higher-income and White communities. Low-income/minority residents are plagued in the energy unaffordability realm, suggesting that there is a clear cost of being “inefficient”. This cost reveals itself as high energy burdens. Several financial and institutional barriers prevent theses residents from retrofitting their homes, a proven solution reducing fuel expenditures, increasing energy efficiency and mitigating subsequent carbon emissions. Consequently, there are increases in physical and mental stress to low-income and minority community members because of their housing conditions. Energy efficiency upgrades are not a clean cut solution to ensure reductions in energy consumption because of rebound effects – attenuation of the upgrade because of behavioral responses. However, it does eliminate
unnecessary consumption due to inefficiencies in the householder’s home. The ancillary costs of household inefficiency may not be experienced for higher-income residents as their energy burden percentages are only fractions of a percent. Thereby, the results of this research may facilitate policy and program changes to eliminate energy inequities across Wayne County and the rest of the country.
P
OLICYI
MPLICATIONSThe results of this research provide a useful tool and guide that may assist local
organizations and policy makers with developing stronger utility bill support and weatherization programs to targeting fuel poverty and utility hardships. The federally funded Low Income Heating Energy Affordability Program (LIHEAP) provides energy assistance to residents who are unable to afford their high utility bills. Identifying concentrated areas of high energy burden is still a concern given support from government. LIHEAP eligibility primarily depends on income; however, many qualified householders do not receive energy assistance. While
attenuating exorbitant utility bills provides temporary relief for some householders, it perpetuates fuel poverty by not combatting a root cause of fuel poverty, energy inefficiency.
The Weatherization Assistance Program (WAP) provides low- to no-cost energy efficiency improvements, including insulation, air sealing, and windows. The purpose of “[t]he weatherization assistance program is to increase the energy efficiency of dwellings owned or occupied by low-income persons, reduce their total residential expenditures, and improve their health and safety, especially low-income persons who are particularly vulnerable such as the elderly, person with disabilities, families with children, high residential energy users, and households with high energy burden” (DOE, 2000). The Department of Energy estimate that WAP saves low-income households $437 annually on heating and cooling costs (DOEb). Similar to LIHEAP, eligibility for WAP depends on income. Low-income households seeking
weatherization services can apply to their local agencies and receive support. Targeting
inefficient homes, however remains ineffective in WAP standard implementation. This research unravels hurdles in targeting fuel poverty through a targeted approach based on concentrations of high EUI and energy burden.
Despite the presence of federal energy assistance programs, more aggressive and systematic policy implications would considerably help many householders entrenched in fuel poverty while engendering the growth of a sustainable future within the residential energy realm. By building on the two aforementioned federal assistance programs, long term solutions in energy efficiency and reducing energy burden could emerge simply by reallocating funds in the federal budget. Bill assistance is the primary method for reducing high utility bills/energy
burdens of householders. In the U.S., LIHEAP is the primary method for bill assistance. It accounts for 40% of federal funding. Bill assistance makes up 81% of total dollars spent. Conversely, WAP only makes up two percent of spending and energy efficiency 14% (See Appendix B). By redirecting funds to WAP, householders would begin to experience relief from cold homes and would considerably save money on energy costs and their overall carbon
footprint would be reduced. The benefits linked to this approach do not even begin to scratch the surface with a focus on bill assistance.
Building on current policies would spark meaningful change to millions of American’s struggling with utility hardships; however, to date, targeting homes and understanding spatial context of neighborhoods is still ineffective. It would be fruitful to have more directed energy assistance programs. Using spatial proximity as a guide to identifying fuel poor householders eliminates onerous applications to determine eligibility and provides a quicker and more robust response to householders in need. Furthermore, there is a dire need to understand the
cultural/racial differences within the respective identified neighborhoods. Simply creating energy assistance programs without effective marketing maintain the energy divide, leaving many in fuel poverty. To overcome cultural and social barriers, community-based approaches would enable more access to help that is readily available. Community-based energy programs have shown success for overcoming various barriers and increasing participation in the adoption of energy technologies (Reames, 2016). Thus, a community-based approach to energy efficiency targeting low-income, African-American and Hispanic communities could improve equity and justice by recognizing the unique characteristics and needs of these communities, rather than the dominant broad based, homogeneous view of energy users, which tends to undermine equitable
program development and implementation (Higgins and Lutzenhiser, 1995, Walker and Day 2012). As a next step, targeting local churches, community centers and neighborhood groups would be a great start to reaching many householders anguished by fuel poverty. Solving fuel poverty requires an integrated approach to further develop the needs of community, to identify households in need and to provide community development through sustainable alternatives.
LIMITATIONS
As with all research, this study is limited in its scope to fully understand individual households in fuel poverty. Information obtained from this data is often not precise enough to identify individual households; rather, only census block groups that suffer from fuel poverty. Although, some homes that are not considered fuel poor may become integrated spatially with surrounding ones that are, this study provides a model of median block group estimates to inform policy and program targeting while exploring relationships with race and class. Specific
information about individual household utility bills is not accessible. This study’s relevance provides a best estimate of areas where householders may experience the greatest threat of fuel poverty. Future research should pursue a more granular level of understanding, perhaps by using individual parcel data. Further, the influence of behavior on disparities in energy consumption or efficiency are not observed in these models.
Appendices
A
PPENDIXA:
H
ENRYH
UBN
ATURALG
ASS
POTP
RICESource: Natural Gas Spot and Future Prices. New York Mercantile Exchange (NYMEX)
0 1 2 3 4 5 6 7 8 9 10 $/ M M Bt u
Appendix B: Support for low-income Energy Needs
Data on ratepayer- funded bill assistance, ratepayer-funded energy efficiency, WAP, and LIHEAP assistance are from 2013. LIHEAP spending on efficiency is approximated based on 6% of LIHEAP funds spent on efficiency in 2006. Data on state and local contributions and private donations are from 2010. Data collected from the LIHEAP Clearinghouse in 2016.
R
EFERENCESAdua, L. (2010). To Cool a Sweltering Earth: Does Energy Efficiency Improvement Offset the Climate Impacts of Lifestyle?. Energy Policy 38 (10): 5719-32.
Adua, L., Sharp, J. (2011). Explaining Residential Energy Consumption: A Focus On Location and Race Differences In Natural Gas Use. Journal of Rural Social Sciences. 26 (1): 107-141.
Benningfield Group. (2009). “U.S. Multifamily Energy Efficiency Potential by 2020.” Prepared for the Energy Foundation.
Bird, S. and Hernández, D. (2012). Policy options for the split incentive: increasing energy efficiency for low-income renters. Energy Policy, 48, 506–514.
Bureau of Labor Statistics. (2000). Consumer Expenditure Survey [CES]. --- (2010). Consumer Expenditure Survey [CES].
--- (2000). Consumer Price Index [CPI]. --- (2010). Consumer Price Index [CPI].
Boardman, B. (1991a). Fuel Poverty: From Cold Homes to Affordable Warmth. London: Belhaven Press.
--- (1991b). Fixing Fuel Poverty: Challenges and Solutions. Routledge (Vol. 1).
http://doi.org/10.1080/02673037.2012.617915
--- (2010). Fixing Fuel Poverty: Challenges and Solutions. Routledge, 1(December), 256. http://doi.org/10.1080/02673037.2012.617915
Congressional Black Caucus Foundation Inc. (2004). African Americans and Climate Change: An Unequal Burden.
Crandall-Hollick, M.L, Sherlock, M.F. (2016). Residential Energy Tax Credits: Overview and Analysis. Congressional Research Service.
Cluett, R., J. Amann, and S. Ou. (2016). Building Better Energy Efficiency Programs for Low-Income Households. Washington, DC: ACEEE. http:// aceee.org/research-report/a1601. Dillman, D. A., Rosa, E. A., & Dillman, J. J. (1983). Lifestyle and home energy conservation in
the United States: the poor accept lifestyle cutbacks while the wealthy invest in conservation. Journal of Economic Psychology, 3(3-4), 299–315.
Dubois, U. (2012). From targeting to implementation: The role of identification of fuel poor households. Energy Policy, 49, 107–115. http://doi.org/10.1016/j.enpol.2011.11.087 Fahmy, E., Gordon, D., & Patsios, D. (2011). Predicting fuel poverty at a small-area level in
England. Energy Policy, 39(7), 4370–4377. http://doi.org/10.1016/j.enpol.2011.04.057 Fisher, Sheehan, and Colton. (2014). The Home Energy Affordabilty Gap 2013. Belmont, MA:
Fisher, Sheehan & Colton, 2014
http://www.homeenergyaffordabilitygap.com/downloads/2013_Released_May14/HEAG 2013%20Regional%20Fact%20Sheets.pdf
Fry, R., Taylor, P. (2012). The Rise of Residentail Segregation by Income. Pew Research Center. Social & Demographic Trends. http://www.pewsocialtrends.org/2012/08/01/the-rise-of-residential-segregation-by-income/
Gould-Werth, A., Seefeldt, K. (2012). ‘‘Material Hardships during the Great Recession: Findings from the Michigan Recession and Recovery Study’’. National Poverty Center Policy Brief #35.
Harrison, C., & Popke, J. (2011). “Because You Got to Have Heat”: The Networked Assemblage of Energy Poverty in Eastern North Carolina. Annals of the Association of American Geographers, 101(March 2015), 949–961.
http://doi.org/10.1080/00045608.2011.569659
Hernandez, D., (2013). Energy Insecurity: A Framework for Understanding Energy, the Built Environment and Health among Vulnerable Populations in the Context of Climate Change. American Journal of Public Health. 104:3
Hernandez, D., Aratani, Y., & Jiang, Y. (2014). Energy Insecurity among Families with Children. New York: National Center for Children in Poverty. Columbia University Mailman School of Public. http://www.nccp.org/publications/pub_1086.html Hernandez, D., & Bird, S. (2010). Energy burden and the need for integrated low-income
housing and energy policy, Poverty and Public Policy 2(4), 5-25.
Higgins, L., & Lutzenhiser, L. (1995). Ceremonial Equity: Low-Income Energy Assistance and the Failure of Socio-Environmental Policy. Social Problems, 42(4), 468–492.
http://doi.org/10.1525/sp.1995.42.4.03x0128x
Jenkins, D. P. (2010). The value of retrofitting carbon-saving measures into fuel poor social housing. Energy Policy, 38(2), 832–839. http://doi.org/10.1016/j.enpol.2009.10.030 Jehu-Appiah, C., Aryeetey, G., Spaan, E. (2010). Efficiency, equity and feasibility of strategies