1
Title: Extensive heterogeneity in somatic mutation and selection in the
human bladder
Authors: Andrew R. J. Lawson1, Federico Abascal1, Tim H. H. Coorens1, Yvette Hooks1, Laura O’Neill1, Calli Latimer1, Keiran Raine1, Mathijs A. Sanders1,2, Anne Y. Warren3, Krishnaa T. A. 5
Mahbubani4,5, Bethany Bareham4,5, Timothy M. Butler1, Luke M. R. Harvey1, Alex Cagan1, Andrew Menzies1, Luiza Moore1, Alexandra J. Colquhoun6, William Turner6, Benjamin
Thomas7,8, Vincent Gnanapragasam9,10, Nicholas Williams1, Doris M. Rassl11, Harald Vöhringer12, Sonia Zumalave13, Jyoti Nangalia1, José M. C. Tubío13,14,15, Moritz Gerstung12, Kourosh Saeb-Parsy4,5, Michael R. Stratton1, Peter J. Campbell1,16, Thomas J. Mitchell1,6, Iñigo 10
Martincorena1*
Affiliations:
1Cancer, Ageing and Somatic Mutation Programme, Wellcome Sanger Institute, Hinxton CB10 1SA, UK.
2Department of Hematology, Erasmus University Medical Center, Rotterdam 3015 GD, The 15
Netherlands.
3Department of Histopathology, Cambridge University Hospitals NHS Foundation Trust, Cambridge Biomedical Campus, Cambridge CB2 0QQ, UK.
4Department of Surgery, University of Cambridge, Cambridge CB2 0QQ, UK.
5NIHR Cambridge Biomedical Research Centre, Cambridge Biomedical Campus, Cambridge 20
CB2 0QQ, UK.
6Department of Urology, Cambridge University Hospitals NHS Foundation Trust, Cambridge CB2 0QQ, UK.
7The Royal Melbourne Hospital, 300 Grattan Street, Parkville, Victoria 3010, Australia. 8The University of Melbourne, Parkville, Victoria 3010, Australia.
25
9Academic Urology Group, Department of Surgery and Oncology, University of Cambridge, Cambridge CB2 0QQ, UK.
10Cambridge Urology Translational Research and Clinical Trials Office, University of Cambridge CB2 0QQ, UK.
11Department of Pathology, Royal Papworth Hospital NHS Foundation Trust, Cambridge 30
Biomedical Campus, Cambridge CB2 0AY, UK.
12European Molecular Biology Laboratory, European Bioinformatics Institute (EMBL-EBI), Hinxton CB10 1SD, UK.
13Mobile Genomes and Disease, Center for Research in Molecular Medicine and Chronic Diseases (CiMUS), Universidade de Santiago de Compostela, Santiago de Compostela 15706, 35
2
14Department of Zoology, Genetics and Physical Anthropology, Universidade de Santiago de Compostela, Santiago de Compostela 15706, Spain.
15The Biomedical Research Centre (CINBIO), University of Vigo, Vigo 36310, Spain. 16Department of Haematology, University of Cambridge, Cambridge CB2 2XY, UK. *Correspondence to: [email protected] (I.M.)
5
Abstract:
The extent of somatic mutation and clonal selection in the human bladder remains unknown. We sequenced 2,097 bladder microbiopsies from 20 individuals, using targeted (n=1,914), whole-exome (n=655) and whole-genome (n=88) sequencing. We found rampant positive selection in 17 10
genes. Chromatin remodeling genes were frequently mutated, whereas mutations were absent in several major bladder cancer genes. There was extensive inter-individual variation in selection, with different driver genes dominating the clonal landscape across individuals. Mutational signatures were heterogeneous across clones and individuals, suggestive of differential exposure to mutagens in the urine. Evidence of APOBEC mutagenesis was found in 22% of microbiopsies. 15
Sequencing multiple microbiopsies from five patients with bladder cancer enabled comparisons to cancer-free individuals and across histological features. This study reveals a rich landscape of mutational processes and selection in normal urothelium, with large heterogeneity across clones and individuals.
20
One Sentence Summary:
Normal bladder urothelium is populated by mutant clones carrying cancer-driving mutations, with large heterogeneity in mutational signatures and selection across individuals.
3
Main Text:
Recent technological developments have started to enable the detection of somatic mutations in normal tissues (1-15). One observation derived from these studies is that, as we age, some tissues are colonized by mutant clones carrying driver mutations in cancer genes (2, 3, 6-8, 11, 15). These mutations confer a growth advantage driving clonal expansions, some of which are thought to 5
represent the earliest steps towards cancer. However, the extent of this phenomenon remains unclear as driver mutations appear rare in other tissues (4, 9, 10, 12).
Bladder urothelium is an interesting tissue in this context. It is one of the slowest dividing epithelia in the human body, being largely quiescent in homeostasis, although able to regenerate quickly upon injury (16). Yet, bladder cancers arising from the urothelium have some of the highest 10
mutation burdens of all major cancer types (17) and a rich landscape of driver mutations (18, 19). Bladder urothelium is also constantly bathed in urine, which can contain mutagenic and carcinogenic molecules known to increase risk of bladder cancer, such as aromatic amines from tobacco smoking, aristolochic acid from certain herbal medicines, and compounds present in dyes, solvents and fumes from occupational and environmental exposures (20, 21).
15
Somatic mutations in normal bladder
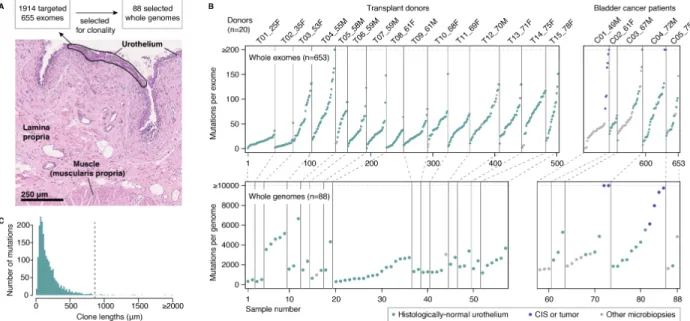
To characterize the mutational landscape of normal bladder urothelium both within and across individuals, we performed laser microdissection of small strips of urothelium. Microbiopsies had a median length of 855µm, typically containing a few hundred cells (Fig. 1A). In total, we studied 1,647 microbiopsies from 15 deceased transplant organ donors (ranging 25-78 years of age) and 20
450 microbiopsies from five patients with bladder cancer (49-75 years, table S1) (22). Formalin-free fixation and paraffin embedding were used to ensure high-quality morphology and genome sequencing (22).
4
To search for mutant clones, we performed targeted sequencing of 321 cancer-associated genes for 1,914 microbiopsies (median coverage of 89´) (22). To study mutation burden and signatures, copy number changes and selection outside of cancer genes, we performed whole-exome sequencing of 655 microbiopsies (median coverage of 72´) (22) and whole-genome resequencing of 88 microbiopsies dominated by large clones (median coverage of 33´, Fig. 1A) (22). By 5
sequencing many biopsies per individual, we were able to study the heterogeneity in drivers, burden and signatures across clones and individuals.
In histologically-normal urothelium, we detected a median number of 40 mutations per exome and 1,879 mutations per genome, although the numbers varied considerably across microbiopsies (Fig. 1B and fig. S1) (22). Variant allele fractions (VAFs) were moderately low (median exome VAF = 10
0.13) and most mutations were detected in a single microbiopsy with few shared by adjacent microbiopsies (fig. S2), indicating that mutant clones are typically smaller than the microbiopsy sizes used in this study. Considering the allele fractions and the length of each microbiopsy, we estimate that most mutant clones are smaller than a few hundred micrometers in 1-dimensional sections of urothelium (Fig. 1C) (22), consistent with estimates derived from mitochondrial 15
markers (23). This shows that histologically-normal bladder urothelium is a patchwork of small, typically microscopic, mutant clones.
Below, we first describe the mutational landscape of healthy bladder by focusing on data from the 15 transplant organ donors (Figs. 2 and 3), followed by an analysis of microbiopsies from the five patients with bladder cancer (Fig. 4).
5
Widespread positive selection in normal urothelium
To determine whether positive selection on certain genes drives these clonal expansions, we used the ratio of non-synonymous to synonymous mutation rates (dN/dS). Mutations driving clonal expansions become overrepresented among mutant clones reaching detectable sizes, which manifests as an excess of non-synonymous mutations in driver genes (22). We used dNdScv, an 5
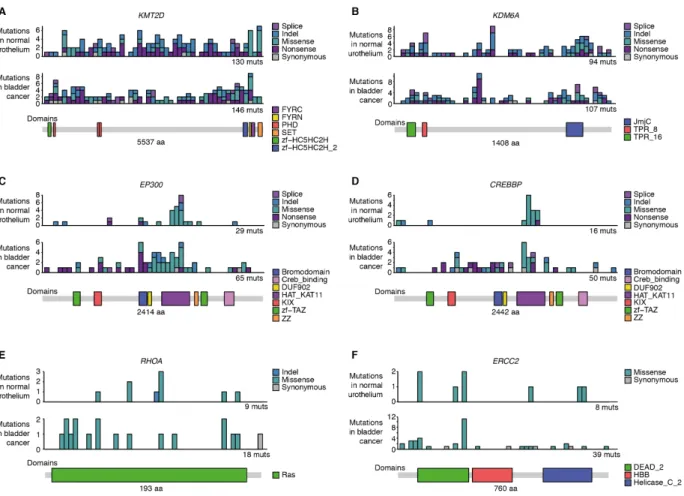
implementation of dN/dS that corrects for trinucleotide mutation rates, sequence composition and variable rates across genes (19). Applying it to the 321 cancer genes sequenced in 1,500 microbiopsies of normal urothelium from the transplant organ donors revealed significant positive selection on 12 genes (22): KMT2D (also known as MLL2), KDM6A (also known as UTX), ARID1A, RBM10, EP300, STAG2, NOTCH2, CDKN1A, CREBBP, FOXQ1, RHOA and ERCC2 10
(Fig. 2A). Using restricted hypothesis testing on known bladder cancer genes and a dN/dS model at the level of single hotspots, we identified an additional five genes under selection: KLF5, ZFP36L1, ELF3, GNA13 and PTEN (22). Overall, 17 genes were found to be under clear positive selection, conferring on the mutant cells a competitive advantage over neighboring cells.
The enrichment of non-synonymous mutations in positively-selected genes was large, with dN/dS 15
ratios higher than 10 or even 100 (Fig. 2B). In most genes, selection on protein-truncating mutations (indels, nonsense and essential splice site substitutions) was stronger than on missense mutations, a pattern characteristic of tumor suppressor genes (19). In fact, while indels contributed just under 8% of all detected mutations across exomes and genomes, they accounted for 39% of all driver mutations. Clear exceptions were RHOA, ERCC2 and GNA13, which displayed higher 20
frequencies of missense mutations, typically at known oncogenic hotspots (Fig. 2B and fig. S3). Overall, based on the excess of non-synonymous mutations measured by dN/dS, we detected a total of 385 (CI95%: 357, 401) driver mutations across all microbiopsies (22).
6
We can integrate allele fractions to estimate the proportion of cells in bladder urothelium that carry a driver mutation, while accounting for the possibility of undetected copy number losses and mutations occurring in one or two alleles per cell (Fig. 2C) (22). This conservatively estimates that between 8 and 19% of cells carry a driver mutation in normal bladder in middle-age and elderly individuals.
5
Chromatin remodeling genes dominate the driver landscape
Of the 17 positively-selected genes, all but NOTCH2 have been identified as bladder cancer genes from TCGA data (18, 19) (Fig. 2D). In contrast to the case of NOTCH1 in normal esophagus (7, 8), the mutation frequency of these 17 genes is higher in bladder cancers than in normal urothelium from middle-age and elderly individuals in our cohort. This suggests that these mutations confer 10
on the mutant cells an increased tumorigenic potential, even if the risk of progression of individual clones is extremely small. Most common bladder cancer genes can be classified into three functional groups: the RTK/Ras/PI3K pathway (such as PIK3CA, FGFR3, ERBB2 and ERBB3), the p53/Rb pathway (such as TP53, RB1 and ATM) and genes involved in chromatin remodeling (18, 24). Five of the top six most mutated driver genes in normal bladder are involved in chromatin 15
remodeling, whereas mutations in RTK/Ras/PI3K or p53/Rb genes that are very common in bladder cancer are much rarer in normal urothelium (Fig. 2E).
The absence of mutations in some of the main bladder cancer genes was noteworthy. Across 1,500 microbiopsies, we only found three independent mutations in TP53, which is mutated in nearly 50% of muscle-invasive bladder cancer, and no mutations in FGFR3, which is mutated in 60-80% 20
of non-muscle-invasive bladder cancers (25). We also did not detect any TERT promoter mutations across 55 whole-genomes of normal urothelium, despite it being mutated in around 70-80% of bladder cancers, including early stage bladder cancers (26). This suggests that these driver
7
mutations may not confer large clonal advantages in normal urothelium, but are key drivers of bladder cancer development. Detection of mutations in these genes in liquid biopsies may prove informative for early detection of bladder cancer (26).
The analyses above were restricted to the targeted panel of 321 known cancer genes. The extent of selection in normal tissues outside known cancer genes is less understood. It is conceivable that 5
mutation of certain genes could drive benign clonal expansions in healthy tissues without contributing to tumorigenesis or even push cells down evolutionary paths away from cancer. Running dNdScv on all genes using 483 whole-exomes from normal urothelium, yielded seven genes under clear positive selection, all within the list of 17 genes above (22). This confirms that the main drivers of clonal expansions in normal urothelium are all known cancer genes. Somatic 10
mutations could also lead to cellular death or differentiation, which would lead to a depletion of protein-altering mutations in surviving clones. While this dataset is not powered to detect negative selection at the level of individual genes, exome-wide dN/dS ratios excluding known cancer genes were close to, and not significantly lower than 1 (Fig. 2F). This is consistent with the vast majority of somatic coding point mutations being tolerated by normal cells and accumulating passively, in 15
line with observations in cancer genomes (19). Similar non-significant results were obtained when focusing on putative antigenic regions of the exome, providing no clear evidence of immune editing against these mutant clones (fig. S4) (22).
Extreme variation in driver preference across individuals
Having identified many independent mutant clones per donor, we were able to study differences 20
in selection across individuals. We used a dN/dS-based likelihood-ratio test that compares the relative enrichment of non-synonymous mutations in particular genes, while correcting for differences in mutation rates, mutation signatures, coverage and selection at other genes (22). This
8
analysis revealed striking differences in the landscape of clonal selection across donors (Fig. 2G and fig. S4). For example, one individual (T03_53F) had 35 different KDM6A mutations and two ARID1A mutations, whereas another (T06_59M) had four KDM6A mutations and 20 ARID1A mutations (Fig. 2, G-I). The four most frequently mutated genes in our dataset, KMT2D, KDM6A, ARID1A and RBM10, all showed highly-significant differences in selection across donors (Fig. 5
2G, q-values<0.05 from dN/dS likelihood-ratio tests) (22).
It is unclear whether these differences are driven by variability in environmental exposures or by the genetic background of each individual. No clear evidence of pathogenic germline mutations was found in these genes (22). KDM6A and RBM10 are both located on the X-chromosome and KDM6A is known to escape X-chromosome inactivation, with some evidence suggesting that both 10
KDM6A and RBM10 are more frequently mutated in males across cancer types (27). However, in our limited cohort, KDM6A appears more frequently mutated in women than men, in line with previous observations in non-muscle-invasive bladder cancer (28). Larger cohorts would be required to establish robust associations between epidemiological factors and differences in somatic mutation rates and selection.
15
Large heterogeneity in burden and signatures across clones and donors
The whole-exome data showed an increase in the number of mutations detected with age, consistent with continual, irreversible accumulation of mutations during life (Fig. 3A). To estimate the mutation burden per cell despite the presence of multiple clones per microbiopsy, we used two alternative approaches to obtain lower-bounds from the whole-genome data: integration of allele 20
frequencies and deconvolution of the major subclone (22). We estimate that, by middle age (50-65 years), cells in normal urothelium carry over 500-2,000 mutations per genome. This burden is
9
within the range observed for other normal tissues (1, 4, 7), but an order of magnitude lower than the typical burden of bladder cancers (Fig. 3B).
Analysis of the mutational spectra revealed striking differences across donors (Fig. 3C). To better understand this variation, we performed de novo mutational signature decomposition in 80 genomes of normal urothelium from all 20 individuals using a Bayesian hierarchical Dirichlet 5
process, and matched these signatures to known signatures from cancer genomes (fig. S5-S6) (22). This identified four main signatures that contribute over 89% of all mutations in the dataset (Fig. 3, D-H). The same four signatures were found using non-negative matrix factorization (SigProfiler) (fig. S7A) (22).
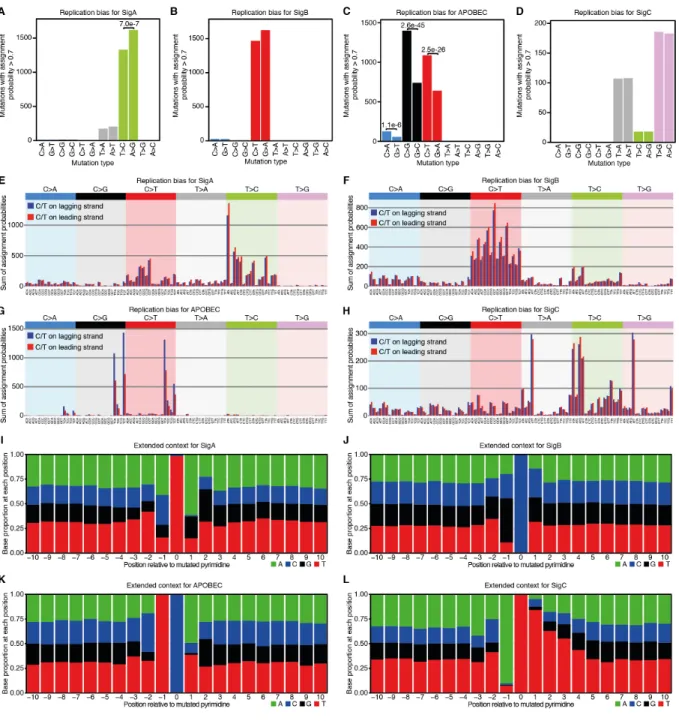
One signature, the third most abundant, was clearly attributable to APOBEC mutagenesis (cosine 10
similarity with SBS2+SBS13 = 0.995)(29). The high mutation burden in bladder cancers is largely driven by activation of APOBEC3 cytidine deaminases, which preferentially generate C>G and C>T changes in a TCN context (Fig. 3G) (17). APOBEC mutagenesis has been only rarely reported in normal tissues sequenced to date (8, 9, 15), but it occurs frequently in normal urothelium, contributing hundreds to thousands of mutations in the clones in which it is active (Fig. 3D). 15
The other three signatures did not match known signatures (fig. S6). Signatures A and B may contain a fraction of SBS5 mutations, which are common in bladder cancers (17), but they were stably extracted as separate from small amounts of SBS5 when using known signatures as priors or when adding cancer genomes to the signature extraction (fig. S7-S8) (22). Signature A is dominated by T>C changes, with a clear transcriptional strand bias suggestive of transcription-20
coupled damage or repair (Fig. 3E and fig. S9). Reanalysis of whole-genome data from the PCAWG consortium suggests a high contribution of signature A to some bladder cancer genomes (fig. S6C-E) (22). Signature B is dominated by C>T changes (Fig. 3F) and shares some
10
resemblance with SBS5 in combination with a C>T-rich signature with a modest transcriptional strand bias (fig. S6 and S9). Signature C has distinct peaks at T>A and T>G in an ATT context (Fig. 3H) and does not resemble any known signature or combination of signatures (fig. S6). It has a strong transcriptional strand asymmetry with lower mutation rates in transcribed regions (fig. S9), a pattern indicative of this signature being generated by DNA damage to thymines by adducts 5
and subject to transcription-coupled repair (9). Signature C also has an extended sequence context dominated by adenines and thymines (fig. S10).
The relative contribution of different signatures within each individual was particularly interesting. APOBEC mutations are responsible for large differences in mutation burden and spectra between clones (Fig. 3D). This contrasts with signatures A-C, which show little variation across clones 10
from the same individual but large differences between individuals (Fig. 3D). For example, signature A contributes ~70% of mutations in all clones from a 53 year-old woman (T03_53F), but is scarcely present (~5% of all mutations) in all clones from a 61 year-old woman (T08_61F). Similarly, signature C contributes over 25% of all mutations in six of the 15 donors, but is undetectable in others (Fig. 3D). The inter-individual differences in mutational signatures, together 15
with the diverse etiology of bladder cancers, is suggestive of variable mutagenic exposures through the urine. This is exemplified by the presence of aristolochic acid mutagenesis in normal urothelium from Chinese patients (30). Smoking is a major risk factor of bladder cancer, increasing risk by 3-4 fold (20). No evidence of the smoking-associated signature (SBS4) was found in any of the individuals, including heavy smokers (table S1), a pattern consistent with the lack of SBS4 20
in bladder cancers from smokers (31). We used a linear mixed-effect regression model to test whether any of the four signatures found may be statistically associated with smoking or alcohol consumption. Despite the small cohort size, signature A was significantly associated with smoking
11
history (linear mixed-effect regression, P-value=9.4e-05, fig. S11) (22), raising the possibility that signature A may result from tobacco smoke mutagens excreted in the urine.
One additional source of heterogeneity across clones was exemplified by the microbiopsy with the highest mutation burden of the cohort, which contained ~6,500 mutations (Fig. 3D and fig. S12). This genome carried a hotspot mutation (N238T) in ERCC2, which is known to cause 5
hypermutation in some bladder cancers through aberrant nucleotide excision repair (32). A total of 8 different ERCC2 mutations were identified in the targeted and exome data, with clear positive selection acting on ERCC2 (Fig. 2), suggesting that this mechanism is relatively common in normal urothelium.
Frequency and spatial distribution of APOBEC clones
10
APOBEC-induced mutations in normal urothelium displayed the characteristic replicational strand bias observed in human cancers and an extended sequence context suggestive of APOBEC3A being the main contributing enzyme (fig. S10) (22, 33). Analysis of APOBEC-positive genomes revealed extensive evidence of mutational clusters, known as kataegis (Fig. 3I) (17). These clusters were modest in size and displayed the typical strandedness observed in cancer genomes. While 15
kataegis in cancers is often reported to occur near rearrangement breakpoints (17), this was not the case in normal urothelium. Overall, the patterns observed here are consistent with replication-associated APOBEC mutagenesis (34).
Analysis of the distribution of APOBEC-positive genomes in their tissue context revealed a suggestive example of spatial clustering of three APOBEC-positive clones (Fig. 3J). To study the 20
frequency and spatial distribution of APOBEC-positive clones, we used signature fitting and a likelihood ratio test to annotate all exomes according to their evidence of APOBEC mutagenesis (22). Across donors, 22% of all microbiopsies of normal urothelium showed evidence of APOBEC
12
mutagenesis (likelihood-ratio test q-value<0.05, Fig. 3K). To determine whether APOBEC-positive clones tend to cluster in space, for each APOBEC-positive clone we calculated the fraction of positive clones surrounding it (Euclidean distance <1mm), both in the real data and in random permutations of the data (fig. S13) (22). This analysis suggests that APOBEC clones appear to be scattered uniformly in the tissue (permutation test P-value=0.92), without evidence of spatial 5
clustering of unrelated clones, suggesting that APOBEC mutagenesis is typically triggered independently in individual cells across the urothelium.
Copy number and rearrangement analyses of normal urothelium revealed that the majority of clones carry no structural variants (22). Copy number alterations were detected in only 28% of urothelial exomes, with the most common changes involving whole or arm-level gains of 10
chromosomes 13, 14, 15 and 16, and losses of chromosomes 9 and 21 (Fig. 3L). Across 55 genomes of normal urothelium, only 30 rearrangements and 3 retrotransposition events were detected (tables S7 and S11) (22). This is in stark contrast with bladder cancers, which display extensive aneuploidy, with an average of ~200 segmental alterations per exome and 1.7 retrotransposition events per genome (35, 36). This pattern is similar to that observed in other 15
normal tissues (3, 4, 7, 9, 37), and it suggests that extensive structural changes are characteristic of later stages of carcinogenesis across a wide range of cancer types.
The mutational landscape in bladder cancer patients
Bladder cancer often presents with multiple synchronous tumors in different parts of the bladder. It remains unclear to what extent this is due to large premalignant clones colonizing distant parts 20
of the bladder or to widespread changes in multiple independent clones across the bladder (38). To explore the mutational landscape of histologically-normal urothelium in bladder cancer patients
13
and to study the genomic changes underlying histologically abnormal areas, we performed laser microdissection of 450 microbiopsies from 19 distant biopsies from five bladder cancer patients. Analysis of histologically-normal urothelium from bladder cancer patients revealed patterns similar to those observed in healthy bladders. As in transplant organ donors, mutant clones were small, typically constrained to single microbiopsies (fig. S2). There seems to be a modest increase 5
in the number of mutations detected per exome (linear mixed-effect regression P-value=0.0068) and in their allele frequencies (P-value=0.00048) in some cystectomy samples (fig. S14) (22). However, differences should be interpreted with caution given the limited cohort size and the considerable inter-individual variation. The fraction of APOBEC-positive microbiopsies was similar in cystectomies and in age-matched transplant organ donors (25% vs 24%, Fisher’s Exact 10
Test P-value=0.91). Driver discovery in 223 microbiopsies of normal-urothelium from bladder cancer patients yielded a very similar driver landscape to that observed in the 15 transplant organ donors and the density of driver mutations detected per microbiopsy appeared comparable (22). Although a much larger number of patients would be required to accurately quantify differences between cohorts, these results suggest that the mutational landscape of histologically-normal 15
urothelium from bladder cancer patients broadly resembles the patchwork of microscopic clones observed in healthy donors. They also suggest that widespread mutational changes in independent clones are unlikely to explain the emergence of multiple tumors in bladder cancer, consistent with the observation that synchronous tumors tend to be clonally related (38-40).
Areas of carcinoma in situ (CIS) were observed in three of the five cystectomies studied. CIS of 20
the bladder is a flat, high-grade urothelial carcinoma restricted to the epithelial layer, which often appears concomitantly with more advanced tumors. 44 CIS microbiopsies were sequenced, including 11 whole-exomes and 5 whole-genomes. Phylogenetic analysis revealed that all CIS
14
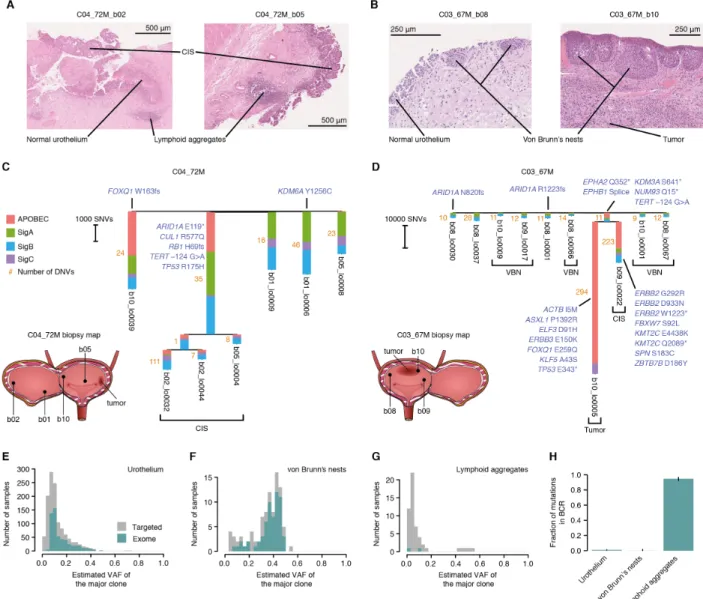
areas sequenced within a patient were clonally related (Fig. 4, A to D, and fig. S15 and S16). In a 72-year-old patient (C04_72M), the same CIS clone was detected in two biopsies several centimeters away from the tumor and from one another, with most mutations being shared across distant biopsies (Fig. 4C). The phylogenetic tree provides a snapshot of the genome of the most recent common ancestor cell that gave rise to this clone. This cell had only a modestly increased 5
burden, largely due to APOBEC, compared to other clones in normal urothelium, but had already acquired driver mutations in ARID1A, RB1 and TP53, as well as a hotspot promoter mutation in TERT (Fig. 4C). In contrast to histologically-normal clones, the CIS showed extensive aneuploidy, including evidence of whole-genome duplication (Fig. 3M). Intriguingly, one of the terminal branches of the CIS clone showed an unusually-high number of CC>AA dinucleotide changes of 10
uncertain origin (Fig. 4C and fig. S17). In a 67-year-old patient (C03_67M) we sequenced an area of CIS and an area of tumor from two separate biopsies. This revealed that the tumor and the CIS had originated from a common ancestor cell that had already acquired putative driver mutations in NUP93, EPHA2 and TERT. The CIS and the tumor diverged early and each subsequently acquired an entirely different complement of driver mutations (Fig. 4D), providing a window into the early 15
evolution of this tumor. This analysis corroborates that CIS clones are genetically highly aberrant and can colonize distant areas of the bladder, forming a hotbed from which invasive tumors can evolve (40, 41). A systematic analysis of tumor and non-invasive areas combining laser microdissection and genome sequencing could help shed light on the order of events in early bladder cancer evolution.
20
Laser microdissection also enabled us to study other histological changes observed in bladder cancer patients. Von Brunn’s nests are groups of urothelial cells in the lamina propria, believed to arise from invagination of the surface urothelium (42). Although they are common in histological
15
sections from bladder cancer patients (Fig. 4B), they can also be seen in small numbers in healthy individuals. Sequencing of 98 microbiopsies revealed that most von Brunn’s nests are single clones, with all cells within a nest derived from a single cell (Fig. 4, E and F). Phylogenetic reconstruction reveals that adjacent nests are clonally unrelated (Fig. 4D). The vast majority of von Brunn’s nests sequenced did not carry a driver mutation; their driver landscape, mutation 5
burden and largely diploid genomes resembled that of the adjacent histologically-normal urothelium. Overall, this is consistent with von Brunn’s nests being benign ectopic growths not actively driven by specific mutations (22). Lymphoid aggregates are also common in cystectomy biopsies (Fig. 4A), reflecting adaptive immunity in the tumor microenvironment, and can also occur in healthy samples with evidence of inflammation (43). We microdissected 82 lymphoid 10
aggregates for deep targeted sequencing, as the targeted gene panel contained probes for the B-cell and T-B-cell receptor loci (22). Unlike von Brunn’s nests, lymphoid aggregates were highly polyclonal, with nearly all of the mutations detected at low allele fractions (Fig. 4G). The only exception was one clonal lymphoid aggregate, which also carried a lymphoid driver IgH/BCL2 translocation (fig. S18). This biopsy was from a donor who had been previously investigated for a 15
possible lymphoma, although the relationship between the clonal lymphoid aggregate and the donor’s clinical history is unclear. Across all lymphoid aggregates, 95% of mutations detected with the panel clustered in the IGH locus and had the characteristic signature of somatic hypermutation (SBS9) (Fig. 4H), confirming the presence of multiple clones of mature B lymphocytes in each aggregate sequenced. These examples showcase the power of laser 20
microdissection and low-input sequencing to inform on the clonal composition and genetic changes underlying different histological structures.
16
Discussion
These data have revealed a rich mutational landscape in healthy and diseased bladder urothelium, with widespread positive selection, extensive APOBEC mutagenesis and large differences in mutation burden, signatures and selection across clones and across individuals.
The heterogeneity in mutational signatures and driver mutations across donors is particularly 5
intriguing and appears larger than that reported in other tissues. Epidemiological studies have linked bladder cancer risk to a diversity of carcinogens, such as smoking, occupational or environmental exposures and recurrent infections (20, 44). Whether carcinogens are genotoxic (inducing mutations) or non-genotoxic (impacting cellular growth or the microenvironment), they are expected to leave distinct marks in the mutational landscape of normal tissues, altering 10
mutation rates, mutation signatures, driver frequencies or clone sizes. Thus, the differences in the mutational landscape across individuals observed here may be expected to reflect the interplay between genetics and a lifetime of different exposures. The differences across donors might raise the possibility of developing personalized risk models (45). However, our results also suggest that differences in normal urothelium between healthy individuals and cancer patients may be subtle, 15
consistent with theories predicting that modest differences in mutation and selection could have considerable impact on risk (46, 47). Systematic analyses of large cohorts of individuals will be needed to quantify the relationship between epidemiological factors, germline variants, changes in the mutational and selective landscape, and risk; enabling the development of mechanistic risk models of cancer development.
20
While somatic mutations have traditionally been studied in the context of cancer, the growing realization that some human tissues become colonized by mutant clones throughout life raises questions about their potential impact in ageing and other diseases. Laser microdissection and
low-17
input sequencing enable the study of somatic mutations associated with histological changes, and could shed new light on somatic evolution in cancer, ageing and non-malignant disease.
18
Acknowledgments:
We are grateful to the families of deceased transplant organ donors and to the patients with bladder cancer for their consent, and to the Cambridge Biorepository for Translational Medicine for access to human tissue. We thank P.H. Jones and J.C. Fowler for their early help with wholemounts; L. 5
Alexandrov for advice on mutational signatures; K. Haase and P. van Loo for their advice on calling copy number changes in exome data using ASCAT; J.M.A. Lawson for artistic contribution to figures; D. Phillips for advice on carcinogen exposure in urine; P. Ellis, P. Nicola, M. Maddison, E. Anderson, S. Gamble, K. Roberts and A. Dooner for technical assistance; J. Hewinson and C. Hardy for their assistance with project management; J. Field-Rayner for consenting patients; and 10
E. Cromwell for tissue processing. Funding: I.M. is funded by Cancer Research UK (C57387/A21777) and the Wellcome Trust. P.J.C. is a Wellcome Trust Senior Clinical Fellow. T.J.M. is funded by Cancer Research UK/Royal College of Surgeons Clinician Scientist Fellowship (C63474/A27176). L.M. is a recipient of a CRUK Clinical PhD fellowship (C20/A20917). Fresh cystectomy samples were acquired as part of the DIAMOND study 15
“Evaluation of biomarkers in urological disease - NHS National Research Ethics Service reference 03/018”, whose infrastructure is part-funded by the Cambridge NIHR BRC and CRUK Cambridge Cancer Centre Urological Malignancies programme. Author contributions: A.R.J.L. and I.M. conceptualized the project, with support from P.J.C., M.R.S. and T.J.M. A.R.J.L. and I.M. led the data analysis, with support from F.A., T.H.H.C., H.V. and S.Z. A.R.J.L led the experimental work, 20
with support from Y.H., L.M.R.H. and A.Ca. T.M.B. and L.M contributed to method development. K.R., M.A.S., A.M., N.W., H.V., J.N., M.G. and I.M developed algorithms and software. L.O., C.L., and K.T.A.M helped with samples and project administration. A.Y.W., K.T.A.M., B.B., A.Co., W.T., B.T., V.G. and K.S.-P collected samples. J.N., J.M.C.T., M.G., K.S.-P., M.R.S., P.J.C., T.J.M. and I.M provided supervision. D.M.R provided histology support. I.M. and A.R.J.L 25
wrote the manuscript, and all authors contributed to reviewing and editing it. Competing interests: Authors declare no competing interests. Data and materials availability: Sequencing data is available in the European Genome-phenome Archive (EGA): EGAD00001006113, EGAD00001006114, EGAD00001006115, EGAD00001006116 and EGAD00001006117. Reproducible code is available in the supplementary material and in 30
https://doi.org/10.5281/zenodo.3966023.
Supplementary Materials
Materials and Methods (including figs. S1 to S18, table S1 and captions for tables S2 to S11). 35
19
Fig. 1. Detection of somatic mutations in bladder by laser microdissection and low-input sequencing.
5
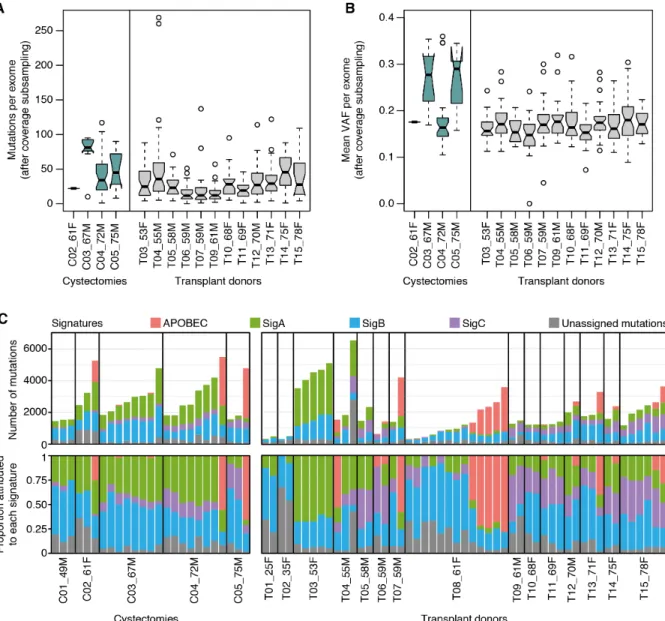
(A) Sequencing strategy and histology image of bladder mucosa (hematoxylin and eosin staining). (B) Combined number of substitutions and indels detected per exome (top) and whole-genome (bottom) across 15 transplant organ donors and 5 patients with bladder cancer. Donor identifiers contain age and gender information in suffix. (C) Distribution of estimated clone lengths for histologically normal urothelium (median indicated by a dashed line) (22).
21
Fig. 2. Positive selection of bladder cancer genes in normal urothelium from organ donors. In panels (A) to (D), analyses are shown for 17 genes under positive selection in normal urothelium and for four other genes frequently mutated in bladder cancer. (A) Number and consequence of mutations detected in histologically-normal urothelium. (B) Observed-to-expected ratios for missense substitutions, truncating (nonsense and essential splice site) substitutions, and indels. (C) 5
Estimated percentage of urothelial cells bearing a mutation for donors aged ≥50 from samples with median on-target coverage ≥50´. (D) Percentage of urothelial carcinomas in The Cancer Genome Atlas (TCGA) with a non-synonymous substitution or indel. Error bars depict 95% Binomial confidence intervals. (E) Scatter plot comparing mutation frequency in bladder cancer (panel D) and the number of non-synonymous mutations in normal urothelium (panel A) for driver genes 10
(colored by biological function) identified in this study and in (18, 19). (F) Comparison of dN/dS values for the 321 cancer genes in the targeted panel to 19,107 cancer passenger genes (defined in (19)). Dashed line indicates a dN/dS value of 1, indicating neutral expectation. (G) Heatmap showing the number of unique non-synonymous mutations in abundant (≥10 mutations) driver genes across transplant organ donors. Sample numbers refer to samples with at least one mutation. 15
Blue boxes indicate statistically-significant combinations of gene and donor (22). (H and I) Histology images annotated with driver mutations and their cellular fractions in sequenced microbiopsies from two transplant organ donors exhibiting enrichment of drivers in KDM6A and ARID1A respectively.
23
Fig. 3. Mutation burden and signatures in normal urothelium.
(A) Scatter plot of donor age vs the median number of substitutions in high-coverage exomes (≥40´ for ≥80% of the exome). The fitted line, R2 value, and P value were obtained by linear regression. (B) Comparison of mutation burden between normal bladder urothelium and bladder cancers. In order to account for subclonality, both a mean lower-bound estimate per cell (22) and 5
the mean number of mutations per microbiopsy are shown for whole-genomes from the 15 transplant organ donors. Bladder cancer data reflects total mutations per genome from Pan-Cancer Analysis of Whole Genomes (PCAWG)(48). (C) Raw mutational spectra for all urothelial genomes combined for three donors. (D) Number (top) and proportion (bottom) of mutations assigned to the four most abundant signatures extracted using a Bayesian hierarchical Dirichlet 10
process (22) for urothelial genomes from transplant organ donors. The weak attribution of signature C to genomes from T08 may reflect overfitting to residual ATT>AAT alignment errors. (E to H) Bar plots depicting mutational spectra, split by type and trinucleotide context, of extracted signatures, as in (17). (I) Intermutational distance plots for urothelial clones free from and affected by APOBEC activity respectively, as in (17). (J) Histology image depicting variability in 15
mutational processes between nearby urothelial microbiopsies. Mutational spectra are from independent clones. (K) Fraction of exomes with evidence of APOBEC mutagenesis (22). Error bars depict 95% Binomial confidence intervals. (L) Proportion of exomes from normal urothelium with large-scale copy number alterations in autosomes (22). Gains (red) and losses (blue) are shown above and below the x-axis respectively. (M) Copy number plots for representative whole-20
24
Fig. 4. The mutational landscape across histological features in patients with bladder cancer.
(A and B) Histology images depicting features microdissected from cystectomy material for two patients with bladder cancer (C04_72M and C03_67M). (C and D) Phylogenetic reconstruction of 5
the evolution of cancer and CIS clones (22). Only microbiopsies with a high degree of clonality (mean VAF ≥0.25) were included. Biopsy maps show the relative positions of macroscopic biopsies (b01-b10) within the bladder. Branches without a feature indicated are histologically-normal urothelium. Branch lengths depict single nucleotide variant (SNV) counts and the number next to each branch denotes assigned dinucleotide variants (DNVs). Driver genes identified in this 10
study and in (18, 19) are annotated. Truncating mutations in EPHB1 and KDM3A are annotated in the branch shared by the CIS and tumor for C03_67M. VBN, von Brunn’s nest. (E to G) Histograms showing the estimated VAF of the major clone in targeted and exome sequencing data for three different histological features: urothelium, von Brunn’s nests and lymphoid aggregates. (H) Proportion of mutations located within the B-cell receptor across histological features.
25
Supplementary Materials for
5Extensive heterogeneity in somatic mutation and selection in the human bladder
Andrew R. J. Lawson, Federico Abascal, Tim H. H. Coorens, Yvette Hooks, Laura O’Neill, Calli Latimer, Keiran Raine, Mathijs A. Sanders, Anne Y. Warren, Krishnaa T. A. Mahbubani, Bethany Bareham, Timothy M. Butler, Luke M. R. Harvey, Alex Cagan, Andrew Menzies, Luiza 10
Moore, Alexandra J. Colquhoun, William Turner, Benjamin Thomas, Vincent Gnanapragasam, Nicholas Williams, Doris M. Rassl, Harald Vöhringer, Sonia Zumalave, Jyoti Nangalia, José M.
C. Tubío, Moritz Gerstung, Kourosh Saeb-Parsy, Michael R. Stratton, Peter J. Campbell, Thomas J. Mitchell, Iñigo Martincorena
15
Correspondence to: [email protected]
This PDF file includes:
20
Materials and Methods Figs. S1 to S18
Table S1
Captions for Tables S2 to S11 25
Other Supplementary Materials for this manuscript include the following:
26
Supplementary Methods
Contents
1. Sample collection and preparation 1.1. Sample collection
1.2. Sample preparation for laser-capture microdissection 5
1.3. Library preparation of microbiopsy cell lysate
1.4. Selection of libraries for different sequencing approaches 1.5. p53 immunohistochemistry
2. DNA sequencing
2.1. Targeted sequencing of 321 cancer-associated genes 10
2.2. Exome sequencing
2.3. Whole-genome sequencing 3. Mutation calling
3.1. Substitution and indel calling from targeted data using ShearwaterML 3.2. Substitution calling from exome and WGS data using CaVEMan 15
3.3. Indel calling from exome and WGS data using cgpPindel 3.4. Structural variant calling from exome data using ASCAT 3.5. Structural variant calling from WGS data
4. Analyses of mutant clones and allele frequencies 4.1. Estimation of mutation burden per cell 20
4.1.1. Aggregating allele fractions 4.1.2. Subclonal decomposition
4.2. Approximate estimates of clone lengths
4.2.1. Relationship between dN/dS and clone sizes
4.3. Lower and upper bound estimates of the fraction of mutant epithelium 25
4.4. Statistical pigeonhole principle 5. Selection and driver analyses
5.1. Driver discovery in transplant donors 5.2. Driver discovery outside of cancer genes 5.3. Driver discovery in bladder cancer patients 30
5.4. Estimation of the number of driver mutations 5.5. Variation in selection between donors across genes
5.6. Germline mutations in genes differentially selected across donors
5.7. Mutation frequency and selection in bladder carcinomas from The Cancer Genome Atlas
35
5.8. Selection at putative antigenic regions 6. Mutational signatures
6.1. De novo signature extraction
6.2. Alternative approaches for signature extraction 6.3. Comparison to reference signatures
40
6.4. Mutational signature analysis in bladder cancer genomes 6.5. Transcriptional and replicational strand asymmetries 6.6. Detection of APOBEC mutagenesis in exomes 6.7. Spatial clustering of APOBEC-positive clones
6.8. Statistical association between mutational signatures, smoking and alcohol 45
27
7. Comparison of normal urothelium between transplant donors and bladder cancer patients 8. Phylogenetic reconstruction
Supplementary Figures
Fig. S1. Comparison of mutations called across sequencing strategies. 5
Fig. S2. Clonal expansions.
Fig. S3. Distribution of mutations within selected genes. Fig. S4. Additional selection analyses.
Fig. S5. Discovery of mutational signatures with HDP de novo.
Fig. S6. Matching extracted de novo mutational signatures to reference signatures. 10
Fig. S7. Alternative mutational signature extraction with SigProfiler and HDP with priors. Fig. S8. Alternative mutational signature extraction with HDP and bladder cancer genomes. Fig. S9. Transcriptional strand asymmetries of mutational signatures.
Fig. S10. Replicational strand asymmetries and extended contexts of mutational signatures. Fig. S11. Statistical association between signature A and smoking history.
15
Fig. S12. Characterization of ERCC2-mutant clone
Fig. S13. Permutation test for the spatial clustering of APOBEC-positive clones. Fig. S14. Mutation burden, VAFs and signatures in bladder cancer patients. Fig. S15. Immunohistochemistry of p53.
Fig. S16. Heatmaps of early embryonic mutations from cystectomy phylogenies. 20
Fig. S17. Dinucleotide variants in cystectomy phylogenies. Fig. S18. Clonal lymphoid aggregate.
Supplementary Tables
Table S1. Donor information. 25
Table S2. Microbiopsy information.
Table S3. Substitution and indel calls from targeted data. Table S4. Substitution and indel calls from exome data. Table S5. Substitution and indel calls from genome data. Table S6. Copy number calls from exome data.
30
Table S7. Rearrangement calls from genome data. Table S8. Driver discovery in transplant donors.
Table S9. Fraction of mutations attributed to each signature per sample. Table S10. Mutational signatures extracted by HDP de novo.
Table S11. Retrotransposition calls from genome data. 35
28
Materials and Methods
1. Sample collection and preparation
1.1Sample collection
Bladder specimens were obtained from two sources: (1) biopsies were taken from the dome of the bladder of deceased individuals from whom organs were being retrieved for transplantation; and 5
(2) multi-region sampling was carried out on material removed by cystectomy as part of the treatment of bladder cancer patients. In the former instance, informed consent for the use of tissue in research was obtained from the donor’s family as part of the Cambridge Biorepository for Translational Medicine program (REC reference: 15/EE/0152 NRES Committee East of England – Cambridge South). In the latter case, cystectomies were performed at the Cambridge University 10
NHS Trust and informed consent was obtained from the patient prior to surgery (REC reference: 03/018 East of England - Cambridge Central Research Ethics Committee).
All samples were anonymized and were handled and processed in accordance with HTA guidelines. No sample size determination, randomization or blinding was carried out as this was a descriptive study. All samples were included for analysis, except those failing library preparation 15
or sequencing.
1.2Sample preparation for laser-capture microdissection
Immediately after collection, specimens underwent formalin-free fixation for 24 hours in PAXgene Tissue FIX containers (PreAnalytiX, Hombrechtikon, Switzerland) before being transferred to PAXgene STABILIZER solution (PreAnalytiX) for storage at -20 °C.
20
Prior to laser-capture microdissection, specimens were processed using a Tissue Tek VIP 6 AI tissue processor (Sakura Finetek, Leiden, Netherlands), embedded in paraffin and sectioned using an Accu-Cut SRM 200 microtome (Sakura Finetek). For each specimen, reference slides were prepared using 5 µm sections obtained at the beginning and end of each cutting session. These were mounted on Superfrost Plus glass microscope slides (VWR International, Lutterworth, UK), 25
stained with hematoxylin and eosin (H&E; Leica Microsystems, Wetzlar, Germany), permanently coverslipped using CV Mount (Leica Microsystems) and imaged using a NanoZoomer 2.0-HT slide scanner (Hamamatsu Photonics, Hamamatsu, Japan). Sections for laser-capture microdissection were mostly cut at a thickness of 16 µm (see table S2 for exceptions) and mounted on polyethylene naphthalate (PEN) membrane glass slides (Leica Microsystems). These were 30
stained with H&E, dipped in a xylene substitute, Neo-Clear (Merck, Darmstadt, Germany), and temporarily coverslipped before imaging on the slide scanner. Images obtained from the slide scanner were viewed using the NDP.view2 software.
Microbiopsies were dissected using an LMD7 microscope (Leica Microsystems). Detailed information on each microbiopsy is available in table S2. Images of the selected regions were 35
captured immediately before and after microdissection. Proteolysis of isolated regions was performed using an Arcturus PicoPure DNA Extraction Kit (Thermo Fisher Scientific, Waltham, MA, USA). Cell lysate was stored at -20 °C prior to library preparation.
29 1.3Library preparation of microbiopsy cell lysate
Library preparation was automated using an Agilent Bravo NGS workstation (Agilent, Santa Clara, CA, USA). Solid-phase reversible immobilization (SPRI) DNA purification was carried out using Agencourt AMPure XP beads (Beckman Coulter, Indianapolis, IN, USA). In order to minimize gDNA losses caused by incomplete elution, subsequent library preparation steps used 5
the entire post-elution sample (including beads) as input. Fragmentation, end repair, dA-tailing and adapter ligation steps were performed using an NEBNext Ultra II DNA Library Prep Kit (New England Biolabs, Ipswich, MA, USA). All libraries were prepared with a mean insert size of ~350 bp to ensure they were suitable for both sequence capture and whole-genome sequencing. Twelve cycles of PCR amplification were carried out using a KAPA HiFi PCR Kit (Roche, Wilmington, 10
MA, USA). Libraries were eluted in 25 µl nuclease-free water (Thermo Fisher Scientific) and quantified using an AccuClear Ultra High Sensitivity dsDNA Quantification Kit (Biotium, Fremont, CA, USA).
1.4Selection of libraries for different sequencing approaches
Having evaluated the relationship between library concentration and complexity, a minimum 15
library concentration of 20 ng/µl was required for targeted, exome and whole-genome sequencing (see table S2 for exceptions). For most donors, all libraries with sufficient yield were initially sent for targeted sequencing of 321 cancer-associated genes. A small number of libraries from each donor were subsequently selected for whole-genome sequencing based on the presence of high variant allele fraction (VAF ≥0.2) mutations in the targeted sequencing data. By contrast, the 20
library selection for exome sequencing was performed without referring to the VAFs in the targeted sequencing data in order to avoid biasing our mutation burden estimates. Instead, samples were selected for exome sequencing based on their library concentrations and the avoidance of duplicate regions. For four transplant donors (T04_55M, T05_58M, T10_68F and T14_75F) and two cystectomy patients (C01_49M and C05_75M), some or all of the exomes from these 25
individuals do not have matched targeted sequencing data from the same library (tables S1 and S2).
1.5p53 immunohistochemistry
Sections (5 µm thick) were mounted on Superfrost Plus glass microscope slides (VWR 30
International) and endogenous peroxidase activity was blocked by incubation with hydrogen peroxide and methanol. Non-specific binding sites were blocked by incubating slides in 3% horse serum in Tris-buffered saline. Slides were incubated overnight at 4 °C with a mouse monoclonal p53 antibody (Santa Cruz Biotechnology, Dallas, TX, USA; Cat# sc-126, RRID:AB_628082) diluted 1 in 750 in 1.5% horse serum in Tris-buffered saline. Secondary antibody incubation and 35
visualization were performed using a Vectastain Elite ABC HRP Kit (Vector Laboratories, Burlingame, CA, USA; Cat# PK-6100, RRID:AB_2336819). Slides were counterstained with hematoxylin (Vector Laboratories), coverslipped using CV Mount (Leica Microsystems) and imaged using a NanoZoomer 2.0-HT slide scanner (Hamamatsu Photonics).
30
2. DNA sequencing
2.1Targeted sequencing of 321 cancer-associated genes
We designed a custom Agilent SureSelect bait set to capture the exonic regions of the following 321 cancer-associated genes:
ABL1, ACVR1, ACVR1B, ACVR2A, AJUBA, AKT1, ALB, ALK, AMER1, APC, AR, ARHGAP35, 5
ARID1A, ARID1B, ARID2, ARID5B, ASXL1, ATM, ATP1A1, ATP1B1, ATP2A2, ATP2B3, ATP7B,
ATR, ATRX, AXIN1, AXIN2, B2M, BAP1, BCOR, BIRC3, BRAF, BRCA1, BRCA2, CACNA1D, CALR, CARD11, CASP8, CBFB, CBL, CBLB, CCND1, CCNE1, CD58, CD79A, CD79B, CDC73, CDH1, CDK12, CDK4, CDK6, CDKN1A, CDKN1B, CDKN2A, CDKN2B, CDKN2C, CEBPA, CFH, CIB3, CIC, CMTR2, CNOT3, COL2A1, CPA2, CREBBP, CRLF2, CSF1R, CSF3R, CTCF, 10
CTNNA1, CTNNB1, CUL3, CUX1, CXCR4, CYLD, DAXX, DDR2, DDX3X, DICER1, DNM2, DNMT3A, EEF1A1, EGFR, EIF1AX, ELF3, EML4, EP300, EPHA2, EPS15, ERBB2, ERBB3,
ERCC2, ERG, ERRFI1, ESR1, ETNK1, EZH2, FAM104A, FAM46C, FAM58A, FAT1, FAT2,
FBXO11, FBXW7, FGFR1, FGFR2, FGFR3, FLT1, FLT3, FLT4, FOSL2, FOXA1, FOXA2, FOXL2, FOXP1, FOXQ1, FTH1, FTL, FUBP1, GAGE12J, GATA1, GATA2, GATA3, GATA4, 15
GJA1, GNA11, GNA13, GNAQ, GNAS, GPS2, GRIN2A, H3F3A, H3F3B, HAMP, HFE, HFE2, HGF, HIST1H2BD, HIST1H3B, HLA-A, HLA-B, HLA-C, HNF1A, HOXB3, HRAS, IDH1, IDH2, IGF1R, IGSF3, IKBKB, IKZF1, IL6R, IL6ST, IL7R, IRF2, IRF4, JAK1, JAK2, JAK3, KCNJ5, KDM5C, KDM6A, KDR, KEAP1, KIT, KLF4, KLF5, KLF6, KMT2A, KMT2B, KMT2C, KMT2D,
KRAS, LIPF, LRP1B, MAP2K1, MAP2K2, MAP2K4, MAP2K7, MAP3K1, MAX, MED12, MEN1, 20
MET, MGA, MLH1, MPL, MSH2, MSH6, MTOR, MYC, MYCN, MYD88, MYOD1, NCOR1, NF1, NF2, NFE2L2, NFKBIE, NKX2-1, NOTCH1, NOTCH2, NOTCH3, NOTCH4, NPM1, NQO1,
NRAS, NSD1, NT5C2, NTRK3, PALB2, PAX5, PBRM1, PCLO, PCMTD1, PDGFRA, PDYN, PHF6, PHOX2B, PIK3CA, PIK3R1, PIK3R3, PLCG1, POLE, POT1, POU2AF1, PPM1D, PPP2R1A, PPP6C, PRDM1, PREX2, PRKACA, PRKAR1A, PTCH1, PTEN, PTPN11, PTPN3, 25
PTPRB, QKI, RAC1, RAC2, RAD21, RASA1, RB1, RBM10, RET, RHBDF2, RHOA, RHOB, RIT1, RNF43, ROBO2, RPL10, RPL22, RPL5, RPS6KA3, RREB1, RUNX1, SERPINA1, SETBP1, SETD2, SF3B1, SFTPA1, SFTPB, SFTPC, SH2B3, SLC10A1, SLC40A1, SMAD2, SMAD4, SMARCA4, SMARCB1, SMC3, SMO, SMTNL2, SOCS1, SOX2, SOX9, SPEN, SPOP, SRC, SRSF2,
STAG2, STAT3, STAT5B, STK11, SUFU, TBL1XR1, TBX3, TCF7L2, TEK, TENM1, TERT, TET2,
30
TFR2, TG, TGFBR2, TGIF1, TMEM170A, TMEM51, TNFAIP3, TNFRSF14, TP53, TP63, TRAF7,
TSC1, TSC2, TSHR, TYRO3, U2AF1, UBR5, VEGFA, VHL, WT1, XBP1, XIRP2, XPO1, ZFHX3,
ZFP36L1, ZNF750 and ZRSR2.
Highlighted in blue are 40 genes that were previously identified as being under significant positive selection in bladder cancer (18, 19). There are 22 additional genes that were found to be 35
significantly mutated in urothelial carcinoma in these studies but were omitted from the targeted capture panel: ACTB, ASXL2, C3orf70, CUL1, EPS8, HES1, KANSL1, MB21D2, MBD1, METTL3, NUP93, PARD3, PSIP1, RXRA, SF1, SPN, SPTAN1, SSH3, TAF11, TMCO4, USP28 and ZBTB7B. Another notable gene absent from the targeted panel is UTY, a member of the Histone H3 Lysine 27 (H3K27) demethylase gene family, which is present on the Y chromosome and is homologous 40
31
In addition to the cancer-associated genes listed above, we included the following regions in the targeted panel: two non-coding RNA genes (MALAT1 and NEAT1); promoter regions for eight genes (ARID1A, CDKN2A, EGFR, ERBB2, MYC, PLEKHS1, TERT and TP53); three regions responsible for generating diversity in immune cells (IGH, TRB and TRD) and eighteen L1 retrotransposition hotspots. Common SNPs within or around the targeted genes were also included 5
in the bait set to facilitate copy number analyses. The total size of the targeted panel was 1.99 Mb. Samples were multiplexed to an average pool size of 32 and sequenced using 75 bp or 150 bp paired-end reads on Illumina HiSeq 4000 machines (table S2). Paired-end reads were aligned to human genome assembly GRCh37 using BWA-MEM (49). Duplicate reads were marked using biobambam (50). Library complexity and coverage statistics were calculated using Picard 10
(http://broadinstitute.github.io/picard/). The median on-target coverage across all samples and genes was 89´. Across donors, median coverage ranged from 30´ (C02_61F) to 152´ (C03_67M). As the detection of low VAF mutations can be greatly impacted by index hopping or by sample contamination with DNA from other individuals, VerifyBamID (51) was run to ensure that the sequencing data included in this study were unaffected by these issues.
15
Due to the use of laser-captured microbiopsies instead of macroscopic biopsies, the coverage achieved in this study was lower than that of two previous studies from our team (3, 7). Coverage was limited by the library complexity achievable from small microbiopsies of 16µm-thick histology sections. However, the coverage per unit area of epithelium, and so the estimated sensitivity to detect microscopic mutant clones, is considerably higher in the current study 20
compared to those previous studies. 2.2Exome sequencing
Exome capture was performed using an Agilent SureSelect All Exon v5 bait set (S04380110). Samples were multiplexed and sequenced using 150 bp paired-end reads on either Illumina HiSeq 4000 (average pool size of 13) or Illumina NovaSeq (average pool size of 48) machines (table S2). 25
Paired-end reads were aligned to human genome assembly GRCh37 using BWA-MEM (49). Duplicate reads were marked using biobambam (50) and sample contamination estimates were calculated using VerifyBamID (51). Library complexity and coverage statistics were calculated using Picard (http://broadinstitute.github.io/picard/). The median on-target coverage across all samples and genes was 72´. Across donors, median coverage ranged from 29´ (T08_61F) to 99´
30
(T10_68F).
2.3Whole-genome sequencing
Whole-genome sequencing was performed on selected microbiopsies that were identified as likely having a high degree of clonality from the variant allele fractions observed in targeted or exome sequencing data of the same library (methods S1.4). Samples were sequenced using 150 bp paired-35
end reads on either Illumina HiSeq 4000 or Illumina NovaSeq machines (table S2). Paired-end reads were aligned to human genome assembly GRCh37 using BWA-MEM (49) and duplicate reads were marked using biobambam (50). The median coverage across all samples was 33´. Across samples, median coverage ranged from 17´ (T06_59M_b01_lo0091) to 60´
(T07_59M_b01_lo0038). 40
32
In order to test the reproducibility of variant calling from independent libraries for whole-genomes, two sets of duplicates (T08_61F_b01_lo0008 and T08_61F_b01_lo0048; T08_61F_b01_lo0035 and T08_61F_b01_lo0181) and one triplicate set (T08_61F_b01_lo0071, T08_61F_b01_lo0079 and T08_61F_b01_lo0091) were sequenced from microbiopsies of corresponding stretches of urothelium isolated from neighboring histology sections.
5
3. Mutation calling
3.1Substitution and indel calling from targeted data using ShearwaterML
As in our previous work on sun-exposed skin and esophagus, ShearwaterML was used to detect substitutions and indels present at low VAFs in the targeted sequencing data (3, 7, 52). This 10
algorithm is publicly available as part of the deepSNV R package (https://github.com/gerstung-lab/deepSNV). In order to generate the base-specific error model, we used a collection of 75 smooth muscle, lamina propria and blood vessel microbiopsies (table S2) that were processed using the same library preparation protocol as the urothelium samples (methods S1.3), resulting in an average background coverage of 6,210´.
15
Unmapped reads, duplicate reads, failed reads, secondary and supplementary alignments, reads with mapping quality scores <55 and bases with Phred quality scores <30 were excluded from coverage calculations. Overdispersion values were estimated within the interval [10-6, 0.32]. P-values were subject to multiple testing correction using Benjamini & Hochberg’s False Discovery Rate (53) and a q-value cut-off of 0.01 was used to call somatic mutations. Consecutive 20
substitutions were merged into a single event, as were consecutive indels providing their VAFs were found to be compatible using a Fisher’s exact test. Additional filtering against artefacts introduced at cruciform DNA sites was applied as described in the following section (methods S3.2).
Many common germline SNPs were already absent from the ShearwaterML calls due to their 25
presence in the matched normal panel. Mutations present at VAF ≥0.25 in any of the non-urothelium microbiopsies were excluded from all other samples from the same donor as putative rare germline SNPs.
Substitution and indel calls for targeted data are available in table S3. 3.2Substitution calling from exome and WGS data using CaVEMan 30
For exome and whole-genome sequencing data, substitutions were called using CaVEMan (Cancer Variants through Expectation Maximization) (https://cancerit.github.io/CaVEMan/) (54). In order to increase the sensitivity of CaVEMan for calling subclonal variants, the following parameters were used: mutant copy number = 5; wild type copy number = 2; and normal contamination = 0.1. 35
The following smooth muscle, lamina propria or blood vessel microbiopsies were used as matched normals for variant calling in the exomes:
33
T01_25F_b01_lo0056, T02_35F_b06_lo0049, T03_53F_b08_lo0030, T04_55M_b01_lo0011, T05_58M_b01_lo0028, T06_59M_b01_lo0220, T07_59M_b01_lo0047, T08_61F_b01_lo0207, T09_61M_b02_lo0016, T10_68F_b01_lo0047, T11_69F_b03_lo0024, T12_70M_b04_lo0023, T13_71F_b06_lo0070, T14_75F_b02_lo0019, T15_78F_b09_lo0008, C01_49M_b01_lo0023, C02_61F_b01_lo0036, C03_67M_b09_lo0035, C04_72M_b05_lo001 and
5
C05_75M_b10_lo0006.
Similarly, the following microbiopsies were used as matched normals for variant calling in the whole-genomes:
10
T01_25F_b04_lo0040, T02_35F_b05_lo0008, T03_53F_b08_lo0029, T04_55M_b01_lo0011, T05_58M_b01_lo0028, T06_59M_b01_lo0220, T07_59M_b01_lo0048, T08_61F_b01_lo0084, T09_61M_b01_lo0012, T10_68F_b01_lo0047, T11_69F_b05_lo0089, T12_70M_b02_lo0018, T13_71F_b06_lo0051, T14_75F_b02_lo0019, T15_78F_b09_lo0028, C01_49M_b01_lo0023, C02_61F_b01_lo0012, C03_67M_b08_lo0055, C04_72M_b06_lo0055 and
15
C05_75M_b10_lo0021.
As reported previously (10, 37), the enzymatic fragmentation step used in our low-input library preparation protocol can introduce artefactual calls from the incorrect processing of cruciform DNA that are not excluded by the standard filters in the CaVEMan algorithm. Therefore, the 20
following post-processing steps were carried out:
(1) Variants where the median alignment score of reads supporting the variant is <120 were excluded.
(2) Variants where the median number of bases clipped from the supporting reads was >0 were 25
excluded.
(3) Variants that were supported by <3 supporting read pairs (fragments) were excluded. (4) For variants that were supported by a low number of reads (0-1) on a particular strand, it
was required of the other strand that either ≤90% of supporting reads had the variant located within the first 15% of the read or that the median absolute deviation of the variant position 30
was >0 and the standard deviation of the variant position was ≥4.
(5) For variants with sufficient support from both strands (≥2 reads), it was required for both strands separately that ≤90% supporting reads had the variant located within the first 15% of the read or that the median absolution deviation and standard deviation were both greater than 2 or that the standard deviation for one strand was >10.
35
(6) For exomes, if the same variant was called in ≥⅓ of samples from a donor, it was deemed likely to be a germline variant and was excluded. The 96 variants removed by this filter were manually reviewed and all deemed unlikely to be somatic variants. This filter removed a median of 2 variants from the cystectomy patients and a median of 3 variants from the transplant donors.
40
For samples with matched targeted sequencing data, there was good agreement between the variants called by ShearwaterML and CaVEMan (fig. S1, A to C and G to I). Most discordant calls were due to drop-out of low VAF mutations in the exome or whole-genome call sets, which had lower coverage than the targeted data.
34
Substitution calls for the exomes and whole-genomes are available in tables S4 and S5 respectively.
3.3Indel calling from exome and WGS data using cgpPindel
For exome and whole-genome sequencing data, small insertions and deletions (indels) were called 5
using cgpPindel (https://github.com/cancerit/cgpPindel) (55). The same matched normal samples were used for each donor as for substitution calling with CaVEMan (methods S3.2). In addition, the following post-processing steps were carried out:
(1) Variants were required to pass the simple repeat filter (F017). 10
(2) Variants with a REP score >3 were excluded. (3) Variants with a reported VAF of 0 were excluded.
(4) For exomes, variants that were called in multiple samples were manually reviewed. Of the 169 variants called in more than one sample, 55 were excluded as putative germline or artefactual calls.
15
As with substitutions, there was a high degree of concordance between Shearwater and cgpPindel calls for microbiopsies with both targeted and exome sequencing data (fig. S1, D to F). However, the recovery of high VAF calls by cgpPindel from within the targeted bait region was considerably worse for whole-genome samples than for exome samples (fig. S1, J to L). This difference in 20
behavior was largely due to the performance of F016, one of the cgpPindel filters that is applied solely to whole-genome sequencing data. Removing this filter resulted in a large number of calls that were deemed likely to be artefacts and so the final call set for the whole-genome data has had the F016 filter applied.
25
Indel calls for the exomes and whole-genomes are available in tables S4 and S5 respectively. 3.4Structural variant calling from exome data using ASCAT
For the exome data, structural variants were called using ASCAT (allele-specific copy number analysis of tumors) (56, 57). The same matched normal samples were used for each donor as for 30
substitution calling with CaVEMan (methods S3.2). Alleles were counted at SNP sites identified outside of the HLA locus in phase 3 of the 1000 Genomes Project (58). B-allele fractions and logR values were calculated for SNPs with at least 20× coverage in the matched normal sample. A penalty score of 150 was used for ASPCF segmentation.
35
Of the 655 non-reference exomes sequenced, structural variant calls are provided for 370 of them. The list of samples that were used for structural variant calling are given in the second sheet of table S6. Only calls from 295 urothelial samples are plotted in Fig. 3L. The following exclusion criteria were applied for selecting exomes for structural variant calling:
40
(1) As ASCAT is not well-suited to the detection of subclonal copy number variants, we excluded 246 samples that did not exhibit strong evidence of containing a major subclone from their substitution and indel calls. In order for a sample to be included, we required it to have at least two substitution or indel calls with VAF ≥0.2 and total depth ≥30.
(2) Two samples were excluded as ASCAT was unable to find an optimal ploidy solution. 45