Citation Vanbinst, K., Ghesquière, P. and De Smedt, B. (in press). Profiles of children’s arithmetic fact development: a model-based cluster analysis. Journal of Experimental Child Psychology.
Archived version Author manuscript: the content is identical to the content of the published paper, but without the final typesetting by the publisher
Published version
Journal homepage http://www.sciencedirect.com/science/journal/00220965
Corresponding author
contact [email protected]
Senior author contact [email protected] +32 (0)16 325705
IR
Profiles of children’s arithmetic fact development: A model-based clustering approach
Introduction
Being skillful in single-digit arithmetic forms a major building block for future growth in more complex calculation skills (e.g., Kilpatrick, Swafford, & Findell, 2001). Previous studies have reported that there exists large subject-variability in the acquisition and use of arithmetic facts (e.g., Barrouillet, Mignon, & Thevenot, 2008; Dowker, 2005; Hanich & Kaplan, 2003). The current longitudinal study investigated children’s arithmetic fact development by applying for the first time a model-based clustering approach on different parameters of arithmetic fact mastery assessed at the start of three subsequent school years, i.e. third, fourth and fifth grade. Different from a theory-driven top-down approach with a priori cut-off criteria to define subgroups, we employed a data-driven bottom-up approach to delineate clusters or profiles of arithmetic fact development by using model-based clustering (see Reeve, Reynolds, Humberstone, & Butterworth, 2012 for an example in the domain of numerical magnitude processing). This method additionally provides the opportunity to examine whether distinct profiles of arithmetic fact development also differ in terms of cognitive skills that have been associated with individual differences in single-digit arithmetic, such as numerical magnitude processing, working memory and phonological processing.
Arithmetic fact development
Numerous studies have described how children develop strategies to solve single-digit arithmetic (e.g., Bailey, Littlefield, & Geary, 2012; Siegler, 1996). Over time, children rely less on effortful and time-consuming procedural strategies, such as finger counting or decomposition, but they increasingly use direct and fast retrieval of arithmetic facts (e.g., Bailey et al., 2012; Barrouillet et al., 2008; Geary, 2013; Siegler, 1996). Jordan, Hanich and Kaplan (2003) distinguished subgroups of arithmetic fact mastery based on children’s performance on a forced arithmetic fact retrieval task at the end of third grade by using a priori determined cut-off criteria. The subgroup of children with poor arithmetic fact mastery (i.e., children with a score below the 25th percentile) showed little growth over time compared to children with good arithmetic fact mastery (i.e., a score between the 51st and 75th percentile). These data suggested that difficulties in arithmetic fact mastery are highly persistent. One major issue in this study concerns the top-down categorization of children into subgroups based upon
predetermined cut-off criteria. It remains to be determined whether similar profiles can be identified when a data-driven bottom-up approach is used. The present study therefore aimed to investigate profiles of arithmetic fact development by means of cluster analysis and further examined whether these profiles differed in terms of cognitive skills that are known to contribute to individual
differences in single-digit arithmetic, comprising numerical magnitude processing, working memory and phonological processing. This allowed us to provide a more precise description of the cognitive characteristics of different profiles of arithmetic fact development in children.
Numerical magnitude processing
Various studies have linked proficient numerical magnitude processing skills or people’s elementary intuitions about quantity and their ability to understand the meaning of symbolic numbers (i.e., that they represent quantity), to individual differences in higher-level mathematics achievement (see Chen & Li, 2014 and Fazio, Bailey, Thompson & Siegler, 2014, for a meta-analysis; see De Smedt, Noël, Gilmore, & Ansari, 2013, for a narrative review). Two recently conducted meta-analyses revealed that children’s nonsymbolic numerical magnitude processing skills were significantly
associated with their mathematics achievement, although these associations were rather moderate (Chen & Li, 2014; Fazio et al., 2014). There exists, however, some debate on associations between nonsymbolic numerical magnitude processing and mathematics achievement (see De Smedt et al., 2013; for a discussion), because some studies failed to find such (longitudinal) associations (e.g., Holloway & Ansari, 2009; Sasanguie, Van den Bussche & Reynvoet, 2012a; Vanbinst, Ghesquière & De Smedt, 2012; see De Smedt et al., 2013 for a narrative review). In contrast, it has been argued that the results for symbolic numerical magnitude processing are more consistent (e.g., Bugden & Ansari, 2011; De Smedt, Verschaffel, & Ghesquière, 2009; Sasanguie, Van den Bussche, & Reynvoet, 2012b), as indicated by a narrative review by De Smedt et al. (2013). A meta-analysis examining the
association between symbolic numerical magnitude processing and mathematics achievement has, unfortunately, to the best of our knowledge, not yet been conducted.
While most of these previous studies have focused on associations between numerical magnitude processing and children’s general mathematics achievement, little attention has been paid to how variations in the ability to process numerical magnitudes might contribute to individual
differences in arithmetic fact mastery. There are however arguments to claim such a connection. For example, initially, children count all the numbers in a problem (e.g., 1, 2, 3, 4, 5, 6, 7 to solve 3 + 4), and they gradually move on to counting on from the larger number in a problem (4, 5, 6, 7 to solve 3 + 4) (e.g., Siegler, 1996), which requires a decision on the larger number and therefore draws on the understanding of numerical magnitudes. Against this background, proficient numerical magnitude processing skills might induce this transition to the counting-on-larger strategy, which in turn might foster the memorization of problem-answer associations or the development of arithmetic facts (Booth & Siegler, 2008). Furthermore, it is possible that arithmetic facts are stored in long-term memory in a meaningful way, i.e. according to their magnitude (e.g., Butterworth, Zorzi, Girelli, & Jonckheere, 2001; Robinson, Menchetti, & Torgesen, 2002). A cross-sectional study by Vanbinst et al. (2012) in third graders investigated the direct associations between numerical magnitude processing and individual differences in arithmetic strategy use. They found a significant association between symbolic numerical magnitude comparison and the frequency of arithmetic fact retrieval, which indicated that children who were more proficient in discriminating Arabic digits relied more frequently on arithmetic fact retrieval when solving single-digit additions and subtractions. No associations with nonsymbolic numerical magnitude processing were observed. In the present study, we intended to explore whether children with distinct profiles of arithmetic fact development differed in nonsymbolic and symbolic numerical magnitude processing.
Working memory
Previous studies extensively reported on how working memory plays a central role in
individual differences in arithmetic fact mastery (see Friso-van den Bos, van der Ven, Kroesbergen, & van Luit, 2013, for a meta-analysis). Most of these studies have adopted Baddeley’s multi-component model of working memory as their theoretical framework (Baddeley, 1986). At the core of this model is the central executive, which is responsible for the attention-driven control, regulation and
monitoring of complex cognitive processes. The model also encompasses two slave systems of limited capacity, which are used for the temporary storage of visual and spatial information (visuo-spatial sketchpad) as well as verbal information (phonological loop).
A recent meta-analysis by Friso-van den Bos and colleagues (2013) highlighted that in particular the central executive supports children’s arithmetic fact development. This component might help to store and remember (intermediate) answers during arithmetic problem solving (Bull, Johnston, & Roy, 1999; Barrouillet & Lépine, 2005; Hitch & McAuley, 1991; Imbo &
Vandierendonck, 2007b). Geary, Hoard, Byrd-Craven and DeSoto (2004) further argued that a child with difficulties in this component may rely longer on finger counting and may commit more counting errors.
Findings regarding the impact of the slave systems on arithmetic fact mastery are less clear (see Friso-van den Bos et al., 2013, for a meta-analysis). Whereas the visuo-spatial sketchpad and phonological loop have been found to be associated with strategy use in some studies (e.g., Bull & Johnston, 1997; De Smedt et al., 2009), others have reported only weak or no correlations (e.g., Wu et al., 2008). Children use a variety of strategies to solve single-digit arithmetic and this mix of strategies changes over time. Initially, (young) children rely heavily on (visuo-spatial) strategies, such as finger counting, which are assumed to depend on the functioning of the visuo-spatial sketchpad (e.g., McKenzie, Bull, & Gray, 2003; Rasmussen & Bisanz, 2005). The phonological loop might be involved in the process of accurately memorizing basic arithmetic facts (Bull & Johnston, 1997) and therefore the role of the phonological loop might become particularly important when children increasingly rely on more advanced solution strategies (e.g., Barrouillet & Lépine, 2005; De Smedt et al., 2009; Dowker, 2005; Geary, 2004; Geary, Hoard, Byrd-Craven, Nugent, & Numtee, 2007; Geary, Hoard, & Nugent, 2012; Imbo & Vandierendonck, 2007a). Against this background, we aimed to explore whether distinct profiles of arithmetic fact development differ on tasks that tap into the central executive, the visuo-spatial sketchpad and the phonological loop.
Phonological processing
Behavioral (e.g., De Smedt, Taylor, Archibald, & Ansari, 2010; Simmons & Singleton, 2008; Swanson & Sachse-Lee, 2001; Vukovic & Lesaux, 2013) and neuroimaging data (e.g., Dehaene, Piazza, Pinel, & Cohen, 2003) have suggested a specific association between phonological processing and arithmetic fact mastery. More precisely, it has been proposed that problem-answer associations, or arithmetic facts might be stored in long-term memory in a phonological way. Consequently, impaired
phonological processing skills may coincide with difficulties in storing and remembering these arithmetic facts (e.g., Koponen, Salmi, Eklund & Aro, 2013; Robinson et al., 2002; Swanson & Sachse-Lee, 2001; Vukovic & Lesaux, 2013). This fits the observation that children with learning difficulties in reading or dyslexia, who are marked by a phonological processing deficit, also experience difficulties in arithmetic fact mastery (e.g., Simmons & Singleton, 2008). The ability to form more distinct long-term phonological representations of arithmetic facts may foster an increase in children’s reliance on arithmetic fact retrieval and, hence, a decrease in the use of counting strategies when solving single-digit arithmetic (De Smedt et al., 2010).
We distinguished the three classic areas of phonological processing (Wagner & Torgesen, 1987), i.e. phonological working memory (analogous to the phonological loop of Baddeley’s working memory model), phonological awareness and rate of access to long-term memory, which all have been linked to individual differences in single-digit arithmetic (e.g., Fuchs et al., 2005). De Smedt and colleagues (2010) provided behavioral evidence that phonological awareness was associated with fourth and fifth graders arithmetic fact mastery, indicating that the quality of children’s long-term phonological representations might be a key factor for efficient arithmetic fact mastery. Several researchers have further argued that individual differences in children’s speed of retrieving arithmetic facts when solving single-digit arithmetic was influenced by their rate of accessing phonological representations from long-term memory, i.e., rapid automatized naming (Hecht, Torgesen, Wagner, & Rashotte, 2001; Koponen, Aunola, Ahonen, & Nurmi, 2007; Swanson & Kim, 2007). In light of these prior research findings, the current study sought to explore whether children with distinct profiles of arithmetic fact development also differed in phonological processing.
The present study
To date, a model-based clustering approach has rarely been used in research on mathematical cognition. Two previous studies applied this approach to investigate subtypes of mathematical learning difficulties (MLD) or dyscalculia (Bartelet, Ansari, Vaessen, & Blomert, 2014; von Aster, 2000). Recently, Reeve and colleagues (2012) used cluster analysis to investigate children’s number development and they distinguished three clusters on the basis of children’s performance on dot enumeration and number comparison tasks. Extending the existing body of research, the present
longitudinal study is the first to investigate inter-subject variability in children’s arithmetic fact development by using a model-based clustering approach. This approach allows us to form subgroups based upon empirically derived differences in parameters of arithmetic fact mastery repeatedly assessed over developmental time.
The present study assessed children’s arithmetic fact mastery at the start of third, fourth and fifth grades. We focused on this age group because we wanted to study the development of children who had already acquired a considerable number of arithmetic facts. Specifically, we administered a single-digit addition and subtraction task and simultaneously assessed strategy use with verbal protocols by asking children on a trial-by-trial basis which strategy they used (Siegler, 1996). In order to characterize children’s arithmetic fact mastery as precisely as possible, we derived three parameters from these arithmetic tasks. First, we used the verbal report data to determine the frequency with which children used fact retrieval. Second, we considered the efficiency with which children solved the arithmetic problems. Efficiency is typically operationalized in terms of solution speed and accuracy, but as all children had very high levels of accuracy on the arithmetic tasks we only considered mean reaction times. We reasoned that children who solve single-digit additions and subtractions particularly fast mainly rely on fast and efficient retrieval of arithmetic facts. On the other hand, children who performed slower probably used less efficient retrieval and/or more effortful and time-consuming procedural strategies, such as decomposition or even finger counting. Finally, we considered children’s variance of the reaction times as an index of the consistency with which children use different strategies. We reasoned that children with small variances in their reaction time would be more consistent in their application of strategies compared to those with large variances in their reaction time. These parameters were calculated at the start of third grade and subsequently fourth and fifth grade, to investigate how children’s arithmetic fact mastery evolves over time. By applying a clustering approach on the parameters of arithmetic fact mastery assessed across different time points, the current study attempted to capture different clusters or profiles of arithmetic fact development. In order to carefully characterize these profiles of arithmetic fact development, we further compared these profiles on various cognitive skills that have been associated with individual differences in single-digit arithmetic namely numerical magnitude processing, working memory and phonological
processing. Against the background of the literature reviewed above, we expected that if different profiles of arithmetic fact development could be identified, these profiles would also differ on tasks that measure children’s numerical magnitude processing, working memory and phonological processing.
Method Participants
Participants were recruited from three elementary schools in Flanders (Belgium), resulting into a random sample of 75 third-graders (September 2011). One year later, at the start of fourth grade (September 2012) arithmetic data were available for 68 participants of the initial sample. At the start of fifth grade (September 2013) arithmetic data were available for 52 participants. We only included those participants whose arithmetic data were available at the three time points. School absence at one or more time points, due to illness or changing schools, led to missing data. This final sample (n = 52) comprised 31 girls and 21 boys. The mean age at the start of third grade was 8 years and 2 months (SD = 2 months). The participants came predominantly from middle- to upper middle-class families and their native language was Dutch. They had no history of intellectual disability, autism spectrum disorder or attention-deficit/hyperactivity disorder and none had repeated a grade. For all participants, written informed parental consent was obtained.
Materials
Materials consisted of standardized tests, paper-and-pencil-tasks and computer tasks designed with the E-prime 1.0 software (Schneider, Eschmann, & Zuccolotto, 2002).
Single-digit arithmetic and fact retrieval use
Children’s arithmetic competence and strategy use was assessed by means of a single-digit addition and subtraction task. Stimuli were selected from the so-called standard set of single-digit arithmetic problems (Lefevre, Sadesky, & Bisanz, 1996), which excludes tie problems (e.g., 6 + 6) and problems containing 0 or 1 as operand or answer. Only one of each pair of commutative problems was selected, resulting in a set of 28 problems per operation. The position of the largest operand was counterbalanced. Children were asked to perform both accurately and quickly. Responses were verbal.
A voice key registered the child’s reaction time, after which the experimenter recorded the answer. Children could use whatever strategy they wanted to. On a trial-by-trial basis, the experimenter asked the children to verbally report the strategy they used to solve the arithmetic problem. Similar to other studies in arithmetic (e.g., Imbo & Vandierendonck, 2007a; Torbeyns, Verschaffel, & Ghesquière, 2004), strategies were classified into retrieval (i.e., if the child immediately knew the answer and there was no evidence of overt calculations), procedure (i.e., if the child indicated that he or she used counting or decomposed the problem into smaller sub-problems to arrive at the solution), or other (i.e., if the child did not know how he or she solved the problem). This classification method is a valid and reliable way of assessing children’s single-digit arithmetic strategy use (Siegler & Stern, 1998). Two practice trials were presented to familiarize children with task administration.
Standardized tests Intellectual ability
Raven’s Standard Progressive Matrices (Raven, Court, & Raven, 1992) was administered as a measure of intellectual ability. For each child, a standardized score (M = 100, SD = 15) was
calculated.
General mathematics achievement
Children’s general mathematics achievement was assessed using a curriculum-based standardized mathematics achievement test from the Flemish Student Monitoring System (Dudal, 2000). At the start of third grade the participants completed an untimed achievement test, the content of which corresponded to the mathematics curriculum until the onset of third grade. The test included various aspects of mathematics, such as number knowledge, understanding of operations, simple arithmetic, multi-digit calculation, word problem solving, measurement and geometry. For each child, a standardized score (M = 100, SD = 15) was calculated.
Reading ability
Reading ability was assessed by the standardized Dutch One-Minute-Test version B (Brus & Voeten, 1995). Children had to read a list of 116 single words of increasing difficulty as correctly and quickly as possible. This test combines speed and accuracy into one index score. The total score was
the number of words read correctly within one minute, which was converted into a standardized score (M = 10, SD = 3).
Numerical magnitude processing Numerical magnitude comparison
Children’s numerical magnitude processing skills were measured by means of symbolic and nonsymbolic numerical magnitude comparison tasks, consisting of Arabic digits and dot arrays, respectively. In these tasks children had to compare two simultaneously presented numerical magnitudes, one displayed on the left side of the computer screen, and one displayed on the right. Children had to indicate the larger of those two numerical magnitudes by pressing a key on the side of the larger one. The left response key was D; the right response key was K. They were instructed to perform both accurately and quickly. Stimuli comprised all combinations of numerosities 1 to 9, yielding 72 trials for each task. The position of the largest numerosity was counterbalanced. The nonsymbolic stimuli were generated with the MATLAB script provided by Piazza, Izard, Pinel, Le Bihan, and Dehaene (2004) and were controlled for non-numerical parameters, such as dot size, total occupied area, and density. On one half of the trials, dot size, array size, and density were positively correlated with number, and on the other half of the trials, dot size, array size, and density were negatively correlated. This was done to avoid that decisions were dependent on non-numerical cues or perceptual features. A trial started with a 200 ms fixation point in the center of the screen. After 1000 ms, stimuli appeared and remained visible until the child responded, except for the nonsymbolic numerical magnitude comparison task, where the stimuli disappeared after 840 ms, to avoid counting the number of dots. Each trial was initiated by the experimenter with a control key. Reaction times and answers were registered by the computer. To famil
i
arize children with the key assignments, three practice trials were included per task.Digit naming
In order to investigate whether efficiently identifying Arabic digits rather than processing symbolic numerical magnitudes contributes to individual differences in arithmetic fact development, an additional measure of symbolic processing was administered, i.e. digit naming. In this task, each of the numbers 1 to 9 was successively presented twice on the computer screen. The child was asked to
name each digit. Reaction time was registered by a voice key, after which the answer was entered on the keyboard by the experimenter. There were two practice trials to make the child familiar with task administration.
Working memory
Three tasks from the working memory test battery for children (Pickering & Gathercole, 2001), which have been widely used in working memory research, were administered to tap the three components of Baddeley’s working memory model. We only selected non-numerical tasks to prevent task performance to be influenced by numerical processing.
Central executive
The listening span task, adapted to Dutch (e.g., De Smedt et al., 2009 for more elaborated task details), was used to measure the central executive component. In this non-numerical task, children were asked to judge the correctness of a series of recorded sentences (true vs. false). They were also instructed to memorize the last word in every sentence, and to recall those words in the presented order at the end of each trial.
Visuo-spatial sketchpad
The corsi block recall task was used to assess the visuo-spatial sketchpad (e.g., De Smedt et al., 2009 for task details). For each trial, the experimenter tapped out a sequence, at a rate of one block per second, on a board with nine blocks. The child was instructed to reproduce the sequence in the correct order.
Phonological loop
This component was measured by a Dutch adaptation (Scheltinga, 2003) of the nonword repetition test developed by Gathercole, Willis, Baddeley, and Emslie (1994). Each recorded nonword was presented once, and the child was asked to repeat it immediately after its presentation (e.g., De Smedt et al., 2009 for more elaborated task details).
Phonological processing
We selected different tasks to measure the three traditional domains of phonological processing (Hecht et al., 2001). These tasks all have been used in research on reading and arithmetic
(e.g., Koponen et al., 2013; Swanson & Sachse-Lee, 2001; for more elaborated task details, see Boets et al., 2010).
Phonological working memory
We used the nonword repetition task described above as a measure of phonological working memory.
Phonological awareness
A phoneme deletion task and a spoonerism task were administered to assess children’s phonological awareness. The phoneme deletion task, consisted of 28 one-syllable nonwords (an adaptation of de Jong & van der Leij, 2003). Each nonword was presented twice and the child was asked to delete a particular phoneme of the nonword. For the first 10 items, the deletion of the phoneme resulted in the disclosure of an existing word (e.g., DROOS without /d/). For the next 18 items, the residual phonological string remained meaningless after phoneme deletion (e.g., WAPT without /t/). Each subtest was preceded by two practice items and each correctly produced word and nonword was rewarded with one point (maximum = 28). The spoonerism task consisted of 3 subtests of 10 items (maximum = 50). Each subtest was preceded by two practice items. For all subtests, the first 5 items resulted in the disclosure of existing words, and the remaining 5 items yielded nonwords. In the first subtest, children were required to replace the onset (single consonant or consonant cluster) of a word with another consonant in order to create a new word or nonword (e.g., LIP with /k/
becomes KIP). In the following subtests, 2 one-syllable words were given and the child was instructed to swap their consonant onset in order to reveal two new words or nonwords (e.g., Single consonant: SAAI-HOK becomes HAAI-SOK; Consonant cluster: PLANT-KRAS becomes KRANT-PLAS).
Rate of access
Rate of access to phonological information from long-term memory was evaluated with two classic rapid automatic naming tasks (van den Bos, Zijlstra, & van den Broeck, 2003), which involved the naming of colors (black, blue, red, yellow, and green) and letters (d, o, a, s and p). Each test card consisted of 50 stimuli (5 columns of 10 stimuli), with each stimulus appearing 10 times. Prior to testing, the child was required to name the stimuli in the last column of a test card in order to
determine whether the child was familiar with all the presented stimuli. The time to complete the card was recorded for each task.
Procedure
All participants completed the administered tasks individually in a quiet room at their own school, except for Raven’s matrices and the general mathematics achievement test, which were group-based. The order of task administration was fixed for all participants. At each time point (Time 1: September 2011; Time 2: September 2012; Time 3: September 2013) the single-digit arithmetic task, the digit naming task and the numerical magnitude comparison tasks were administered. Standardized tests as well as tests measuring the working memory components and the different domains of
phonological processing were only collected at the start of third grade (Time 1: September 2011). Results
The first section of the results covers the cluster analysis and the descriptive statistics of each cluster. It is important to point out that, although we administered a single-digit addition and
subtraction task separately, performance on these tasks was strongly correlated (all rs > .63). In order to improve clarity, the cluster analysis was applied on data averaged across operations. The subsequent sections discuss cluster differences in numerical magnitude processing, working memory and
phonological processing. Cluster analysis
Children’s performance on the single-digit addition and subtraction tasks was evaluated in terms of fact retrieval frequency, mean reaction times and variance of the reaction times. Trials with incorrect responses or with incorrect voice-key registrations (< 4% of all trials) were not included. For calculating the reaction time and reaction time variance variables, trials deviating more than 3SDs from the average participant’s reaction time as well as trials with a reaction time below 500ms (< 0.6% of all trials) were additionally excluded.
Children’s arithmetic fact development was estimated by considering parameters of arithmetic fact mastery (i.e., fact retrieval frequency, mean reaction times and variance of the reaction times) at the start of three subsequent school years (i.e., third, fourth and fifth grade). We applied a model-based cluster analysis (Banfield & Raftery, 1993) on these parameters assessed at three time points by using
the MCLUST package of Fraley and Raftery (2007) that is implemented in R. Model-based clustering assumes that the distribution of the data is a mixture of, in this case, multivariate normal distributions. Each of the latter distributions defines a cluster. The clustering procedure estimates the means and the variance-covariance matrices of the clusters as well as their prior probabilities (i.e., the a priori probability that any person belongs to a particular cluster). Based on these parameters the posterior probabilities can be calculated, which reflect the probability that a specific person belongs to a particular cluster. By applying Bayes’ rule to the posterior probabilities, each person is assigned to a single cluster. Model–based clustering is often preferred above heuristic clustering methods as K-means clustering and hierarchical cluster analysis, because it provides a principled statistical approach (Banfield & Raftery, 1993).
To decide how many clusters were needed to adequately describe the data, we used the Bayesian Information Criterion (BIC), which weighs model fit and model complexity. An inspection of the BIC-values of the solutions with 1 up to 9 clusters revealed that a solution with three clusters had the lowest BIC value (i.e., -8685.537), and hence should be retained. The selected model is of the VVI type, which implies that the variance-covariance matrices of the multivariate normal distributions that underlie the three clusters are all diagonal, but that the diagonal elements (i.e., the variances of the nine variables) and the ratio’s thereof are allowed to differ across the three clusters. Table 1 displays for each identified cluster the corresponding developmental profile of arithmetic fact mastery. Based on these different profiles of arithmetic fact development, the clusters were labeled as slow and variable (n = 8), average (n = 24) and efficient (n = 20).
A 3 × 3 repeated measures analysis on the frequency of fact retrieval with grade (grade 3 vs. grade 4 vs. grade 5) as within-subject factor and cluster (slow and variable vs. average vs. efficient) as between-subjects factor revealed a significant main effect of cluster, F(2, 49) = 3.29, p = .046,
η²p = .12. Post-hoc t-tests demonstrated that only the slow and variable and the efficient cluster
differed significantly from each other (p = .01; other ps > .09). There was no main effect of grade, F(2, 49) = 1.59, p = .209, and no Grade × Cluster interaction, F(4, 49) = 0.60, p = .666.
Table 1. Profiles of arithmetic fact development per cluster.
Slow and variable Average Efficient
Fact retrieval frequency
Grade 3 23.38 (10.00) 27.75 (10.96) 31.35 (10.66)
Grade 4 23.38 (7.50) 25.33 (5.89) 28.50 (6.94)
Grade 5 23.63 (11.17) 30.75 (6.95) 31.10 (8.32)
Mean reaction times
Grade 3 6642.61 (1104.49) 4475.99 (1009.11) 2424.14 (567.73) Grade 4 4118.49 (1088.79) 2590.57 (534.56) 1649.28 (267.25) Grade 5 3527.24 (1608.82) 2088.89 (335.59) 1405.03 (221.28) Variance of the reaction times
Grade 3 372.52+105 (167.87+105) 101.08+105 (74.23+105) 18.69+105 (13.27+105) Grade 4 124.91+105 (88.40+105) 23.60+105 (16.90+105) 6.37+105 (4.02+105) Grade 5 71.90+105 (92.59+105) 13.44+105 (7.55+105) 4.43+105 (2.53+105)
Note. Standard deviations are presented between parentheses..
On the mean reaction times and the reaction time variances for solving single-digit arithmetic, we calculated a 3 × 3 repeated measures ANOVA with grade (grade 3 vs. grade 4 vs. grade 5) as within-subject factor and cluster (slow and variable vs. average vs. efficient) as between-subjects factor. The analysis of the reaction times revealed a main effect of grade, F(2, 49) = 154.61, p < .001,
η²p = .76, demonstrating that the three clusters improved over developmental time (all ps < .001). As
expected there was a main effect of cluster, F(2, 49) = 91.28, p < .001, η²p = .79: The slow and
variable cluster was systematically slower than the average cluster (p < .001) and the efficient cluster (p < .001). In turn the average cluster was significantly slower than the efficient cluster (p < .001). Grade interacted with cluster, F(4, 49) = 13.19, p < .001, η²p = .35: Cluster differences became smaller
over time but remained significant at the start of each grade (all ps < .001). The analysis of the reaction time variances revealed main effects of grade, F(2, 49) = 77.22, p < .001, η²p = .61, and
developmental time (all ps < .001), and the clusters differed significantly from each other (all
ps < .001). Cluster membership interacted with grade, F(4, 49) = 23.93, p < .001, η²p = .49, indicating
that the slow and variable cluster differed at the start of each school year from the average cluster (p < .001) and the efficient cluster (p < .001). The average cluster and the efficient cluster differed at the start of third grade (p < .001), but did not differ at the start of fourth and fifth grade (both ps > .12).
Table 2 presents the detailed descriptive statistics of the three clusters. This table illustrates that the clusters did not differ in terms of age, F(2, 51) = 1.39, p = .259, sex, χ²(1) = 3.06, p = .217, socioeconomic status, χ²(1) = 0.68, p = .954, and intellectual ability, F(2, 50) = 0.76, p = .472. The three clusters differed significantly in terms of their performance on the general standardized
mathematics achievement test, F(2, 51) = 13.03, p < .001, η²p = .35. Post-hoc t-tests demonstrated that
the slow and variable cluster performed significantly lower on this achievement test than the average cluster, t(30) = -3.06, p < .001, d = -1.29, and the efficient cluster, t(26) = -5.17, p < .001, d = -2.24. In turn, the average cluster performed significantly lower on this test than the efficient cluster,
t(42) = -2.79, p = .008, d = -0.86.
Table 2. Descriptive statistics of the identified clusters.
Slow and variable Average Efficient
Ageᵃ 8.13 (0.31) 8.27 (0.28) 8.33 (0.27)
Sex 2 boys, 6 girls 8 boys, 16 girls 11 boys, 9 girls Intellectual abilityᵇ 105.63 (12.25) 108.62 (11.27) 111.16 (9.912) General mathᵇ 82.89 (9.29) 97.11 (11.94) 107.15 (11.86) Reading abilityᶜ 8.00 (1.93) 10.71 (3.03) 11.65 (1.79)
Note. Standard deviations are presented between parentheses. ᵃ Mean age in years at the start of third grade. ᵇ IQ-score on
Raven’s Standard Progressive Matrices and a general mathematics achievement test. ᶜ Standardizes scores (M = 10, SD = 3).
The present group differences could be explained by the fact that the slow and variable cluster mainly included a subgroup of children with MLD. We verified this possibility by determining in each cluster the number of children that performed below the 10th percentile on the general standardized mathematics achievement test, which is a common approach to identify children with MLD (e.g.,
Dirks, Spyer, van Lieshout, & de Sonneville, 2008; Geary, Hoard, & Bailey, 2012). In our sample, only two children met this restricted criterion for MLD: One child was included in the slow and variable cluster and one in the average cluster. As a result, the current group differences cannot be explained by an overrepresentation of children with MLD in the slow and variable cluster. Significant cluster differences were also observed for reading ability, F(2, 51) = 6.28, p = .004, η²p = .20. Post-hoc
t-tests revealed that the slow and variable cluster performed significantly lower on the reading test than the average cluster, t(30) = -2.24, p = .010, d = -0.95, and the efficient cluster, t(26) = -3.95, p < .001, d = -1.71, but the average cluster and the efficient cluster did not differ, t(42) = -1.35,
p = .184. To rule out the possibility that this difference reflected an overrepresentation of children with reading difficulties in the slow and variable cluster, we verified the number of children that performed below the 10th percentile on the reading test (e.g., Dirks et al., 2008). This analysis revealed that two children in the slow and variable cluster and two children in the average cluster met this criterion. As a result, the current group differences cannot be explained by an overrepresentation of children with reading difficulties in the slow and variable cluster.
Numerical magnitude processing
Numerical magnitude comparison
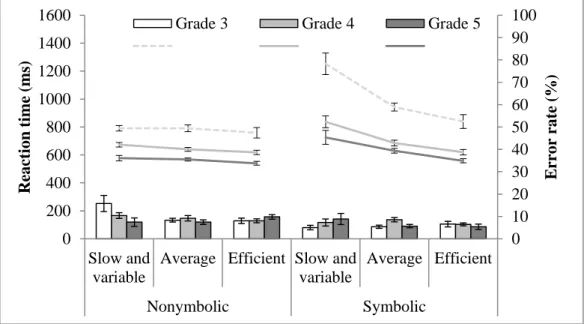
The mean reaction time and accuracy on the numerical magnitude comparison tasks are displayed in Figure 1 for each cluster per grade. We calculated a 3 × 3 repeated measures ANOVA with grade (grade 3 vs. grade 4 vs. grade 5) as within-subject factor and cluster (slow and variable vs. average vs. efficient) as between-subjects factor on the reaction time and accuracy for each
comparison task separately.
Nonsymbolic numerical magnitude comparison
With regard to reaction time, there was a main effect of grade, F(2, 96) = 84.36, p < .001,
η²p = .64: The three clusters became faster across grades (all ps < .001). There was no main effect of
cluster, F(2, 48) = 1.51, p = .232, and grade did not interact with cluster membership, F(4, 96) = 0.19, p = .945. The analysis of accuracy on the nonsymbolic numerical magnitude comparison task showed a marginally significant main effect of grade, F(2, 96) = 3.05, p = .052, η²p = .06, but not of cluster,
time (all ps < .05). Grade interacted with cluster, F(4, 96) = 3.63, p = .008, η²p = .13. Post-hoc t-tests
showed that only at the start of third grade the slow and variable cluster differed significantly from the average cluster, t(30) = -2.94, p = .006, d = -1.24, and the efficient cluster, t(26) = -2.65, p = .014, d = -1.15. Further, no significant cluster differences emerged (all ps > .12). After general mathematics achievement and reading ability, F(2, 46) = 0.58, p = .561, η²p = .03, were additionally taken into
account, cluster differences at the start of third grade no longer occurred.
Figure 1. Mean reaction time and error rate (% incorrectly solved problems) by cluster per numerical magnitude comparison task. Lines represent reaction time on the left y-axis and bars depict error rates on the right y-axis. Error bars represent 1SE of the mean.
Symbolic numerical magnitude comparison
The analysis of the symbolic reaction time revealed a main effect of grade, F(2, 96) = 161.74,
p < .001, η²p = .77, indicating that the three clusters improved over developmental time (all ps < .001).
There was a main effect of cluster, F(2, 48) = 18.57, p < .001, η²p = .44, pointing out that cluster
differences were significant at the start of each school year (all ps < .05). Grade interacted with cluster,
F(4, 96) = 5.03, p = .001, η²p = .17. Post-hoc t-tests showed that the slow and variable cluster differed
from the average cluster and the efficient cluster at the start of each school year, but that these
differences became smaller over time (all ps < .001). Differences between the average cluster and the 0 10 20 30 40 50 60 70 80 90 100 0 200 400 600 800 1000 1200 1400 1600 Slow and variable
Average Efficient Slow and variable Average Efficient Nonymbolic Symbolic E rr or rat e (% ) R eac ti on ti m e (m s)
efficient cluster remained stable over time. Cluster differences in symbolic reaction time remained when general mathematics achievement and reading ability were additionally controlled for (all ps < .05). With regard to accuracy, there were no main effects of grade, F(2, 96) = 1.78, p = .175, or cluster, F(2, 48) = 0.30, p = .744, and no Grade × Cluster interaction, F(4, 96) = 1.71, p = .154.
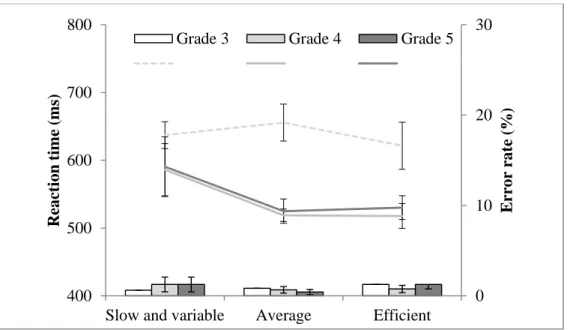
Digit naming
Figure 2 displays the mean reaction time and accuracy on the digit naming task per cluster across grades.
Figure 2. Mean reaction time and error rate (% incorrectly solved problems) per cluster on the digit naming task at the start of each grade. Lines represent reaction time on the left y-axis and bars depict error rates on the right y-axis. Error bars represent 1SE of the mean.
A 3 × 3 repeated measures ANOVA with grade (grade 3 vs. grade 4 vs. grade 5) as within-subject factor and cluster (slow and variable vs. average vs. efficient) as between-within-subjects factor was conducted on reaction time and accuracy. The analysis of the reaction time revealed a main effect of grade, F(2, 96) = 12.74, p < .001, η²p = .21. Post-hoc t-tests demonstrated that children’s reaction time
of naming digits decreased significantly from third to fourth grade (p < .001), but not from fourth to fifth grade (p = .61). There was no main effect of cluster, F(2, 48) = 1.56, p = .221, and no Grade × Cluster interaction, F(4, 96) = 0.83, p = .509. With regard to accuracy, main effects of grade, F(2,
0 10 20 30 400 500 600 700 800
Slow and variable Average Efficient
E rr or rat e (% ) R eac ti on ti m e (m s)
96) = 0.02, p = .984, or cluster, F(2, 48) = 0.51, p = .605, were not observed and grade did not interact with cluster, F(4, 96) = 0.28, p = .893.
Working memory
The descriptive statistics of the administered working memory tasks are displayed in Table 3. This table indicates that no cluster differences emerged on these tasks.
Table 3. Descriptive statistics on the administered working memory tasks.
Task
Slow and variable
Average Efficient Maximum
possible F η²p M (SD) M (SD) M (SD) Central executive Listening span 5.50 (1.51) 6.29 (1.65) 5.70 (1.30) 15 1.25 .05 Visuo-spatial sketchpad Block recall 9.00 (2.33) 10.38 (1.66) 9.90 (2.94) 27 1.07 .04 Phonological loop Nonword repetition 28.13 (8.86) 30.92 (5.40) 30.50 (5.95) 48 0.62 .03 Note. All ps > .300 Phonological processing
Table 4 presents the descriptive statistics on the administered phonological processing tasks. Significant cluster differences emerged on the phoneme deletion task and the color naming task. With regard to the phoneme deletion task, post-hoc t-tests revealed that the slow and variable cluster performed significantly lower on this task than the average cluster, t(30) = -3.24, p = .003, d = -1.37, and the efficient cluster, t(26) = -2.94, p = .007, d = -1.28, who in turn did not differ, t(42) = 0.11,
p = .911.Post-hoc t-tests concerning the color naming task indicated that the slow and variable cluster
performed significantly slower on the color naming task than the average cluster, t(29) = 2.91, p = .007, d = 1.23, and the efficient cluster, t(26) = 3.18, p = .004, d = 1.38. No differences were observed between the average and efficient cluster, t(41) = 0.20, p = .839.
Cluster differences on the phoneme deletion task, F(2, 51) = 1.98, p = .152, and the color naming task, F(2, 50) = 2.27, p = .123, disappeared when reading ability was additionally controlled for.
Table 4. Descriptive statistics on the administered phonological processing tasks.
Task Slow and
variable
Average Efficient Maximum
possible
F η²p
M (SD) M (SD) M (SD)
Phonological working memory
Nonword repetition 28.13 (8.86) 30.92 (5.40) 30.50 (5.95) 48 0.62 .03 Phonological awareness Phoneme deletion 12.00 (5.24) 19.92 (6.19) 19.70 (6.59) 28 5.35ᵃ .18 Spoonerism 29.00 (6.11) 33.19 (11.01) 34.59 (11.22) 50 0.70 .03 Rate of access Color naming (s) 61.88 (11.54) 48.61 (10.99) 47.95 (10.05) 5.44ᵇ .19 Letter naming (s) 38.50 (8.73) 35.88 (9.61) 32.20 (7.34) 1.81 .07 Note. ᵃ p = .008; ᵇ p = .007. Discussion
The current longitudinal study tried to identify profiles of individual differences in children’s arithmetic fact development in a random sample. To probe this question, we applied a model-based clustering approach on parameters of arithmetic fact mastery (i.e., fact retrieval frequency, mean reaction times and variance of the reaction times) assessed at the start of three subsequent school years (i.e., third, fourth and fifth grade). The cluster-analysis revealed three clusters or profiles of arithmetic fact development, which were labeled as slow and variable
(cluster 1), average (cluster 2) and efficient (cluster 3). These profiles did not differ in terms of age, sex, socioeconomic status and intellectual ability. We additionally explored whether these profiles differed in terms of cognitive skills that have been associated with individual differences in single-digit arithmetic. The three profiles differed in nonsymbolic and symbolic numerical magnitude
processing as well as phonological processing, but not in digit naming or working memory. Profiles of arithmetic fact development
We used a model-based clustering approach (Banfield & Raftery, 1993) to delineate profiles of arithmetic fact development, based upon empirically derived differences in parameters of arithmetic fact mastery repeatedly assessed over time. This bottom-up approach represents an alternative to the top-down approach because the categorization of children into subgroups is no longer based upon predetermined cut-off criteria. The cluster analysis revealed three profiles – slow and variable, average or efficient – that were marked by differences in children’s development in arithmetic fact mastery from third to fifth grade. Our results support prior studies, which signaled large individual differences in the use of arithmetic solution strategies (e.g., Barrouillet et al., 2008; Dowker, 2005; Imbo & Vandierendonck, 2007a). At all three time points, children with a slow and variable profile relied less frequently on arithmetic fact retrieval than efficient children. With progressing time, all participants improved in terms of speed as well as speed variability when solving single-digit arithmetic. Although these improvements narrowed the initial learning gap, children with a slow and variable profile solved arithmetic problems always slower and with larger reaction time variances than the average or efficient children. Importantly, the poor arithmetic fact mastery of children with a slow and variable profile appeared highly tenacious, which is in agreement with previous work by Jordan and colleagues (2003). Our data further showed that average children solved additions and
subtractions systematically slower than efficient children, though differences in reaction time variances disappeared over the years.
It is interesting to note that the three profiles also differed in terms of general mathematics achievement. Children with a slow and variable profile performed lower on a general mathematics achievement test than the average and efficient children. In turn, average children performed lower on this achievement test than efficient children. Importantly, the slow and variable profile did not reflect an overrepresentation of children with MLD.
Numerical magnitude processing
The current study revealed that children with a slow and variable profile were less accurate on the nonsymbolic numerical magnitude comparison task than average and efficient children. These
differences were observed at the start of third grade but were no longer apparent at the start of fourth and fifth grade. Two recently conducted meta-analyses reported that the association between
nonsymbolic numerical magnitude processing and mathematics achievement is significant but
moderate in both cross-sectional and longitudinal data (Chen & Li, 2014; Fazio et al., 2014). Chen and Li (2014) further added that nonsymbolic numerical magnitude processing skills contribute less to children’s mathematics achievement than math anxiety or socioeconomic status. It is therefore not surprising that, in our data set, differences between profiles in nonsymbolic numerical magnitude processing were no longer observed after children’s general mathematics achievement were additionally controlled for.
Another important finding was that the three profiles differed in terms of children’s symbolic numerical magnitude processing skills. This finding matches with the results of Vanbinst and
colleagues (2012) who demonstrated that third-graders who were more proficient in processing symbolic numerical magnitudes retrieved more arithmetic facts from their memory and executed fact retrieval faster and more accurately. Further, the current data appear consistent with previous research that showed robust correlations between symbolic numerical magnitude processing and children’s mathematics achievement (e.g., Bugden & Ansari, 2011; De Smedt et al., 2009; Sasanguie et al., 2012b; also see De Smedt et al., 2013; for a narrative review). Our data go beyond the previous ones by showing that the differences between profiles in symbolic numerical magnitude processing were present not only at the start of third grade, but also in the subsequent years. These differences were not attributable to differences in age, sex, socioeconomic status, intellectual ability, general mathematics achievement or reading ability.
In order to investigate whether efficiently identifying Arabic digits rather than processing symbolic numerical magnitudes contributes to individual differences in arithmetic fact development, an additional measure of symbolic processing was administered, i.e. digit naming. We did not observe differences in digit naming between profiles, which suggest that merely identifying Arabic digits without explicitly processing their magnitude is not sufficient to explain individual differences in arithmetic fact development. In conclusion, our results indicate that symbolic, and to a lesser extent nonsymbolic, numerical magnitude processing skills might support children’s development in
arithmetic fact mastery. Working memory
We did not observe significant differences between profiles on the components of Baddeley’s working memory model. These results differ from previous work, which highlighted that working memory resources have a crucial impact on children’s growth in single-digit arithmetic (e.g., Andersson & Lyxell, 2007; Bull, Espy, & Wiebe, 2008; Krajewski & Schneider, 2009; Mazzocco & Kover, 2007), but they are consistent with other published studies (e.g., St Clair-Thompson & Gathercole, 2006; Andersson, 2008; Rasmussen & Bisanz, 2005).
It is possible that our focus on a restricted developmental period, i.e. third to fifth grade, might account for the absence of significant differences between profiles with respect to working memory, because single-digit arithmetic may not place a heavy load on working memory in this age group. More specifically, it has been argued that the role of working memory varies across arithmetic strategies. Working memory resources may be particularly important when children start to learn arithmetic and mainly rely on effortful procedural strategies to arrive at the solution (Geary et al., 2004; Imbo & Vandierendonck, 2007b). Through the course of primary school, problem-answer associations become stronger, more efficient arithmetic fact retrieval arises and thus working memory load decreases. Consequently, a diminished reliance on working memory during arithmetical problem solving might be observed in older children (De Smedt et al., 2009; Geary, Hoard, & Nugent, 2012), such as the sample of third- to fifth-graders in our study. This view is supported by the meta-analysis of Friso-van den Bos and colleagues (2013) who reported that the association between working memory and arithmetic is moderated by age. Further work is, however, required to determine how working memory relates to individual differences in the early developmental stages of learning single-digit arithmetic or how working memory is related to more complex multi-single-digit arithmetic.
Phonological processing
Average and efficient children outperformed children with a slow and variable profile on a phoneme deletion task and a rapid color naming task. Average and efficient children did not differ in phonological processing. This matches with previous research findings, which have reported that poorer phonological processing skills coincide with poorer arithmetic fact mastery (e.g., De Smedt et
al., 2010; Swanson & Sachse-Lee, 2001; Vukovic & Lesaux, 2013).
It is, however, important to emphasize that children with a slow and variable profile
performed significantly lower on a reading test than average and efficient children, who in turn did not differ. Follow-up analyses revealed that the observed differences between profiles in phonological processing no longer emerged after reading ability was additionally controlled for. This is not unexpected given that numerous studies have found strong associations between phonological processing and reading (e.g., Boets et al., 2010; Snowling, 2001) as well as between reading and arithmetic (e.g., Fuchs et al., 2005; Fuchs et al., 2006; Hecht et al., 2001; Jordan et al., 2003). It also accords with data from neuroimaging studies, which suggest a neural overlap between these skills in the left temporo-parietal cortex, such as the left angular and supramarginal gyri (e.g., Dehaene et al., 2003; Schlaggar & McCandliss, 2007). Moreover, strong genetic correlations between reading and arithmetic have been consistently reported (Kovas et al., 2007; Mascheretti et al., 2014). It is important to clarify that the children with a slow and variable profile of arithmetic fact development did not reflect a subgroup of children with reading difficulties.
Limitations and directions for future research
When evaluating the current findings, it is important to note that they were based on a rather small sample size, which is due to the fact that we only included those participants we could follow over the entire period of three years. It would therefore be important to replicate this study with a larger sample size. In addition, the current conclusions apply to the specific developmental period under investigation, i.e. children’s development in arithmetic fact mastery from third to fifth grade. It would be interesting for future research to distinguish profiles of children’s arithmetic fact
development over the entire primary school. This research should preferably start before children receive formal mathematics instruction as it can be expected that subject-variability is particularly striking in the early stages of learning single-digit arithmetic.
Further work is also required to establish whether specific cognitive skills, different from those incorporated in our study, might contribute to variability in children’s acquisition of arithmetic facts. Future investigations could, for example, explore how deficient inhibition skills might be related to difficulties in learning arithmetic facts (e.g., Geary, 2004). Inhibition skills have been linked to
mathematics achievement (e.g., Blair & Razza, 2007; St Clair-Thompson & Gathercole, 2006; Szucs, Devine, Soltesz, Nobes, & Gabriel, 2013) and it has also been suggested that inhibition of incorrect answers from long-term memory might be particularly important for successful arithmetic fact development (e.g., Verguts & Fias, 2005; Jackson & Coney, 2007). Another factor that might explain individual differences in arithmetic fact mastery is hypersensitivity-to-interference in memory (De Visscher & Noël, 2014). More specifically, when children memorize associations, such as arithmetic problems and their answers, this storage process might be hindered through interference of similar problem-answer associations. Recent developmental data by De Visscher and Noël (2014) indeed indicate that children with higher sensitivity to interference have difficulties in storing arithmetic facts.
Finally, non-cognitive correlates, such as math anxiety, should also be considered in future research, as there is evidence to suggest that the impact of math anxiety on children’s general mathematics achievement is more pronounced in children who rely heavily on procedural strategies rather than direct memory retrieval (e.g., Ashcraft & Krause, 2007).
Conclusion
The present longitudinal study investigated children’s arithmetic fact development by applying, for the first time, a model-based clustering approach on parameters of arithmetic fact mastery, i.e., fact retrieval frequency, mean reaction times and variance of the reaction times. These parameters were assessed at the start of three subsequent school years, i.e., third, fourth and fifth grade. The cluster analysis revealed three profiles – slow and variable, average and efficient ‒ that were marked by differences in children’s development in arithmetic fact mastery from third to fifth grade. These profiles did not differ in terms of age, sex, socioeconomic status and intellectual ability. The three profiles differed in nonsymbolic and symbolic numerical magnitude processing as well as phonological processing, but not in digit naming or working memory. After cluster differences in general mathematics achievement and reading ability were additionally controlled for, only differences in symbolic numerical magnitude processing remained significant. The current data highlight that the model-based clustering approach can be successfully applied to answer questions in the field of mathematical cognition. In particular, our longitudinal data reveal that especially symbolic numerical magnitude processing represents an important variable that contributes to subject variability in
children’s acquisition of arithmetic facts.
References
Andersson, U. (2008). Working memory as a predictor of written arithmetic skills in children: The importance of executive functions. British Journal of Educational Psychology, 78, 181–203. Andersson, U., & Lyxell, B. (2007). Working memory deficit in children with mathematical problems:
A general or specific deficit? Journal of Experimental Child Psychology, 96, 197–228. Ashcraft, M.H., & Krause, J.A. (2007). Working memory, math performance and math anxiety.
Psychonomic Bulletin & Review, 14, 243-248.
Baddeley, A.D. (1986). Working memory. New York: Clarendon.
Bailey, D.H., Littlefield, A., & Geary, D.C. (2012). The co-development of skill at and preference for use of retrieval-based processes for solving addition problems: Individual and sex differences from first to sixth grades. Journal of Experimental Child Psychology, 113, 78-92.
Banfield, J.D., & Raftery, A.E. (1993). Model-based Gaussian and non-Gaussian clustering. Biometrics, 49, 803–821.
Bartelet, D., Ansari, D., Vaessen, A., & Blomert, L. (2014). Cognitive subtypes of mathematics learning difficulties in primary education. Research in Developmental Disabilities, 35, 657-670.
Barrouillet, P., & Lépine, R. (2005). Working memory and children’s use of retrieval to solve addition problems. Journal of Experimental Child Psychology, 91, 183-204.
Barrouillet, P., Mignon, M., & Thevenot, C. (2008). Strategies in subtraction problem solving in children. Journal of Experimental Child Psychology, 99, 233-251.
Boets, B., De Smedt, B., Cleuren, L., Vandewalle, E., Wouters, J., & Ghesquière, P. (2010). Towards a further characterization of phonological and literacy problems in Dutch-speaking children with dyslexia. British Journal of Developmental Psychology, 28, 5-31.
Blair, C., & Razza R.P. (2007). Relating effortful control, executive function, and false belief understanding to emerging math and literacy ability in kindergarten. Child Development, 78, 647-663.
Booth, J.L., & Siegler, R.S. (2008). Numerical magnitude representations influence arithmetic learning. Child Development, 79, 1016-1031.
Brus, B. T., & Voeten, B. J. (1995). Eén minuut test vorm A en B. Verantwoording en handleiding. Nijmegen: Berkhout.
Bull, R., Espy, K.A., & Wiebe, S.A. (2008). Short-term memory, working memory, and executive functioning in preschoolers: Longitudinal predictors of mathematical achievement at age 7 years. Developmental Neuropsychology, 33, 205–228.
Bull, R., Johnston, R.S., & Roy, J.A. (1999). Exploring the roles of the visual‐spatial sketch pad and central executive in children's arithmetical skills: Views from cognition and developmental neuropsychology. Developmental Neuropsychology, 15, 421-442.
Bull, R., & Johnston, R.S. (1997). Children’s arithmetical difficulties: Contributions from processing speed, item identification, and short-term memory. Journal of Experimental Child Psychology, 65, 1–24.
Bugden, S., & Ansari, D. (2011). Individual differences in children’s mathematical competence are related to the intentional but not automatic processing of Arabic numerals. Cognition, 118, 35– 47.
Butterworth, B., Zorzi, M., Girelli, L., Jonckheere, A.R. (2001). Storage and retrieval of addition facts: The role of number comparison. The quarterly journal of experimental psychology, 54, 1005– 1029.
Chen, Q. & Li, J. (2014). Association between individual differences in non-symbolic number acuity and math performance: A meta-analysis. Acta Psychologica, 148, 163–172.
Dehaene, S., Piazza, M., Pinel, P., & Cohen, L. (2003). Three parietal circuits for number processing. Cognitive Neuropsychology, 20, 487-506.
de Jong, P. F., & van der Leij, A. (2003). Developmental changes in the manifestation of a
phonological deficit in dyslexic children learning to read a regular orthography. Journal of Educational Psychology, 95, 22-40. doi: 10.1037/0022-0663.95.1.22
De Smedt, B., Noël, M., Gilmore, C., & Ansari, D. (2013). The relationship between symbolic and non-symbolic numerical magnitude processing and the typical and atypical development of mathematics: evidence from brain and behavior. Trends in Neuroscience and Education, 2, 48-55.
De Smedt, B., Verschaffel, L., & Ghesquière, P. (2009). The predictive value of numerical magnitude comparison for individual differences in mathematics achievement. Journal of Experimental Child Psychology, 103, 469–479.
De Smedt, B., Taylor, J., Archibald, L., & Ansari, D. (2010). How is phonological processing related to individual differences in children’s arithmetic skills. Developmental Science, 13, 508-520. De Visscher, A., & Noël, M.P. (2014). Arithmetic facts storage deficit: the
hypersensitivity-to-interference in memory hypothesis. Developmental Science, 17, 434–442.
Dirks, E., Spyer, G., van Lieshout, E.C.D.M., & de Sonneville, L. (2008). Prevalence of combined reading and arithmetic disabilities. Journal of Learning Disabilities, 41, 460-473.
Dowker, A. (2005). Individual differences in arithmetic. Implications for psychology, neuroscience and education. Hove, UK: Psychology Press.
Dudal, P. (2000). Leerlingvolgsysteem: Wiskunde—Toetsen 1–2-3 Basisboek [Student monitoring system: Mathematics—Tests 1–2-3 manual]. Leuven, Belgium: Garant.
Fazio, L.K., Bailey, D.H., Thompson, C.A., & Siegler, R.S. (2014). Relations of different types of numerical magnitude representations to each other and to mathematics achievement. Journal of Experimental Child Psychology, 123, 53-72.
Friso-van den Bos, I., van der Ven, S.H.G., Kroesbergen, E.H., & van Luit, J.E.H. (2013). Working memory and mathematics in primary school children: A meta-analysis. Educational Research Review, 10, 29-44.
Fuchs, L. S., Compton, D. L., Fuchs, D., Paulsen, K., Bryant, J. D., & Hamlett, C. L. (2005). The prevention, identification, and cognitive determinants of math difficulty. Journal of Educational Psychology, 97, 493–513.
Fuchs, L.S., Fuchs, D., Compton, D.L., Powell, S.R., Seethaler, P.M., Capizzi, A.M., Schatschneider, C., & Fletcher, J.M. (2006). The cognitive correlates of third-grade skill in arithmetic,
algorithmic computation, and arithmetic word problems. Journal of Educational Psychology, 98, 29-43.
Fraley, C., & Raftery, A.E. (2007). Model-based Methods of Classification: Using the mclust Software in Chemometrics. Journal of Statistical Software, 18, 1 paper i06.
Gathercole, S.E., Willis, C.S., Baddeley, A.D., & Emslie, H. (1994). The children’s test of nonword repetition: A test of phonological working memory. Memory, 2, 103-127.
Geary, D.C. (2004). Mathematics and learning disabilities. Journal of Learning Disabilities, 37, 4-15. Geary, D.C. (2013). Early foundations for mathematics learning and their relations to learning
disabilities. Current Directions in Psychological Science, 22, 23-27.
Geary, D.C., Hoard, M.K., & Bailey, D.H. (2012). Fact retrieval deficits in low achieving children and children with mathematical learning disability. Journal of Learning Disabilities, 45, 291-307. Geary, D.C., Hoard, M.K., Byrd-Craven, J., & DeSoto, M.C. (2004). Strategy choices in simple and
complex addition: Contributions to working memory and counting knowledge for children with mathematical disability. Journal of Experimental Child Psychology, 88, 121-151. Geary, D.C., Hoard, M.K., Byrd-Craven, J., Nugent, L., & Numtee, C. (2007). Cognitive mechanisms
unerlying achievement deficits in children with mathematical learning disability. Child development, 78, 1343-1359.
Geary, D.C., Hoard, M.K., & Nugent, L. (2012). Independent contributions of the central executive, intelligence, and in-class attentive behavior to developmental change in the strategies used to solve addition problems. Journal of Experimental Child Psychology, 113, 49-65.
Hecht, S.A., Torgesen, J.K., Wagner, R.K., & Rashotte, C.A. (2001). The relations between phonological processing abilities and emerging individual differences in mathematical computation skills: A longitudinal study from second to fifth grades. Journal of Experimental Child Psychology, 79, 192-227.
Hitch, G., & McAuley, E. (1991). Working memory in children with specific arithmetical learning difficulties. British Journal of Psychology, 82, 375-386.
Imbo, I., & Vandierendonck, A. (2007a). The role of phonological and executive working memory resources in simple arithmetic strategies. European Journal of Cognitive Psychology, 19, 910-933.
Imbo, I., & Vandierendonck, A. (2007b). The development of strategy use in elementary school children: Working memory and individual differences. Journal of Experimental Child Psychology, 96, 284–309.
Jackson, N., & Coney, J. (2007). Simple arithmetic processing: Individual differences in automaticity. European Journal of Cognitive Psychology, 19, 141-160.
Jordan, N.C., Hanich, L.B., & Kaplan, D. (2003). Arithmetic fact mastery in young children: A longitudinal investigation. Journal of Experimental Child Psychology, 85, 103-119.
Kilpatrick, J., Swafford, J., & Findell, B. (2001). Adding it up: Helping children learn mathematics. Washington, DC: National Academies Press.
Koponen, T., Aunola., K., Ahonen, T., & Nurmi, J. (2007). Cognitive predictors of single-digit and procedural calculation skills and their covariation with reading skill. Journal of Experimental Child Psychology, 97, 220–241.
Koponen, T., Salmi, P., Eklund, K., & Aro, T. (2013). Counting and RAN: Predictors of arithmetic calculation and reading fluency. Journal of Educational Psychology, 105, 162-175. Kovas, Y., Haworth, C.M., Harlaar, N., Petrill, S.A., Dale, P.S., & Plomin, R. (2007). Overlap and
specificity of genetic and environmenntal influences on mathematics and reading disability in 10-year-old-twins. Journal of Child Psychology and Psychiatry, 48, 914–922.
Krajewski, K., & Schneider, W. (2009). Exploring the impact of phonological awareness, visuo-spatial working memory, and pre-school quantity number competencies on mathematics achievement in elementary school: Findings from a 3-year longitudinal study. Journal of Experimental Child Psychology, 103, 516–531.
Lefevre, J., Sadesky, G. S., & Bisanz, J. (1996). Selection of procedures in mental addition:
Reassessing the problem size effect in adults. Journal of Experimental Psychology, 22, 216– 230.
Mascheretti, S., Riva, V., Giorda, R., Beri, S., Lanzoni, L.F.E., Cellino, M.R., & Marino, C. (2014). Journal of Human Genetics, 59, 189-197.
Mazzocco, M.M.M., & Kover, S.T. (2007). A longitudinal assessment of executive functioning skills and their association with math performance. Child Neuropsychology: A Journal on Normal and Abnormal Development in Childhood and Adolescence, 13, 18-45.
McKenzie, B., Bull, R., & Gray, C. (2003). The effects of phonological and visual-spatial interference on children’s arithmetical performance. Educational and Child Psychology, 20, 93-108. Piazza, M., Izard, V., Pinel, P., Le Bihan, D., & Dehaene, S. (2004). Tuning curves for approximate
numerosity in the human intraparietal sulcus. Neuron, 44, 547–555.
Pickering, S., & Gathercole, S. (2001). Working Memory Test Battery for Children (WMTB-C). London: Psychological Corporation.
Rasmussen, C., & Bisanz, J. (2005). Representation and working memory in early arithmetic. Journal of Experimental Child Psychology, 91, 137–157.
Raven, J.C., Court, J.H., & Raven, J. (1992). Standard progressive matrices. Oxford: Oxford Psychologists Press.
Reeve, R., Reynolds, F., Humberstone, J., & Butterworth, B. (2012). Stability and change in markers of core numerical competencies. Journal of Experimental Psychology: General, 141, 649-666. doi: 10.1037/a0027520
Robinson, C.S., Menchetti, B.M., & Torgesen, J.K. (2002). Toward a two-factor theory of one type of mathematics disabilities. Learning Disabilities, 17, 81–89.
Sasanguie, D., De Smedt, B., Defever, E., & Reynvoet, B. (2012a). Association between basic numerical abilities and mathematics achievement. British Journal of Developmental Psychology, 30, 344–357.
Sasanguie, D., Van den Bussche, E., & Reynvoet, B. (2012b). Predictors for mathematics
achievement? Evidence from a longitudinal study. Mind, Brain, and Education, 6, 119-128. Scheltinga, F. (2003). The Dutch Nonword Repetition Test. University of Amsterdam: Unpublished