School of Education: Faculty Publications and
Other Works
Faculty Publications
2006
Schoolwide Application of Positive Behavior
Support in an Urban High School:. Journal Of
Positive Behavior Interventions
Hank Bohanon
Loyola University Chicago, [email protected]
This Article is brought to you for free and open access by the Faculty Publications at Loyola eCommons. It has been accepted for inclusion in School of Education: Faculty Publications and Other Works by an authorized administrator of Loyola eCommons. For more information, please contact
This work is licensed under aCreative Commons Attribution-Noncommercial-No Derivative Works 3.0 License. Copyright Sage Publications
http://pbi.sagepub.com/content/8/3/131
Recommended Citation
Bohanon, H., Fenning, P., Carney, K. L., Minnis-Kim, M., Anderson-Harriss, S., Moroz, K. B., & ... Pigott, T. D. (2006). Schoolwide Application of Positive Behavior Support in an Urban High School:. Journal Of Positive Behavior Interventions, 8(3), 131-145.
Support in an Urban High School:
A Case Study
Journal of Positive Behavior Interventions
Volume 8, Number 3, Summer 2006, pages 131–145
Abstract: The nuances of the application of schoolwide positive behavior supports (PBS) in an urban high school setting were investigated. Impact of implementation was measured using qualitative interviews and observations, including the School-wide Evaluation Tool (SET), Ef-fective Behavior Support Survey, Student Climate Survey,and office disciplinary referrals. The re-sults indicated that schoolwide PBS was implemented in an urban high school setting with some success. The overall level of implementation of PBS reached 80% as measured by the SET.
Staff and teachers increased their level of perceived priority for implementing PBS in their school. A decrease in monthly discipline referrals to the office and the proportion of students who required secondary and tertiary supports was noted. These findings seem to indicate that PBS may be an important process for improving outcomes for teachers and students in urban high school settings.
Hank Bohanon
Pamela Fenning
Kelly L. Carney
Myoung Jinnie Minnis-Kim
Sarah Anderson-Harriss
Kristyn B. Moroz
Kira J. Hicks
Beverly B. Kasper
Carrie Culos
Loyola University–ChicagoWayne Sailor
University of KansasTherese D. Pigott
Loyola University–Chicago 131The application of positive behavior support (PBS) to ur-ban settings has been examined on a schoolwide basis (Turnbull et al., 2002; Warren et al., 2003) for groups (Turnbull et al., 2002) and individual students (Edmonson & Turnbull, 2002; Turnbull et al., 2002). However, there has been limited work to date that has applied PBS to set-tings that are both urban and secondary. We will focus on the features of high school settings that make implementa-tion of PBS distinct from that of elementary and middle schools.
Purpose
As stated in Warren et al. (2003), “Positive behavior sup-port includes a broad range of systematic and individual-ized strategies for achieving important social and learning
outcomes while preventing problem behavior” (p. 80). The application of this approach leads to at least three out-comes for students: (a) improved academic achievement, (b) enhanced social competence, and (c) safe learning and teaching environments (Office of Special Education Pro-grams, 2002). In sum, this approach should lead to im-proved quality of life for teachers, students, staff, and family members through the combination of (a) valued outcomes, (b) behavioral and biomedical science, (c) evidence-based procedures, and (d) systems change (Carr et al., 2002). The “system” of PBS includes implementing and assessing uni-versal interventions (e.g., supports all students), interven-tions for groups of students who need additional support (e.g., classroom levels, function-based interventions; Hawken & Horner, 2002; Leedy, Bates, & Safran, 2004), and intensive supports for individual students (Colvin, 1991; Lewis & Sugai, 1999; Walker et al., 1996).
Schoolwide PBS Framework
The framework used to conceptualize this study was the schoolwide Positive Behavior Support: Implementers’ Blue-print and Self-Assessment (OSEP, 2002) developed by the Office of Special Education Programs (OSEP) Center on PBS. This “system” provides a framework and includes at least eight unique features. The steps outlined in the blue-print are as follows: organizing your team to assess needs and guide supports; organizing your data collection system to observe before you intervene (Edmonson, 2000); ana-lyzing, describing, and prioritizing to determine areas of need and logical next steps; specifying measurable out-comes to determine what you want your building to look like in the future (McCart & Sailor, 2003); and selecting evidence-based practices. Table 1 provides a list of these schoolwide practices.
Subsequent steps of the schoolwide PBS model in-clude adopting and implementing interventions, monitor-ing both process and outcomes of the plan, and, finally, modifying the plan on an “as needed” basis. Edmonson and Turnbull (2002) said that people and settings change, and so should plans. The following section provides a dis-cussion of considerations that will affect modification of the model according to context.
URBAN CONSIDERATIONS
The Spring 2004 issue of the Journal of Positive Behavior Interventionsprovided an in-depth discussion of issues re-lated to PBS and urban settings. There appear to be at least three issues that are unique to the application of the schoolwide PBS framework to urban settings: (a) overall quality of life (Markey, Markey, Quant, Santelli, &
Turn-bull, 2002), (b) implementation factors (Netzel & Eber, 2003), and (c) behavioral outcomes (Warren et al., 2003).
As Markey, Markey, Quant, Santelli, & Turnbull (2002) described, life within urban environments can pro-vide for a very different experience. Factors that can affect the quality of life experience for individuals and families are race and poverty issues, differences in language and culture, and living in areas with limited resources and dense populations. Warren et al. (2003) said, “For students who face dangers walking through their own neighbor-hood to get to school, being ‘ready to learn’ as they walk into the classroom is not likely to be a high priority” (p. 82).
A second factor affecting the use of PBS within urban settings concerns implementation issues. As Netzel and Eber (2003) described, “Urban school districts have unique challenges due to factors such as size, high poverty rates, diverse communities, and limited resources” (p. 71). With more students, additional resources are required to coordi-nate comprehensive school reform initiatives (Warren et al., 2003) and deal with issues of building-level accountability under No Child Left Behind (2002) mandates. A final con-sideration is the hypothesis that a higher percentage of stu-dents in urban schools require secondary and tertiary supports (Turnbull et al., 2002; Warren et al., 2003).
HIGH SCHOOL CONSIDERATIONS
In this section, two factors particular to the implementa-tion of the schoolwide PBS model in high schools will be discussed: (a) at-risk behaviors of high school students and (b) unique pressures for high schools to provide improved academic outcomes. These issues have a direct impact on the need to modify schoolwide PBS specifically for high schools.
Student At-Risk Behaviors
Discipline problems may contribute to the overall envi-ronment where violence and crime may occur (National Center for Education Statistics, n.d.-b). The types of disci-plinary problems also can be related to grade levels. For example, middle schools were more likely to report racial tensions, bullying, verbal abuse of teachers, and wide-spread disorder in classrooms. High schools were more likely to report gang or extremist cult activity (National Center for Education Statistics, n.d.-b). Discipline prob-lems were positively related to school size. As the size of school populations increased, so did the likelihood that discipline problems would be reported, with the exception of widespread disorder in the classroom. Approximately 26% of schools with 1,000 students or more reported ver-bal abuse of teachers, while 14% of schools with popula-tions ranging from 500 to 999 reported verbal abuse of teachers. Because high schools tend to have larger
enroll-Table 1. Components of Schoolwide Positive Behavior Support from Colvin (1991)
Component of schoolwide support
1. Clearly stating the purpose of schoolwide discipline; 2. Clearly stating and posting schoolwide expectations;
3. Creating schoolwide structures to reinforce demonstrations of expected behaviors (behaviors that are reinforced are repeated); 4. Creating schoolwide structures to teach expected behaviors; 5. Clarifying behaviors that are managed by staff and those that
are referred to the office;
6. Providing opportunities for staff to work together to address persistent minor behaviors;
7. Offering a continuum of structures to address serious office referral behavior;
8. Building resources to assist students with chronic serious behav-ior; and
9. Developing recordkeeping procedures to readily track student behavior. (p. 2)
ments than their primary counterparts, this appears to be an important consideration.
Improved Academic Outcomes
The second issue of concern that was unique to high schools included pressures to improve academic outcomes for their youth, driven by the unique mission and outcomes of these institutions. According to a report sponsored by the Bill and Melinda Gates Foundation (2003), “Our civic, so-cial and economic future depends on our ability to dra-matically increase the percentage of students that leave high school ready for college, work, and citizenship” (p. 1). Structural concerns for high schools included the cre-ation of large, impersonal institutions that did not encour-age the full participation of all students (Bill and Melinda Gates Foundation, 2003). Other concerns included lack of efficient strategies for data management. Another measur-able outcome of success for high schools was their ability to promote their students from the 12th grade on time (within 4 years). There are more than 16,000 high schools in the United States serving over 14 million students. Ac-cording to a report by Johns Hopkins University (as cited in Office of Vocational and Adult Education, n.d.-c), for the class of 2001, only 1,000 high schools promoted 50% of their 12th-grade class on time.
Focus of Current Study
The previous sections have outlined general approaches to a schoolwide PBS program and issues relevant to high school settings. The following section outlines the imple-mentation of a 3-year evaluation study designed to address the unique characteristics of an urban high school setting as schoolwide PBS was implemented. The main focus of the study was twofold: (a) to consider the ways in which traditional schoolwide PBS models would need modifica-tion for urban high school settings, and (b) to evaluate the impact of a high school PBS model on schoolwide disci-pline outcomes.
Method
SETTING AND PARTICIPANTS
With more than 438,500 students and 602 school build-ings, the Chicago Public Schools is the third largest school district in the United States. During the first year of the study (2001–2002), the implementation high school served approximately 1,800 students. The school had a culturally diverse student body representing more than 75 countries and a racial and ethnic composition as follows: 36% Afri-can AmeriAfri-can, 36% Hispanic, 16% Asian AmeriAfri-can, 8% Caucasian, 2% Native American, and 2% other. A large majority of students met criteria for free or reduced lunch (89%). Furthermore, 21% had limited English proficiency
(LEP). At the time of initial data collection, there was an overall 86% average daily attendance, 19% dropout rate, 30% mobility rate, and 20% of the entire school popula-tion qualified for and received special educapopula-tion services.
QUANTITATIVE MEASURES
Quantitative measures were associated with two catego-ries: (a) process and (b) outcomes. The process measures included in the study were the School-wide Evaluation Tool
(SET), and the Effective Behavior Support (EBS) Survey.
Outcome data included office disciplinary referrals (ODRs) and climate survey data.
School-wide Evaluation Tool
Horner, Todd, Lewis-Palmer, Sugai, and Boland (2004) suggested that the SET is an effective tool for “(a) assessing the need for training, (b) assessing the impact of person-nel development efforts in the area of school-wide PBS, (c) assessing the sustained use of school-wide PBS proce-dures, and (d) developing locally effective strategies for building school-wide PBS outcomes” (p. 10). These re-searchers found the instrument to have high levels of reli-ability (overall alpha of .96), test–retest relireli-ability (97.3% average agreement on items), interobserver agreement (99%), construct validity (Pearson r= .75,p≤.01), and sensitivity to change (t= 7.63,df= 12,p≤.001).
The SET is an instrument to measure treatment in-tegrity of schoolwide PBS implementation efforts. In this study, the SET was conducted by a trained consultant from the Illinois State Board of Education’s Positive Behavior Interventions and Support network (ISBE-PBIS). Accom-panying the consultant was a university graduate student research team member. The SET was conducted during the month of January, 5 months after the beginning of the full implementation (Year 3). The protocol utilized by the ISBE-PBIS network was used for this study. This protocol was developed directly from the SET manual provided by the OSEP Center on PBS (available at http://www.pbis .org/tools). Baseline data were not obtained directly using the SET (Years 1–2). As previously stated, the team began as nonintrusively as possible. The research team decided not to use the SET as a baseline measure due to a potential threat the more formal interview process might have gen-erated. They were concerned that if this instrument were to be used too early in the process, it would be a punishing experience for the staff and administration.
Effective Behavior Support Survey
The EBS Surveywas designed to determine the level of im-plementation and priority for change across four domains of PBS: (a) schoolwide, (b) classroom, (c) nonclassroom (e.g., hallways), and (d) individual supports. This instru-ment can be completed by the entire staff or at a smaller planning team level. This instrument should be utilized
during initial stages of training and planning (Sugai, Hor-ner, & Todd, 2000).
The EBS Surveyitems were reviewed by the discipline leadership team at the school. They suggested modifica-tions be made to clarify the focus of each item, to create a more “urban setting” and “high school setting” friendly in-strument. Another recommendation from this group was to add a third response column—“I Don’t Know”—under the heading “current status of the item.” Previously, the available response columns were “In Place,” “Partially in Place,” and “Not in Place.” The column was added because it was felt that the other columns were not appropriate re-sponses for individuals who were unaware if a certain area even existed in the school. Last, the team suggested that the
EBS Surveybe given to “key personnel” who came into di-rect contact with the students during the school day. These personnel included the security/police officers, the support staff, and the cafeteria staff.
It was also agreed that the “nonclassroom settings” be clarified and made appropriate for high school settings. For example, particular times or places in which the stu-dents were required to maintain the schoolwide expected behaviors were clearly articulated (e.g., hallways, cafeteria, playground, public transportation, parking lot, bathroom, school-sponsored events, extended-day activities, transi-tion to and from school). Furthermore, questransi-tions were added to clarify the roles and responsibilities of parents/ guardians in developing expected behaviors. After the sug-gestions were integrated into the revised EBS Survey, judg-mental validity was established through review and approval from Dr. George Sugai (co-director of the OSEP Center on PBS) and Dr. Lucille Eber (executive director of the Illinois Positive Behavior Support Network).
Administration of the EBS Surveytook place in small groups. The researchers believed an informal setting with a small number of participants would be the best venue for asking questions, reflecting on responses, and promoting staff ownership of the EBS Survey. The surveys were ad-ministered by both research staff and administrative staff from the school. No more than 30 individuals (ranging from 10–30) completed the EBS Surveyat one time. The staff was informed that there was no way for the team to know which group they were in and that no connection would be made between their identity and their responses. Prior to completing the EBS Survey,groups were first given an overview of interview data about schoolwide needs. A similar process was used with the custodial staff, support staff (e.g., security), and administrators. The administra-tion was completed in Years 2 and 3. The EBS Surveywas completed during the fall of Year 2; however, the adminis-tration of the school asked that the instrument be admin-istered in the spring of Year 3. The results were scored by the research staff and presented to school staff in the month following collection. These data were used for se-lecting priorities for action planning in Years 3 and 4.
Review of Office Disciplinary Referral Data
ODR data were entered into a computer system by the school staff. These data were exported into Microsoft Excel for graphical analysis and then imported into SPSS 11.5 for statistical analysis of significance. The Excel reporting sys-tem was designed so that anomalies in data entry would be identified (e.g., date of infraction was after a discipline hearing, inappropriate coding of referral type). These changes were made prior to any analysis.
The discipline referral process was guided by the district-wide code of conduct. Behaviors were coded into five levels of severity. Level 1 behaviors were considered minor infractions and Level 2 and above were considered major infractions. Within each level of infraction, specific codes were provided, including a specific behavioral defi-nition of the incident. The person completing the referral provided a narrative description of the behavior. Although there was no attempt at determining the reliability of the coding process, the same staff responsible for data entry were consistent across all years of the study (e.g., vice prin-cipal, discipline deans, secretary). Statistical inferences be-yond issues of total numbers of referrals were not used in this study.
The consistency of staff referrals of students during Year 1 (Phase I initial inquiry) was somewhat questionable. Not all of the data were inputted into the data system, and no effort had been made to determine the reliability of data entry for research purposes. Because this study was not funded by a research grant, the research team only had resources to track the reliability and consistency of the re-ferral data during the actual years of the study. The staff were encouraged to ensure that all data were entered into the database beginning with Year 2 of this project.
Furthermore, the research team conducted spot checks of every 10th discipline referral between the hard copy of the referral and what was entered into the com-puter during the years of the study. No disagreements were found. The primary research question for the discipline re-ferral data was, “Was there a significant difference between the proportion of students who would require more in-tense supports between years two and three of this study?”
QUALITATIVE MEASURES
Interviews, document reviews, and comprehensive field notes were utilized in this study. Procedures for sampling interviews included two types of purposeful sampling: (a) elite (Marshall & Rossman, 1989) and (b) snowball (Lincoln & Guba, 1985; Skrtic, 1985). Following proce-dures recommended by Marshall and Rossman (1989), elite participants were selected for their (a) unique knowl-edge of discipline-related development and implementa-tion processes at the high school, (b) experiences with different aspects of discipline (e.g., groups and individual
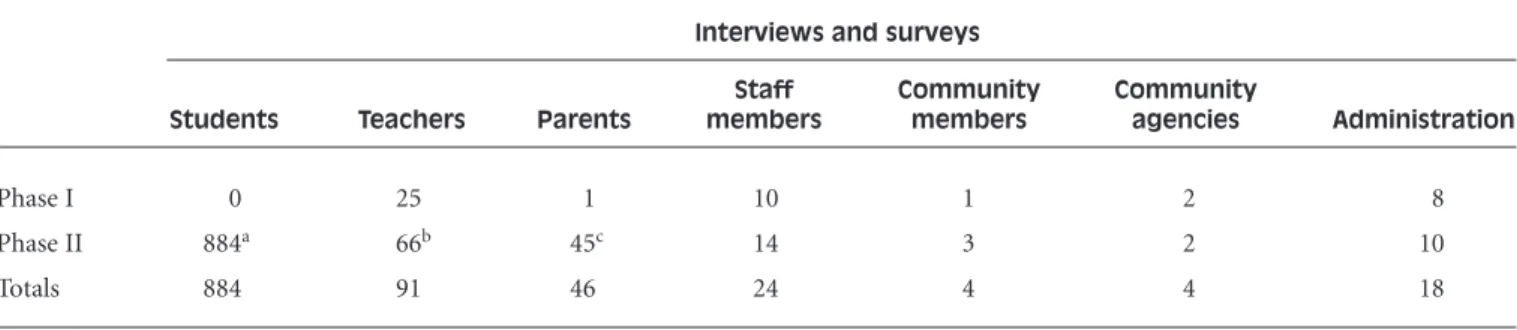
students), (c) access to relevant documents and records, and (d) ability to recommend other key participants with both similar and differing points of view. Snowball sam-pling involved asking interviewees to suggest other partic-ipants for interviewing, activities to observe, and records and documents to collect that seemed relevant to the emergent sampling process. The interviews were con-ducted by the two principal investigators and four gradu-ate students over all 3 years of this study. Table 2 provides totals for the number and types of interviews that were conducted in this study.
Because a few examples from previous research on urban experiences existed (Warren et al., 2003), it was ap-propriate to use formal questions in the interview process. However, each interview began with a “grand tour” ques-tion to allow the interview to guide the direcques-tion of the ses-sion (Lincoln & Guba, 1985). Questions included “What should we ask you about discipline in your school?” and “What is going well and what are your concerns around discipline in your school?” Initial interviews were con-ducted from August to May of Year 1.
DESIGN
When the researcher is interested in both the simultaneous development of a process and the outcomes, a more qual-itative approach may be necessary (Bogden & Biklen, 1982). Furthermore, when the researchers have prolonged engagement in the implementation and the study of the process, approaches such as participant observation and naturalistic inquiry may be useful to account for treatment effects (Bogden & Biklen, 1982; Lincoln & Guba, 1985). Through strategies such as member checking (e.g., check-ing content validity of the case study report), researchers can better account for their participation in the process and are perhaps better equipped to provide the emic per-spective of actual participants.
For these reasons, we selected a mixed method ap-proach for the design of this study. The process of the study included developing an intervention approach around
schoolwide supports in urban high schools and evaluating its efficacy. Qualitative designs included participant obser-vation and naturalistic inquiry design. These investigatory approaches were utilized to develop interventions and guide the systematic implementation of independent vari-ables. A pre–post (AB) design was utilized to compare the effects of the intervention between baseline (Year 2) and implementation (Year 3). The scope of this study included the 2001–2002 Phase I: initial inquiry (Year 1), 2002–2003 Phase II: baseline (Year 2), and 2003–2004 Phase III: inter-vention (Year 3) academic school years. Table 3 provides an approximate summary of the time spent by the major participants in this study on site, during meetings, and in training.
PHASE I OF STUDY
During the fall of the 2002 school year, a school staff mem-ber and recent graduate of the investigators’ university ap-proached them for assistance with behavior strategies. Subsequently, the principal investigators had an initial meet-ing with the school principal durmeet-ing the month of Novem-ber 2002 during which they presented a 30-min overview of the PBS process. Although application of the entire model was not approved at that time, the initial needs as-sessment strategies were supported. University staff was al-lowed to conduct interviews with school staff, students, administration, and teachers over the next 10 months.
Two components of Step 2 from the blueprint (OSEP, 2002) also were implemented (organizing your data col-lection systemand organizing your team). The researchers identified potential team members through a purposeful sampling process. The location of important quantitative data was identified (e.g., ODRs, attendance, grade point averages), along with the personnel responsible for their management. An initial report from this stage (which was shared with the entire population) began the process of creating a feedback loop for information to the staff of the school. This included three major presentations to (a) teachers, (b) support staff, and (c) administration at the end of the spring of 2002.
Table 2. Input: Approximate Types and Numbers of Interviews and Surveys
Interviews and surveys
Staff Community Community
Students Teachers Parents members members agencies Administration
Phase I 0 25 1 10 1 2 8
Phase II 884a 66b 45c 14 3 2 10
Totals 884 91 46 24 4 4 18
aIncludes data from the student climate survey.bIncludes the Effective Behavior Support Survey.cIncludes interviews based on climate surveys with parents. These data
This phase included unstructured interviews and servations. Members of the university team spent time ob-serving and interviewing in various departments throughout the school building, such as the attendance and the dis-cipline office. Additionally, they collected field notes on school climate and discipline implementation within the school. Interview themes and observations were presented to the staff using an ongoing member-checking system (Lincoln & Guba, 1985) to increase credibility and to re-ceive permission to advance to more formal assessments. The initial report of overall themes was presented to the school staff in May 2002. Development and credibility of these themes are described in the following sections.
At the end of the staff and administrative presenta-tions, additional information about PBS was provided. A brief explanation of the connection between the staff con-cerns and PBS was made in both meetings. The adminis-tration was provided with an example of how PBS could address staff, faculty, and administrator concerns in the university team’s initial report. An example was provided as to how to tie these supports to school improvement planning. Following the presentations, permission was granted to the university research team to form an initial discipline leadership committee and to conduct a more formalized assessment.
PHASE II OF STUDY
Although full implementation in the form of teaching and acknowledging behaviors was not supported at this stage, further data collection was supported. The two formalized
assessments for Phase II (Year 2) followed the National Center on PBIS recommendations for analyzing, describ-ing, prioritizing and specifying measurable outcomes. The assessments included the EBS Survey for all staff (Sugai, Horner, & Todd, 2000) and organization and review of of-fice discipline data (described in detail below). In this way, the team followed the steps outlined by the National Cen-ter on PBIS.
Referral data were stored in an existing school data-base. Teachers were required to write an office referral for a violation of the districtwide uniform code of conduct. Of the five possible categories for office referral specified in the code of conduct, two included minor infractions and three included major infractions. When a student was sent to the office with a written referral, the discipline dean’s of-fice staff manually entered the referral information into the school’s data system. Staff accessed discipline data for individual students; however, schoolwide data were not ac-cessible. To address this issue, school discipline data were exported into Excel 2000, which allowed the researchers to graph the number of referrals per day, per month, per 100 students. A graph of the total number of referrals was pro-duced by grade level, by location, and by minor and major referrals. In addition, the number of in-school suspensions and out-of-school suspensions by month was graphed. Data were available for Years 1 and 2 of the research study and were presented first to the administration and then to the entire staff during a quarterly meeting.
EBS Surveydata were collected from the staff of the high school during the spring of Year 2. Ongoing presenta-tions of these data served as a member check (Lincoln & Guba, 1985), which enhanced the credibility of the team’s
Table 3. Time Spent on Schoolwide PBS by Participants and Researchers at the High School
Variable Year 1 (2001–2002) Year 2 (2002–2003) Year 3 (2003–2004)
Hours for personnel
Personnel
Principal investigators 1,200a 1,200a 1,200a
Internal coach 120b 200b 400b
University graduate students 800c 884d 926e
State level personnel 20 20 25
Total time 2,140 2,304 2,551
Training and meeting time
Meeting type
Planning 0 22f 46f
Trainingg 0 2 14.5
Totals 0 24 60.5
Note.PBS = positive behavior support.
aTwo personnel at 15 hours per week for 10 months.bThree hours per week at 10 months.cThree graduate students.dFour graduate students.eFive graduate students. fPlanning time consisted of meetings for which the entire leadership team would have been invited and could include some training.gTraining time included meetings
understanding of areas of staff and administrative concern that would be subsequently addressed.
PHASE III OF STUDY
The summary case study data from Phases I and II were presented to all high school staff during the spring semes-ter. Presentations were made to small groups of approxi-mately 30 staff members at a time during one day in June of Year 2. The next stages of intervention included (a) se-lecting evidence-based practicesand (b) initial training and action plan development.Because providing findings from initial levels of inquiry to participants can provide a cata-lyst for change, the evaluation and feedback loop process should be considered an intervention in itself (Lincoln & Guba, 1985). The participant and naturalistic approach to this study simply accounts for these factors as an interven-tion.
In mid-February, a high school team of four students, one parent/community agency member, one administra-tor, two general education teachers, two special education teachers, and one writing laboratory representative met with university faculty and graduate students for a day of training and to develop an action plan. The high school student participants were selected because of their interest in the topic and their varied needs for behavioral support. Agenda activities for Day 1 planning included (a) overview of PBS, (b) reviewing schoolwide data (e.g., EBS, referrals), (c) developing a common discipline policy, (d) developing schoolwide expectations, (e) teaching methods for expectations, (f) developing the schoolwide acknowledgment system, and (g) reviewing initiatives that were in place.
The high school team was provided with an overview of PBS principles (e.g., reinforcement, punishment, disci-pline, shaping, setting events, purpose of behaviors), PBS as a structure (e.g., primary, secondary, tertiary), and spe-cific intervention strategies at the schoolwide and group levels of support. Following the overview, each of the agenda topics was addressed by an “action team” that would work as a small group and report back to the larger group at the end of the meeting. A university facilitator provided an overview of the tasks for each group and sam-ples from other schools (e.g., sample student acknowledg-ment systems). Planning forms were taken from the first three columns of the school’s improvement plan (activity, timeline, persons responsible, and status) but were guided by the action steps outlined at the end of the EBS Survey.
Several students from the school presented data to the group, served as reporters for their small groups, and pro-vided “reality checks” for the development of the four schoolwide expectations (Be Respectful, Be Responsible, Be Academically Engaged, and Be Caring). At the end of the day, small “action groups” were formed to continue the
efforts of the day. The goal was to complete the action planning for each step (e.g., identifying schoolwide expec-tations) within the month and to report back to the school membership.
Additional products of the meeting included (a) pro-posed acknowledgment system (caught student “Doing the Right Thing” tickets, bimonthly schoolwide drawings, and two major celebrations), (b) a sample syllabus for teachers that incorporated the expectations, (c) initial draft of major and minor discipline policies, (d) a mission and vi-sion statement for the team, and (e) sample questions for the staff for the whole school overview. During this meet-ing, it was decided to run a small trial during the summer school session to test the teaching and acknowledgment system the team developed (described below). Results from this meeting were subsequently shared with the en-tire staff of the school.
Following the day of training, the school team pro-vided an overview in May to the entire teaching and career service staff (e.g., security, office staff), using the same small-group format over the course of a day. The overview included (a) a brief description of PBS, (b) a summary of the EBS Survey, (c) the draft expectations and teaching grid, (d) the draft acknowledgment system, (e) an example for syllabi and orientation activities, and (f) the opportu-nity for evaluation and feedback. The last item provided the staff with the opportunity to accept, reject, or modify the proposed plan. Based on the evaluations from the meeting, the consensus was to proceed.
For the next step,adopt and implement, the team uti-lized a summer trial activity with students enrolled in summer school to work out the logistics of the teaching and acknowledgment system. The 100 summer school stu-dents were trying to obtain credits and/or repeating courses they had failed. At the end of the summer, the teachers who provided support for the schoolwide system implementa-tion in the fall of 2003 were interviewed by the research staff. During the schoolwide overview sessions, they re-ported on “Here is how I used the teaching system” and “Here is how it worked out for me.”
IMPLEMENTATION OF SCHOOLWIDE INTERVENTIONS (YEAR 3)
During the initial kickoff session during August, the newly formed PBS team, called the “discipline leadership team” by school personnel, provided an overview of the PBS process. Over the course of 1 hr, the staff were provided with (a) a brief introduction to the PBS model, (b) a brief rationale for why this approach addressed building con-cerns, (c) an explanation of what was to be implemented at their school, (d) a discussion of how implementation would occur, and (e) a process for providing feedback to
the discipline leadership team. The overview was con-ducted in small groups of about 30 staff members, with one member of the leadership team presenting the con-tent. The teachers from the summer trial were available in each session. Because of the limited prior PBS research in secondary settings, the research team saw this as a neces-sary process at the high school level.
Teachers were given a number of permanent prod-ucts, which included sample copies of social skills lesson plans, a poster of schoolwide expectations (e.g., Be Caring, Be Academically Engaged, Be Respectful, Be Responsible), and sample course syllabi. During this month, posters that listed the expectations were also placed throughout the building. This was done to increase the exposure of students to the schoolwide expectations and to create a positive school climate. Beginning in September and continuing throughout the year, the discipline leadership team met monthly to discuss the next steps and evaluate data.
Four kickoff sessions were provided, one for each grade level during September for freshmen, sophomores, and seniors, and due to scheduling problems, one in Octo-ber for the juniors. Sessions were held in the auditorium and were facilitated by two discipline leadership team mem-bers. The overview session included (a) an overview of the expectations, (b) practice of one of the expectations (being respectful during an assembly), (c) watching a video of be-ing responsible in the cafeteria, and (d) practice of another expectation (being responsible in the hallway). All exam-ples included rationales for the expectations and the op-portunity to practice or see both negative and positive examples of the specified behavior.
At the end of the assembly, all students left the audi-torium and walked into the hallway. Students who dem-onstrated this respectful walking were provided with a ticket from the staff and were verbally praised by saying “thank you for being respectful in the hallway.” The total assembly took approximately 25 min and was repeated for each grade level.
STAFF DEVELOPMENT ACTIVITIES AND COMMUNICATION
During October of Year 3, a one-page summary of teach-ing and acknowledgteach-ing behaviors was developed for the teachers and a schoolwide acknowledgment system was developed. Each staff member was provided with several sheets of acknowledgment tickets (dubbed “cool tickets” by the discipline leadership team). The tickets were distrib-uted by the vice principal and volunteers (e.g., parents, stu-dents). Additional tickets were always available by request and were automatically distributed each quarter. Approxi-mately 7,200 tickets were given to staff in Year 2 of this study. Each ticket, valued at $0.25, could be redeemed in
the school’s food cantina. The total cost to the school for the operation of the school store in Year 1 was $142.40.
Once a week, beginning in October, a member of the discipline leadership team was available in the lunchroom to redeem students’ tickets for small items, such as candy. The redeemed tickets were used for weekly drawings dur-ing morndur-ing schoolwide announcements. Five to seven names were drawn each week, and students were thanked for “Doing the Right Thing” at the school. The students se-lected in the drawing made a selection from a collection of donated items such as books, bags, computer software, or T-shirts. These drawings continued throughout the 2003– 2004 academic school year. In February a ticket redemption store opened where students were able to purchase food items with tickets. Tickets redeemed in the ticket store were added to the weekly drawings.
SCHOOLWIDE CELEBRATIONS
Two major schoolwide celebrations were organized by the discipline leadership team: a schoolwide dance held mid-year (December) and the schoolwide delivery of movie theater tickets (June). The schoolwide celebrations were contingent on reductions in ODRs (described below). The schoolwide dance was held to acknowledge students for the schoolwide reduction in disciplinary referrals and in-creased instructional time. The entry criteria included two cool tickets or $2. Students were required to have their ID badges with them, which was evidence that they had not committed an infraction that resulted in the removal of their identification. A total of 1,098 tickets were redeemed for admittance to the dance, and $29 was collected from those without tickets. Approximately 564 students at-tended the dance, representing 38% of the average daily enrollment.
The second schoolwide celebration was intended to reduce discipline issues during April, which was histori-cally a difficult month, based on a review of previous dis-cipline data. The disdis-cipline leadership team set a 1-month goal of 15% reduction in office referrals from the previous April. This goal was attained, resulting in all students and staff receiving one free movie ticket, which was donated by a local movie theater. The theater provided a total of 1,800 tickets, a $15,300 donation.
The next steps,ongoing monitoringand ongoing mod-ifications,were addressed throughout the school year. The presentation of ODR data followed the format outlined on the School-Wide Information System (SWIS) Web site (http://www.swis.org). Referral data were reviewed by the discipline leadership team and presented quarterly to the entire staff during a schoolwide meeting.
Monthly reports that summarized the quantitative and qualitative data were submitted in person to the school principal and director of school improvement. These
re-ports were also given during schoolwide quarterly meet-ings in December, February, April, and June. The format for these meetings typically included (a) presentation of quantitative data (e.g., ODRs, climate survey results), (b) presentations of qualitative data (e.g., interviews with staff and students, including concerns or strengths of the process), (c) next steps in the action plan from the disci-pline leadership team, and (d) the opportunity to provide written and verbal feedback. This feedback was coded and organized by the principal investigators and was included in monthly reports to the administration and the biweekly meetings of the discipline leadership team.
Results
INITIAL DATA COLLECTING AND PLANNING
The results from the initial Phase I formal, semistructured interviews were collected. These results included interview and field notes, as described in Table 2. These results were coded and “chunked” into superordinate and subordinate categories. The “chunks” of information were placed on 3 × 5-inch index cards and sorted into categories. The credibility of these data (analogous to reliability in quanti-tative research) was supported through triangulation and ongoing member checking (Lincoln & Guba, 1985). Each superordinate and subordinate category required at least
three pieces of information to support its inclusion. Cate-gories and themes that did not meet these criteria were considered interesting but were not included in the initial report. The research team initially reviewed the case re-port, followed by a presentation to administrative staff of the school team (i.e., member checking).
The purpose of the member check was to support or reject the case report for (a) how well it represented the setting, (b) errors in interpretation, (c) omissions of fact, (d) erroneous interpretations, (e) confidentiality and ano-nymity, and (f) material that was not necessary for the re-port (Lincoln & Guba, 1985). Following the member check sessions, three major categories were supported by the re-search and school-based teams. These superordinate themes included (a) the need for clear and consistent expectations for students, (b) the need for improved response time from the discipline office, and (c) the desire to focus on positive behaviors rather than constantly correcting inappropriate behaviors.
DEGREE OF SCHOOLWIDE PBS IMPLEMENTATION
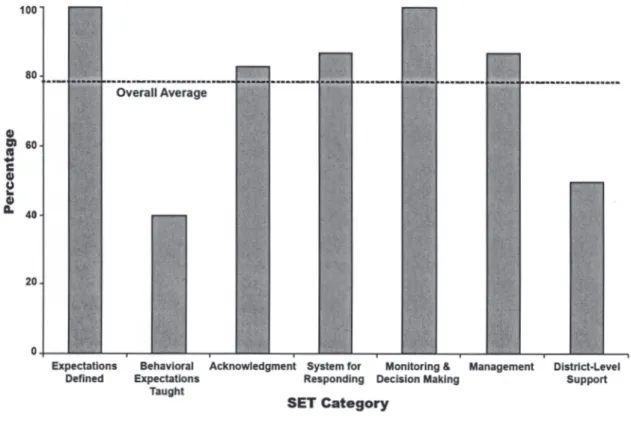
Figure 1 provides a summary of the SET data by category and by total. A review of these data indicates that imple-mentation during Year 3 of the study reached an overall level of 80% implementation across five domains (expec-tations are defined, expec(expec-tations are acknowledged, system
Figure 1. Overall results from the School-wide Evaluation Toolfrom the 2003–2004 school year.
for responding to behavior, making data-based decisions, and management). Two scores fell under the 80% level of implementation: “behavioral expectations are taught” and “district-level support.” There is a possibility that some components of schoolwide PBS were present prior to im-plementation years; however, our initial interviews (e.g., need for expectations) suggest that only a limited number of these factors were in place.
STAFF PERCEPTIONS OF SCHOOLWIDE PBS IMPLEMENTATION AND FUTURE PRIORITIES
The EBS Surveywas used as a measure of staff perception pertaining to current schoolwide supports in place and priorities and needs for the future. This tool provided a measure of the perceived levels and priorities around the process of implementing PBS. This instrument should be interpreted as a measure of the staff ’s perception of school-wide PBS at a particular moment in time.
There was concern that the teachers would not re-spond if they were asked to identify themselves in any way. Since identification information was not collected, it was impossible to conduct a paired-samples t test of signifi-cance. Therefore, the Wilcoxon-Mann-Whitney test for in-dependent samples was conducted (Siegel & Castellan, 1988). The H0 stated that perceptions of the current status and priority for change are equal in both populations where PBS interventions at the schoolwide level were not present and compared to when they were present. The H1 stated that perceptions of the current status and priority for change are statistically different in samples where PBS interventions at the schoolwide level were not present and when they were present. Since this study focused on the primary level of intervention, a test for significance was conducted solely for the schoolwide portion of the survey. Item 8 from the schoolwide portion was removed due to low levels of reliability (extraction from Principal Com-ponents Analysis = .376; Dedes, 2004). This item stated that “procedures are in place to address emergency/ dangerous situations.” As indicated by Green, Salkind, and Akey (2000), missing data were addressed by determining a minimum number of items that a participant should ad-dress, taking an average of the scores that are present and multiplying this average by the number of items to deter-mine a total score. Adjusted n(missing data removed) for the 2002–2003 school year was 71 (1 missing), and the ad-justed nfor the 2003–2004 school year was 82 (6 missing data points). The asymptotic test for significance for com-parison of the schoolwide items was smaller than alpha = .05 for both current status (U= 3,247,T= 8,918,p= .018) and priority for change (U= 892.5,T= 3,238.5,p= .000). Therefore, our decision was to reject the H0 in favor of H1 on the schoolwide portion of the EBS Survey. We con-cluded that the population with PBS present at the school-wide level (Year 3) differed in their perceptions of the
current status of PBS and their priority for change from those without PBS present (Year 2).
Following the Year 2 implementation, the levels of
perceived current statusbetween years appeared to increase for schoolwide and classwide implementation and de-creased for nonclassroom and individual supports. Across all four domains, the priority for improvement increased. Increases in current status for schoolwide and classroom, although minimal, seem to follow the upward overall trend between SET data for Year 3 of this study. Upon visual in-spection, two items in particular on the schoolwide por-tion of the survey showed the greatest level of increase between Years 2 and 3. These included a 50% increase (from 1.8 to 2.7) for the statement “a small number (e.g. 3–5) of positively & clearly stated student expectations or rules are defined” and a 33% increase (from 1.8 to 2.4) for “problem behaviors (failure to meet expected student be-haviors) are defined.” The perception of rules being de-fined from the EBS Survey(perceived) did not appear to match the decrease in the SET score on “expectations de-fined” for Year 3 (actual).
DISCIPLINE REFERRAL DATA
The ODR data from Years 2 and 3 are provided in Figure 2 as an indicator of positive behavioral and academic out-comes for students. These data were adjusted for the aver-age daily enrollment for Years 2 (1,492) and 3 (1,543). The total number of referrals for Year 2 was 5,215 (1.93 per day, per 100 students, per average daily enrollment) and 4,339 for Year 3 (1.54 per day, per 100 students, per average daily enrollment). This represents a 20% reduction in average daily referrals to the office during intervention Year 3. One of the major reductions in referrals to the office was for the behavior of dress code violations between Years 2 and 3 (26.63 per every 100 students during Year 2 vs. 8.39 per every 100 students in Year 3). Other differences included reduction in certain behaviors that were more severe in na-ture. For example, serious disobedience of authority went from 1.64 per every 100 students in Year 2 to 0.05 per every 100 students in Year 3. Reductions in ODRs were noticed across 7 of the 10 months between Years 2 and 3. The goal for the second schoolwide celebration was the reduction of the ODR data by 15% during April. The actual reduction was approximately 28%. The greatest level of reduction in referrals to the office was during September, representing a change of−66%.
There was a change in the proportion of students with problem behaviors between Years 2 and 3 of the study. Forty-six percent of the students in Year 2 had 0 to 1 ODRs, compared to 59% in Year 3. Thirty-two percent of the stu-dents in Year 2 and 25% of the stustu-dents in Year 3 had 2 to 5 referrals to the office. Finally, 21% of the students in Year 2 and 16% of the students in Year 3 had 6 or more ODRs. A cross-tabulation statistic was conducted to determine if
the change in proportions was greater than what would be expected by chance alone. Significance was reported in the form of Pearson’s chi square. The two-tailed Pearson’s chi square,χ2(3,N= 150) = 53.199,p= .000, indicated these
changes in proportion were more than would be expected by chance alone.
Discussion
Discussion of the outcomes of the study must be tempered with the understanding that, according to the SET 80/80 rule stated by Horner et al. (2004), this project has not reached full schoolwide implementation status. According to these authors, full power of the model is reached when the overall score on the SET is 80% and the teaching do-main is at 80%. It would appear that partial teaching of expectations, when combined with consistent acknowledg-ment, may have some treatment effect.
The next steps of the project will need to concentrate on assisting the staff in directly teaching the expectations to all students in the building. Another area of concentra-tion will be increased support from the district level for implementation. Even so, we are very encouraged with the initial findings. We believe that we have some initial data to suggest that schoolwide implementation of PBS in high school settings may be very beneficial to students and school personnel in terms of reduction in ODRs (and hence in-creased instructional time). Furthermore, our experience with implementation suggests that there are issues that are unique to urban high schools that must be attended to in the design and implementation of schoolwide behavioral
supports. It is also encouraging that the level of priority for implementing PBS increased as measured by the EBS.
We will focus on the following as primary challenges that we found unique to high schools: (1) the schoolwide acknowledgment system, (2) teaching behaviors in a high school setting, (3) logistics of implementation, (4) enact-ing consistent policies that address behavior, (5) modifyenact-ing ODR forms to track data.
MODIFICATIONS TO ACKNOWLEDGMENT SYSTEM
In our initial discussion with colleagues in the field, many seemed to question whether the acknowledgment system used in elementary and middle schools would be success-ful with high school students. Although there were some comments about the “babyish” nature of the “cool tickets,” by and large the data indicate that the teachers were will-ing to use acknowledgment of behaviors of students (83% for the SET on acknowledging behavior). Further qualita-tive evidence is noted by the number of tickets used by stu-dents to gain admittance to a major schoolwide activity (e.g., the schoolwide dance). Interestingly, teachers were seen in the hallway acknowledging students prior to the dance.
CHALLENGES OF TEACHING BEHAVIORS IN HIGH SCHOOLS
What appeared to be the more difficult component was encouraging the staff to directly teach what was expected. Behaviors may not have been consistently taught or
Figure 2. Disciplinary office referrals for Years 2 and 3: Per day, month, 100 students, and aver-age daily enrollment.
prompted but were reinforced if the student exhibited them. This approach would benefit students who had ex-pected behaviors in their repertoire, but not those with a skill deficit. A system must be in place in which teaching occurs on a regular basis and is integrated into the cur-riculum through the activities of precorrection and prompting. Part of the explanation may lie in the proce-dures for preparing preservice teachers.
At our university, secondary preservice professionals major in a content area (e.g., math, history) and minor in education. It would appear that under some circum-stances, secondary teachers spend more time focusing on their content area than on pedagogy. It could be argued that asking teachers to focus on behavioral expectations of students is a harder “sell” to high school teachers for this reason. We believe a key to the success we have experienced has been to understand the unique pressures these teachers experience as a result of their daily experience and to try to address these issues. Understanding the training, priorities, and needs of high school teachers is critical to successfully implementing schoolwide positive behavior support activ-ities and the challenges that are unique to high school set-tings.
It is our hunch that, as Edmonson (2000) articulated, developing an understanding of the needs and pressures of the setting prior to intervention appears to assist in buy-in to the process by tying into their priorities. For instance, as one staff member articulated during Year 2, “The main problem is lack of consistency in dealing with behavior problems.” Another frustrated teacher stated during Year 2 that this process “is a joke.” The schoolwide PBS approach provided a process for addressing these concerns. Compo-nents of schoolwide supports are designed to increase con-sistency in clarity of expectations and discipline policy. A logical connection could be made between the concerns on the part of some of the staff and the treatment provided. The staff had ongoing input into the priorities to address and the implementation of the schoolwide PBS compo-nents.
LOGISTICS OF IMPLEMENTATION IN LARGE HIGH SCHOOL SETTINGS
Another concern was dealing with logistics of the inter-vention process and required resources to implement the intervention. Notes taken from faculty meetings indicated that initial concerns for their school included (a) develop-ing a routine and identifydevelop-ing personnel for operatdevelop-ing the “school store,” (b) obtaining prizes and items for drawings and the store (e.g., pens, paper, school uniforms), (c) main-taining efficiency of the ticket delivery system for teachers, and (d) facilitating communication. Each of these con-cerns was addressed by the discipline leadership team through ongoing adjustments and communication with
the entire staff. Although these issues are likely to be com-mon challenges experienced in elementary and middle school settings, the sheer size of high schools (National Center for Educational Statistics, n.d.-a) coupled with a school culture of independent activity of faculty organized by content area may make this process unique to high schools. This may particularly be the case in urban schools (Warren et al., 2003), which are often the target of large-school reform efforts that are implemented without prior planning and with lack of input from staff and teachers.
A perfect stepwise assumption should not be made regarding the succession of interventions. Two subcompo-nents of the model—consistent policy for behaviors and consistent discipline referral that included possible func-tions of behavior—took at least 1 year to implement. We would suggest that due to the complexity and sheer size of high schools, initial implementation may take longer and require more energy and effort during the initial data-gathering efforts and development of partnerships (Na-tional Governors Association, 2003).
CHALLENGES OF ENACTING CONSISTENT POLICIES IN HIGH SCHOOLS
A challenging area that we began to address was the need for consistent policies for handling behaviors. Again, be-cause of the sheer numbers of staff and students that are within a high school, developing and agreeing on a consis-tent policy for a range of issues have required sustained ef-fort. Although the team appeared to appreciate the need for consistency in determining procedures for handling classroom-based disruptions (this was one of their original concerns from the Phase I inquiry and a behavior that re-sults in a large number of ODRs), the subsequent discus-sion was intensive and unresolved. This discusdiscus-sion was raised at subsequent meetings, but with the same level of disagreement. During the spring of Year 3, both qualitative reports and referral data appeared to indicate that there were more students walking in the hall during passing period, yet it was quite difficult to enact a policy that achieved consensus of the staff.
The outcome for achieving consensus in enacting consistent discipline policy was supported by initial obser-vations of hallway behavior (a large source of discipline referrals). Direct observations of hallway behavior con-ducted by university graduate students did verify that stu-dents were walking in the hallway after passing period in considerable numbers. The hallway observation data were presented to the entire staff and the discipline leadership team.
Using these data, the leadership team developed a consistent definition for “hall walking” and several consis-tent interventions that would address this concern on a schoolwide basis. The staff ’s review of these data may have
provided motivation for the change in policy. However, considerable time elapsed from the time of initial concern to the development of a policy for all to follow.
CHALLENGES IN REVISING ODRS
Another challenge during the implementation of PBS ac-tivities at our site was the modification of the ODR form to meaningfully assess and track behaviors. The additional components included increasing the ease for teachers to provide data about the location and time of referrals. Also, considerations for teachers about the possible motivation of behavior (e.g., student gained attention) were included. It was not until the fall of 2004 that the referral was re-viewed again and sent off for printing (elapsed time of 1 year). The staff was not able to implement the new format until they had physically run out of the original form.
FUTURE STUDY OF PBS IN HIGH SCHOOLS
We have learned a great deal from our implementation ef-forts over the last 3 years. Our preliminary results are very encouraging. However, there are many unanswered ques-tions for future research. We suggest that two major areas for future work in the area of high school PBS implemen-tation are (1) planning and implemenimplemen-tation efforts around group and individual supports in secondary schools and (2) longer-term evaluations focused on the sustainability of PBS efforts in high schools.
This study is one of the first of its kind to implement and evaluate schoolwide PBS efforts at an urban high school. Certainly, more work needs to be done to assess the impact of such PBS efforts at the high school level. Our study provides some initial information. However, there are very limited data available about the planning and im-plementation of group and individual levels of support in the high school. As Warren et al. (2003) have suggested, the number of students that require group and individual sup-ports in urban high schools may be higher than the typical triangle model found in suburban elementary and middle schools, which may alter the manner in which these sup-ports are provided. Future work will need to substantiate this supposition, as well as consider the most viable means of introducing and implementing group and individual supports in high schools. We are beginning this work in our current school but need additional time before the results of our planning and implementation efforts are known.
A second significant question is the degree to which PBS efforts can be sustained in high schools over time and whether internal capacity can be built for continued main-tenance. We do not have enough examples of high school implementation across years to know the answer to this question. Certainly, longer-term evaluations of high school PBS activities at all three levels need to be done.
Finally, it required 2 years before the team was ready to implement the full components of schoolwide PBS. This means that external consultants and the internal team members experience a high latency period between plan-ning and reinforcement. Consultants and team members alike should find every opportunity to celebrate even the slightest of successes. The process requires a long time, but the outcomes are worth the wait.
CONCLUSION
One of the best examples that we have come up with is the analogy of a ship. The larger the ship, the farther in ad-vance you have to plan for turns. Implementers should re-member that the technology behind PBS works for all people, adults and students alike. We should not abandon the principles of functions of behavior and successive ap-proximations to the goal just because someone is over age 18. We should model the principles as much as possible to build on strengths and circumvent barriers.
ABOUT THE AUTHORS
Hank Bohanon, PhD, is currently the program adviser for the special education program at Loyola University in Chicago. His research includes PBS and universal learning design in urban and suburban settings. His current research focus includes supports for secondary school settings and state-level evaluation of practice.Pamela Fenning, PhD, is a certified school psychologist and licensed clinical psychologist in Illinois. She has experience in pre-K through high school settings. She is currently on the faculty at Loyola University– Chicago and directs the school psychology program. Her re-search interests are alternatives to traditional consequences in discipline policies, the implementation of PBS in high schools, and consultation in the design of classroom-based in-terventions. Kelly L. Carney, MEd, is currently a doctoral student in educational psychology and an adjunct faculty member at Loyola University–Chicago. Her primary research interests involve exploring academic supports within the con-text of PBS.Myoung Jinnie Minnis-Kim, MEd, is a doctor-ate candiddoctor-ate in curriculum, instruction, and educational psychology and is also pursuing a Learning Behavior Special-ist certification in special education at Loyola University– Chicago. She is currently employed as a data consultant for the Illinois State Board of Education Positive Behavioral In-terventions and Supports Network and as a research assistant for Loyola University–Chicago Positive Behavioral Supports team.Sarah Anderson-Harriss, MEd, is a graduate of Loy-ola University–Chicago with a master’s degree in special ed-ucation. She is currently employed in the Chicago Public Schools as a special education teacher. Her work and research focus on supporting the success of students. Kristyn B. Moroz, EdS, is a doctoral student in the school psychology program at Loyola University–Chicago and is currently em-ployed with Heartland Area Education Agency 11. Her
cur-rent interests include positive behavioral interventions and supports, problem solving, non-categorical programming, and response to intervention.Kira J. Hicks, MEd, is a doc-toral candidate in the school psychology program at Loyola University–Chicago. Her research interests include positive support programs and risk and resiliency factors in teenagers.
Beverly B. Kasper, EdD, is the associate dean of Academic Programs and an assistant professor of educational leader-ship at Loyola University–Chicago. Her current interests in-clude positive behavior interventions, the principalship, and administration of special education for educational leaders.
Carrie Culos, MEd, is a graduate of the master’s in special education program at Loyola University–Chicago. She is cur-rently a special education teacher for students with disabili-ties in the Chicago area.Wayne Sailor, PhD, is a professor in the Department of Special Education, School of Education, University of Kansas; a senior scientist with the Beach Cen-ter on Disability, Life Span Institute, University of Kansas; and a courtesy professor with the Department of Human De-velopment and Family Life, University of Kansas. He focuses on full integration of students with severe disabilities through school restructuring processes and on service integration strategies for health, social, and educational services for all children at the school site. His most recent research is in schoolwide applications of PBS and, in particular, uses of em-powerment evaluation in whole school reform. Therese D. Pigott, PhD, is an associate professor of research methodol-ogy at Loyola University–Chicago. Her research interests in-clude methods for meta-analysis and program evaluation. Address: Hank Bohanon, Loyola University–Chicago, Special Education Program, 820 N. Michigan Ave., Chicago, IL 60611.
REFERENCES
Bill & Melinda Gates Foundation. (2003).Closing the graduation gap: Toward high schools that prepare all students for college, work, and citizenship.
Retrieved October 1, 2004, from http://www.gatesfoundation.org/nr/ downloads/ed/policy.pdf
Bogdan, R. C., & Biklen, S. K. (1982).Qualitative research for education: An Introduction to theory and methods.Boston: Allyn & Bacon.
Carr, E., Dunlap, G., Horner, R. H., Koegel, R. L., Turnbull, A. P., Sailor, W., et al. (2002). Positive behavior support: Evolution of an applied science.
Journal of Positive Behavior Interventions, 4(1), 4–16.
Colvin, G. (1991).Procedures for establishing a proactive school-wide discipline plan.Eugene: University of Oregon, College of Education, Project PRE-PARE.
Dedes, C. (2004).Factor analysis of the Effective Behavior Support Survey with data from one urban high school. Unpublished master’s thesis, Loyola University–Chicago.
Edmonson, H. (2000).A study of the process of the implementation of school re-form in an urban middle school using positive behavioral support: “Not one more thing” (Doctoral dissertation, University of Kansas, 2000). Edmonson, H., & Turnbull, A. (2002). Positive behavioral supports: Creating
supportive environments at home, in schools, and in the community. In W. Cohen, L. Nadel, & M. Madnick (Eds.),Vision for the 21st century
(pp. 357–375). New York: Wiley.
Green, S. B., Salkind, N. J., & Akey, T. M. (2000).Using SPSS for windows: An-alyzing and understanding data(2nd ed.). Upper Saddle River, NJ: Prentice Hall.
Hawken, L. S., & Horner, R. H. (2002).Evaluation of a targeted group inter-vention within a school-wide system of behavior support.Eugene: University of Oregon.
Horner, R. H., Todd, A. W., Lewis-Palmer, T., Irvin, L. K., Sugai, G., & Boland, J. B. (2004). The School-wide Evaluation Tool (SET): A research instru-ment for assessing school-wide positive behavior support.Journal of Posi-tive Behavior Interventions, 6(1), 3–12.
Leedy, A., Bates, P., & Safran, S. P. (2004). Bridging the research-to-practice gap: Improving hallway behavior using positive behavior supports. Behav-ioral Disorders, 29(2), 131–139.
Lewis, T. J., & Sugai, G. (1999). Effective behavior support: A systems ap-proach to proactive school-wide management.Focus on Exceptional Chil-dren, 31(6), 1–24.
Lincoln, Y. S., & Guba, E. G. (1985).Naturalistic inquiry. Beverly Hills, CA: Sage.
Markey, U., Markey, D., Quant, B., Santelli, B., & Turnbull, A. (2002). Opera-tion positive change: PBS in an urban context.Journal of Positive Behavior Interventions, 4(4), 218–230.
Marshall, C., & Rossman, G. (1989).Designing qualitative research. Newbury Park, CA: Sage.
McCart, A., & Sailor, W. (2003). Using empowerment evaluation to establish and sustain schoolwide positive behavior support.TASH Connections, 29(1/2), 25–27.
National Center for Educational Statistics. (n.d.-a).Characteristics of the 100 largest: Public elementary and secondary school districts in the United States: 2001–02.Retrieved October 1, 2004, from http://nces.ed.gov/pubs2003/ 100_largest/index.asp
National Center for Educational Statistics. (n.d.-b). Violence and crime at school: Public school reports. In Indicators of school crime and safety, 2003
(sect. 7). Retrieved October 1, 2004, from http://nces.ed.gov/pubs2004/ crime03/7.asp?nav=2
National Governors Association. (2003).Reaching new heights: A governor’s guide to turning around low-performing schools. Retrieved October 1, 2004, from http://www.nga.org/cda/files/0803REACHING.PDF
Netzel, D. M., & Eber, L. (2003). Shifting from reactive to proactive discipline in an urban school district: A change of focus through PBIS implementa-tion.Journal of Positive Behavior Interventions, 5(2), 71–79.
No Child Left Behind Act of 2001, Pub. L. No. 107-110 (2001).
Office of Special Education Programs. (2002).Positive behavior support: Im-plementers’ blueprint and self-assessment. Retrieved February 10, 2004, from http://www.pbis.org
Office of Vocational and Adult Education. (n.d.-a).High school leadership summit issue papers.Retrieved October 1, 2004, from http://www.ed.gov/ about/offices/list/ovae/pi/hsinit/papers/index.html
Office of Vocational and Adult Education. (n.d.-b). No child left behind: Transforming America’s high schools. In High school leadership summit issue papers.Retrieved October 1, 2004, from http://www.ed.gov/about/ offices/list/ovae/pi/hsinit/papers/index.html
Office of Vocational and Adult Education. (n.d.-c).Turning around low-performing high schools: High school leadership summit issue papers. Re-trieved October 1, 2004, from http://www.ed.gov/about/offices/list/ovae/ pi/hsinit/papers/index.html
Siegel, S., & Castellan, N. J. (1988).Nonparametric statistics for the behavioral sciences.New York: McGraw-Hill.
Skrtic, T. (1985). Doing naturalistic research into educational organizations. In Y. S. Lincoln (Ed.),Organizational theory and inquiry: The paradigm rev-olution(pp. 185–220). Beverly Hills, CA: Sage.
Sugai, G., Horner, R. H., & Todd, A. W. (2000).Effective behavior support: Self-assessment survey.Eugene: University of Oregon, Positive Behavioral In-terventional and Supports Technical Assistance Center.
Turnbull, A., Edmonson, H., Griggs, P., Wickham, D., Sailor, W., Beech, S., et al. (2002). A blueprint for schoolwide positive behavior support: Full
implementation of three components.Exceptional Children, 68(3), 337– 402.
Walker, H. M., Horner, R. H., Sugai, G., Bullis, M., Sprague, J., Bricker, D., et al. (1996). Integrated approaches to preventing antisocial behavior pat-terns among school-age children and youth.Journal of Emotional and Be-havioral Disorders, 4(4), 194–209.
Warren, J., Edmonson, H., Griggs, P., Lassen, S., McCart, A., Turnbull, A., et al. (2003). Urban applications of school-wide positive behavior support: Critical issues and lessons learned.Journal of Positive Behavior Interven-tions, 5(2), 80–92.
Action Editor: Robert H. Horner
PRO-ED, Inc. • 8700 Shoal Creek Blvd. • Austin, Texas 78757-6897 • ph 800/897-3202 or 512/451-3246 • fax 800/FXPROED • All PRO-ED products are sold on a 30-day approval.
Shipping and handling: U.S. add 10%, Canada add 15%, others add 20%.
The SOS Model = the benefits of group work + solution-focused approaches + psycho-educational content. The SOS group work model meets counselors’ critical need for the efficient use of time; for students to gain skills in self acceptance, communication, inter-personal skills, conflict resolution, decision making, and self-care skills; and for schools to take positive, strengths-based approaches to students’ needs. This “how to” book provides practical, ready-to-use applications for all aspects of facilitating groups—including needs assessments, 54 session guides and lessons, and session and program evaluations.
SOS!
A Practical Guide for Leading
Solution-Focused Groups with Kids K-12
Patricia K. Tollison and Katherine O. Synatschk
#11995, softcover © 2007