Audio Scene Analysis as a Control System for Hearing Aids
Marie Roch
[email protected]
Tong Huang
[email protected]
Jing Liu
jliu [email protected]
San Diego State University
5500 Campanile Dr
San Diego, CA, 92182-7720 USA
Richard R. Hurtig
The University of Iowa, 119 SHC
Iowa City, IA, 52242 USA
[email protected]
Abstract
It is well known that simple amplification cannot help many hearing-impaired listeners. As a consequence of this, numerous signal enhancement algorithms have been pro-posed for digital hearing aids. Many of these algorithms are only effective in certain environments. The ability to quickly and correctly detect elements of the auditory scene can permit the selection/parameterization of enhancement algorithms from a library of available routines.
In this work, the authors examine the real time param-eterization of a frequency-domain compression algorithm which preserves formant ratios and thus enhances speech understanding for some individuals with severe sensorineu-ral hearing loss in the 2-3 kHz range. The optimal com-pression ratio is dependent upon qualities of the acoustical signal.
We briefly review the frequency-compression technology and describe a Gaussian mixture model classifier which can dynamically set the frequency compression ratio according to broad acoustic categories which we call cohorts. We dis-cuss the results of a prototype simulator which has been implemented on a general purpose computer.
1
Introduction
Sensorineural hearing loss, a hearing deficit due to phys-iological problems in the cochlea, is estimated to affect over 20 million individuals in the United States [9]. Hear-ing impaired individuals typically have more problems with speech understanding in situations with lower signal to noise ratio (SNR), and it is common for a hearing aid wearer to be satisfied with their device in quiet environments but
not in the presence of noise.
Audio scene analysis is the process of automatically extracting information about the environment based upon properties of an observed signal, and has numerous appli-cations in multimedia processing. The application of audio scene analysis to hearing aids permits the selection of signal enhancement algorithms (or parameterizations) which are appropriate to specific situations. Several researchers have used audio scene analysis to classify the background noise of a hearing aid wearer’s environment. Typical classes in-clude speech in traffic, clean speech, speech in babble, and so on.
Kates [8] proposed exploiting information about the au-dio scene to permit the selection of signal processing algo-rithms based upon the audio scene. Kates measured the Ma-halanobis distance between features representative of enve-lope modulation supplemented with linear fits of the spec-trum above and below the mean. More recently, Nordqvist and Leijon [14] introduced a discrete observation hidden Markov model (HMM) based classifier for hearing aids us-ing a vector quantization codebook derived from a small number of delta features from cepstral coefficients. They elected to use only the delta features which characterizes the change in the cepstrum as the delta features tend to be reasonably invariant. A second stage HMM used an ad-hoc metric in place of state distributions which merged the results of class specific HMMs, with the class decision based upon the current state in the forward decode. B¨uchler et. al [2] implemented a variety of machine learning tech-niques (k-means, histogram driven Bayes classifiers, multi-layer perceptrons, and HMMs) as well as a post processing step of voting on the class based on the lastNclassification decisions. The ergodic HMMs were shown to be the best classifier. A number of features derived from 1 s. intervals
were explored, the best of which included tonality, width, spectral center of gravity and its fluctuation, pitch variance, and measurements of offset time.
This work focuses on a novel application of audio scene analysis to hearing aids. Rather than classifying the back-ground noise, we are interested in categorizing attributes of the foreground speaker for the purpose of enhancing his or her speech. We describe and implement a control system for a frequency domain compression algorithm which maps the frequency information across a specified bandwidth into a lower range where the listener’s auditory deficit is less pro-nounced. The control system permits the dynamic assign-ment of compression ratio based upon characteristics of the speech signal.
Unlike previous work, we do not focus on constructing a system suitable for implementation on today’s hearing in-struments. As noted by Armstrong [1], Moore’s law is ap-plicable to the computational power in hearing aids and we believe that it is reasonable to target research towards future generations of hearing aids rather than current ones. The remainder of the article is organized as follows: the fre-quency compression algorithm is reviewed in section 2, and the classifier is introduced in section 3. The databases and experiments are described in section 4 and we summarize the results and future directions in section 5.
2
Frequency Compression
For some listeners with sufficient high-frequency hear-ing loss, amplification of the signal across the bandwidth where hearing deficit occurs is insufficient. Even with am-plification, these listeners are unable to perceive the formant patterns necessary to understand speech.
It is well known that normal listeners are adept at han-dling frequency compression. Normal listeners have little trouble understanding the speech of children, adult females, or adult males even though they typically cover different bandwidths.
Peterson and Barney’s [17] study of vowels suggests that it is the ratio of formants which are important for perceiving speech. This observation has led some researchers to exam-ine methods to reduce the bandwidth of a signal presented to a hearing-impaired listener. Studies by several groups have shown that most listeners can understand speech that is compressed to 70% of its original bandwidth [22].
Prior approaches to frequency modification used in hear-ing aids have not proportionally compressed across the spectrum and the change of proportionality of the formants may counteract the advantage gained by shifting unusable frequency information into a range accessible by the wearer. Parent et. al. [15] describe a frequency transposition system where higher frequencies are shifted to lower ones, but this shift does not preserve the formant ratios.
Turner and Hurtig [22] conducted a study of listeners to determine whether a frequency-domain compression al-gorithm could provide better results than simple amplifica-tion when listening to adult male and female talkers. They hypothesized that users with severe hearing loss (> 60
dB HL) across the 2 to 3 kHz range and less severe loss in the lower frequencies would be most likely to benefit. The study included 15 hearing-impaired listeners who were close matches to the hypothesis criteria (50-60 dB HL above 2 kHz) as well as a 4 normal-hearing control speakers. Their results showed that 45% of the listeners showed statisti-cally significant improvement for female speakers and 20% of the listeners had improvement for male speakers. Al-though there were no clear indicators as to how the popula-tion that could be helped by frequency compression could be identified, there was a trend for speakers who achieved higher recognition scores on unamplified speech to benefit less from the compressed speech.
The algorithm (U.S. patent 6 577 739) operates on con-secutive, non-overlapping frames of speech. Each frame is transformed to the frequency domain and a proportional mapping of frequency bins is performed. Care is taken to preserve the DC portion of the signal. An inverse Fourier transform is applied and the output signal is presented to the hearing aid wearer. The compressed frequencies may optionally be transposed as well.
3
Cohort Detection
In Turner and Hurtig’s study [22], subjects were tested at varying compression ratios to determine whether pression was useful to the listener and what level of com-prehension optimized performance. In addition to being lis-tener dependent, the optimal compression ratio is dependent upon the speech being analyzed and depends upon several variables. The physical characteristics of the speaker play a major role in this. Speakers with shorter vocal tracts will tend to have higher formants in their voiced speech and thus require greater compression than their longer vocal tract counterparts. Alternatively, one can consider spectral differ-ences in classes of articulatory productions. As an example, fricatives tend to have high-frequency energy which is be-lieved to be important for their correct recognition. We will define a cohort to be a set of related classes which might benefit from a common compression ratio setting. Each class is composed of some broadly defined acoustic quality, such as manner or place of articulation, or characteristics of a speaker group.
Consequently, the real-time identification of cohorts per-mits a dynamic setting of the compression ratio. Several factors have motivated our choice of cohort group. We hy-pothesize that from a human factors point of view, abrupt and frequent changes in compression ratio may be
distract-ing to a listener. In addition, for probabilistic classifiers, it has been shown [18] that the average log-likelihood projec-tions (the difference of log probability in a two class prob-lem) produced by multiple observations from the same class have an F-ratio whose lower bound is the F-ratio of any sin-gle observation. This implies that in general, the average log likelihood projections from the same class will be more separable. In the current context, this means that if each cohort is active for a long enough period of time and we average the log-likelihood projections, there should be a re-duction in the classification error rate.
Consequently, we have decided to select cohorts based upon source- and vocal-tract characteristics of the speaker. In particular, we are interested in vocal qualities affected by the vocal-tract length and vocal-fold thickness. For conve-nience, we will call these groups male and female, but it is important to note that classification of a high-pitched male as belonging to a female cohort and vice-versa is not inap-propriate.
The male-female separation problem is one at which hu-man listeners are reasonably adept [21, 20], and automatic systems typically perform quite well when given phrases of several seconds. Vergin et al. [23] proposed an approximate formant detector for F1 and F2 and compared the detected values to known means for each gender. Parris and Car-rey [16] detected gender by linearly combining the output of gender-dependent sub-word hidden Markov models with the output of an F0 tracker. In both cases, the systems per-formed with low error rate, but relied on segments of several seconds. By using a sliding window, it is possible to achieve frame by frame classification in real time, but windows of several seconds are inappropriate for conversational speech where turns are likely to occur on a frequent basis.
We have trained a classifier using one Gaussian mix-ture model (GMM) per cohort. GMMs are well known for their ability to model arbitrarily complex distributions with multiple modes and are effective classifiers for many tasks. GMMs consist ofNnormal distributions, or mixtures. The number of mixtures is typically chosen based upon the em-pirical performance of training and development data sets. The mixtures are scaled by a set of weights such that all of the weights sum to 1. Thus the scaled sum of theNintegrals of the Gaussians is 1, and the model represents a probability distribution. Training is accomplished using the expectation maximization (EM) algorithm, an iterative algorithm which is guaranteed to find a local optimum [13]. The EM algo-rithm requires an initial model, which we create based upon the partitions induced by vector quantization (VQ) [10]. To reduce computational cost and due to the asymptotic inde-pendence of cepstral feature vectors [12], it is assumed that the covariance matrices are diagonal. Details on the algo-rithms for both VQ and HMMs can be found in standard texts such as [6].
The feature vectors are the Mel-filtered cepstral coeffi-cients (MFCC) [6], which are the dominant feature set in the speech, speaker, and language recognition communi-ties. These are created as follows: Successive frames are formed by multiplying the input with a Hamming window which is shifted between each frame. The short time spec-trum of each window is computed with a discrete Fourier transform. The squared magnitude spectrum is filtered in the frequency domain using a set of triangular filters whose center frequencies are regularly spaced on the Mel scale. Fi-nally a discrete cosine transform is applied to the log mag-nitude squared spectrum, resulting in the energy and a set of Mel-filtered cepstral coefficients (MFCC). The MFCCs are frequently supplemented by their derivatives which are appended to the feature vector.
The lower MFCC components are indicative of the over-all slope and shape of the frame’s Mel-filtered spectrum while the higher order MFCC components represent the finer detail. It is typical to only retain lower order com-ponents as fine variations in the spectrum are typically too variable to be of significant use for most classification tasks. Feature vectors are extracted in real time from the input speech.
In the recognition phase, the plug-in maximum a-posteriori(MAP) rule is used to decide the class. As the real class distributions are unknown, the estimated ones are used (they are “plugged-in”), and it can be shown [6] that a decision rule which selects the largest likelihood will min-imize the risk for a 0-1 loss rule. For simplicity, we make the common assumption that observations are independent of one another.
4
Methodology and Experiments
Selection of databases for evaluation of the system was motivated by both suitability and availability of prerecorded corpora. The ideal corpus would consist of a large body of labeled microphone speech sampled at 16 kHz or faster from a hearing aid collected in conditions similar to that encountered by users on a daily basis. The authors are un-aware of any publicly available corpora which meet this cri-teria. Consequently, we have selected three separate cor-pora with different strengths and weaknesses.
The SPIDRE [11] corpus contains 322 speakers (157 fe-male and 165 fe-male) who participated in varying numbers of approximately 5 m. sessions of unplanned conversational speech in a variety of environments (homes, dormitories, and so on). The combination of word aligned transcrip-tions, background speech, and environmental noise make the content of this corpus an excellent match for the prob-lem domain. Unfortunately, the data was collected over the public telephone network (8 kHz sampling, 8 bit mu-law quantization), resulting in low bandwidth as well as
chan-nel effects both from transmission equipment and multiple telephone handsets. Different microphone responses from telephone handsets, particularly from carbon button versus electret microphones, is a well known source of error for speech classification tasks. With the exception of the addi-tive noise sources, these limitations represent additional and unnecessary constraints for hearing aids under most circum-stances.
In contrast, the TIMIT [5] corpus is a recording-booth quality corpus which consists of 630 speakers (192 female and 438 male) who recorded 10 short shibboleth sentences with an average duration of about 6.1 s. Transcriptions are provided at both the phoneme and word levels, permitting detailed analysis of classification results. The TIMIT tran-scriptions use 58 classes of narrow transcription phonemes. For analysis, we grouped these into vowels, diphthongs, and the overlapping classes associated with place and manner of articulation.
The final database is the NITMIT [7] corpus. NTIMIT is a version of TIMIT that has been transmitted through public telephone network and resampled at the terminating end1. The labels provided for all three corpora are known to contain some transcription and alignment errors, but can be considered to be reliable in general.
Experiments were designed to illustrate the influence of various factors on recognition performance. To provide in-sight as to the contributions of the sampling rate reduction and transmission channel effects present in the SPIDRE cor-pus, section 4.1 reports the classification error rate of in-dividual frames with TIMIT, a downsampled 8 kHz ver-sion of TIMIT as well as NTIMIT. Section 4.2 reports the error rates for the TIMIT and SPIDRE corpora using the aforementioned averaged averaged log-likelihood pro-jections which in many cases provide a better separation between the cohorts. Spurious class changes, which may prove to be a human factors issue for the wearer of a hear-ing aid, are also investigated.
For all experiments, feature vectors contained 12 Mel fil-tered cepstral coefficients plus energy and their deltas which were extracted from frames created with a 20 ms. Ham-ming window which advanced without overlap. The 8 kHz speech was filtered with 24 Mel filters spanning 200 - 3500 Hz, while the 16 kHz speech was filtered with 35 filters spanning 200 - 7500 Hz. The increased number of filters was selected in order to provide similar filter widths across the common bandwidth. The first derivatives are appended to the feature vector, resulting in a 26 dimensional feature vector.
For each corpus, 25 female and 25 male speakers were selected to serve as training data. From each of the speakers an average of 12 s. was used to construct training sets of 5
1TIMIT, NTIMIT, and SPIDRE are available through The Linguistic
Data Consortium athttp://www.ldc.upenn.edu.
m. per gender. For the SPIDRE corpus, Raj and Singh’s endpointer [18] was used to detect speech activity. In addi-tion, the speech was taken from single gender phone calls to prevent any channel cross talk from contaminating the data. No speech activity detection was used for the TIMIT corpus which has a very brief silence at the beginning and end of each utterance.
Five iterations of the k-means algorithm were sufficient to create the codebooks used to initialize the GMMs. The EM algorithm executes for 10 iterations or until conver-gence is reached. Typically, all ten iterations are executed and the system is close to convergence. During the final it-eration, the log likelihood of any given model configuration shows no more than about a 1% improvement from the pre-vious iteration. Male and female models were created for each corpus. Earlier experiments [19] showed that 128 mix-tures provided a good trade-off between computation and accuracy, and 128 mixtures are used in all experiments.
The TIMIT/NTIMIT development set consisted of the 580 (167 female and 413 male) speakers not used in train-ing. For the SPIDRE development we selected all cross-gender phone calls such that neither speaker was one of the 50 training speakers. This resulted in 87 5 m. calls between 66 female and 62 male speakers 5 m. calls. The test set was not split into development and evaluation data due to the smaller population of female speakers for the TIMIT cor-pus and the overall small number of cross gender calls in SPIDRE where one of the speakers was not in the training set.
The system has been implemented on a general purpose computer system running Windows XP, and is capable of running in real time subject to the constraints of the op-erating system scheduler. There are latency issues associ-ated with the operating system’s multimedia system, many of which will be addressed either by the use of ASIO low latency drivers or a port to a digital signal processing board.
4.1
Effects of Sampling Rate and
Tele-phone Transmission
The first set of experiments were designed to illustrate the influence of some of the factors in the SPIDRE corpus that are not applicable for hearing aids except in the case of processing telephone speech. We examined the error rate of the classifier on individual frames on the TIMIT (TIMIT16) data. These were then compared to the error rates when the speech was downsampled to 8 kHz (TIMIT8), and finally passed through the public telephone network (NTIMIT).
Classification was performed on single frames, which re-sulted in a high error rate but permitted the ability to observe the effects of different environments on different classes of phonemes. The TIMIT16 data had an error rate of .313 which rose to .361 (15% increase) on TIMIT8 and to .411
Figure 1. Wide band spectrograms of a fe-male speaker saying [ m eI k^](make). Diph-thongs showed a marked increase in error rate between the 8 and 16 kHz corpora. The two spectrograms above show that additional relevant information (the region of the F4) is lost in the upper spectrogram.
(31% increase) on the telephone speech of NTIMIT. When broken down by phoneme class, differences in error rate vary significantly. The largest TIMIT16 error rates were for plosives, affricatives, and labiodentals (which of course include some plosives).
While the error rates of all categories rose when the speech was degraded, the increase of error rate across phoneme classes was far from uniform. After downsam-pling to 8 kHz, the vowels, diphthongs, and nasals demon-strated the greatest degradation as a result of the downsam-pling. Figure 1 shows spectrograms for the diphthong[ eI ]in the word “make” for both the original and downsam-pled TIMIT. The region of the fourth formant which can be clearly detected in 16 kHz speech is completely removed once the Mel filters are applied.
When considering the telephone NTIMIT corpus, perfor-mance degradation across a wide variety of categories was also observed with nasals and diphthongs showing relative increases in error of over 40% as compared to the baseline, closely followed by alveolars, vowels, and glides. As the same handset was used for transmission for all calls, the degradation can be primarily attributed to channel effects and quantization noise during transmission across the
pub-lic telephone network and the additional bandwidth filtering between .2 and 3.5 kHz by the public telephone network. In summary, it can be seen that reducing the sample rate and transmitting across a telephone channel has a significant im-pact on the performance of the classifier.
4.2
Increasing Class Separation and
Hu-man Factors Concerns
The individual frame results from the previous section can be significantly improved by basing the MAP decision on a short moving average (MA) of the log likelihood pro-jections. As the current frame to be analyzed transitions from one class to another, the MA window will cover both classes and the assumption of a single class in the window will no longer be true, which makes the technique sensitive to speaker change. Conversational speech has a tendency towards shorter speech segments, with many turns being less than 2 s. in length. Consequently, we only consider relatively short windows.
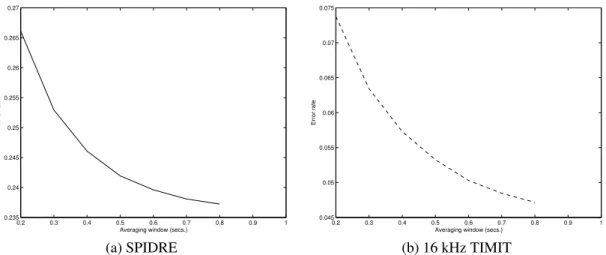
The experiments with TIMIT can be considered an op-timistic view of the classifier performance while SPIDRE may be thought of as a pessimistic one. Figure 2 shows the results as the moving average length varies. As can be seen, the error rate for both corpora decreases exponentially as the window length increases with an elbow in the .5 to .8 s. range. The TIMIT error rate has decreased to about 5% in the elbow.
The performance of SPIDRE has a significantly higher error rate of approximately 24% in the elbow region. The large differences in error can be partially explained by the differing sample rates, quantization, and telephone trans-mission discussed in the section 4.1. Other differences not explored in section 4.1 are the ambient noise, and the multi-ple speakers and microphones present in SPIDRE. The first of these are representative of the operating conditions for a hearing aid, but microphone mismatch between training and testing conditions is an avoidable problem for hearing aid applications. While we cannot reliably attribute what per-centage of the error is to due to each type, it is well known in the speaker recognition community that microphone mis-match is a significant cause of error. No attempt was made to normalize the speech from the different microphones in this study.
In addition, the classification error rate is reported with respect to biological gender rather than our definition of cohort which is based upon acoustic properties of a signal such as the range of the fundamental frequency or the poor harmonics to noise ratio characterized by breathy speech. Such characteristics are typical of, but do not always co-incide with a speaker’s gender. A precise composition of the cohorts is dependent upon the performance of hearing-impaired listeners at different compression ratios and is
be-0.2 0.3 0.4 0.5 0.6 0.7 0.8 0.9 1 0.235 0.24 0.245 0.25 0.255 0.26 0.265 0.27
Averaging window (secs.)
Error rate 0.2 0.3 0.4 0.5 0.6 0.7 0.8 0.9 1 0.045 0.05 0.055 0.06 0.065 0.07 0.075
Averaging window (secs.)
Error rate
(a) SPIDRE (b) 16 kHz TIMIT
Figure 2. Error rates for 128 mixture models on the telephone-bandwidth SPIDRE and TIMIT corpora.
yond the scope of this study which demonstrates the feasi-bility of the control system.
0 0.1 0.2 0.3 0.4 0.5 0.6 0.1 0.2 0.3 0.4 0.5 0.6 Secs. Pr(Segment Length ≤ N Secs. No filtering Median 150 ms
Figure 3. Length of identified sequences on a typical SPIDRE conversation. A portion of the cumulative distribution function indi-cating the percentage of identified segments whose lengths are ≤ N seconds. The re-sults with and without a per frame post-classification step of applying a 150 ms me-dian filter are shown.
Finally, from a human factors perspective, we must con-sider how often decisions change from one category to an-other. Excessive switching may be distracting to the user. In figure 3, we show a portion of the cumulative distribu-tion funcdistribu-tion of a reasonably typical SPIDRE conversadistribu-tion. Nearly 38% of the contiguous frames labeled as the same gender have a duration of under .25 seconds. When a short (less than .2 s.) median filter is applied, only about 17% of
the labeled frame sets are shorter than a quarter second. The disadvantage to the median filter is that it effectively moves the decision away from the optimal Bayes decision boundary. Assuming that the models are representative of the underlying distributions, this would predict an increased error rate which has been observed in our experiments. In practice, the increase in error rate is small, and varies with the length of the likelihood averaging window. Using a con-stant length median filter, increase in error rate was insignif-icant for short likelihood averaging windows and increased to about 4% as the likelihood averaging window approached a 0.8 s.
5
Summary and Conclusions
We have discussed a method to enhance speech for lis-teners with high-frequency hearing loss and to dynamically adapt the system in response to varying qualities of human speech. We have shown that it is possible to make deci-sions about how a frame of speech should be compressed using approximately 0.5 s. of previous history, making the classification decision suitable for use in conversation. Fur-thermore, we have considered human factors issues to pre-vent excessive switching between cohort classes which may negatively impact the user’s experience.
When tested on a clean speech corpus, the system achieves an error rate of less than 5%. On telephone speech, the error is approximately 24%, but a portion of the error rate is due to microphone mismatch, a situation that is un-likely to characterize the majority of most hearing aid wear-ers’ day. Future work will use an F0 detector to decide co-hort membership as opposed to physical sex.
The Gaussian mixture models used in this study are equivalent to continuous-observation ergodic hidden
Markov models and thus similar to the classifier used by B¨uchler et al. [2] although it is used with different feature set and a for different purpose. Further endeavors to im-prove the error rate are possible both with respect to the classifier and the feature set. Other classifier organizations such as structural GMMs combined with neural nets [24] and support vector machines [3] have been known to pro-vide good results in other domains. Other feature sets, par-ticularly those which are known to be associated with gen-der (e.g. one of the breathiness measures reviewed or pro-posed by Fr¨ohlich et al. [4]) are also areas for further inves-tigation.
Finally, a clinical trial should be conducted to determine the effectiveness of the system, and to guide further re-search. Although overcompression contributes the degrad-ing the naturalness of the speech, it has not been shown that overcompression results in a reduction in speech intel-ligibility. Should this prove to be true, the classifier could be biased towards deciding in favor of cohorts with higher pitches by assuming a non-uniform prior.
6
Acknowledgments
The authors would like to thank Rita Singh for making available the GMM and VQ source code used in [18] and the anonymous reviewers for their thoughtful comments.
References
[1] S. Armstrong. Integrated circuit technology in hearing aids.
J. Acoust. Soc. of Am., 116(4, Pt. 2):2536, October 2004. abstract only.
[2] M. B¨uchler, S. Allegro, S. Launer, and N. Dillier. Sound classification in hearing aids inspired by auditory scene anal-ysis. EURASIP Journal on Applied Signal Processing, in press.
[3] N. Cristianini and J. Shawe-Taylor. Support Vector Ma-chines and Other Kernel-Based Learning Methods. Cam-bridge University Press, CamCam-bridge, UK, 2000.
[4] M. Fr¨ohlich, D. Michaelis, and H. W. Strube. Acous-tic “breathiness measures” in the description of pathologic voices. InProc. Int. Conf. on Acoustics, Speech, and Signal Processing, volume 2, pages 937–940, Seattle, WA, May 1998.
[5] J. S. Garofolo, L. F. Lamel, W. M. Fisher, J. G. Fiscus, D. S. Pallett, N. L. Dahlgren, and V. Zue. Timit acoustic-phonetic continuous speech corpus. Technical Report LDC93S1, Lin-guistic Data Consortium, Philadelphia, PA, 1993.
[6] X. Huang, A. Acero, and H.-W. Hon. Spoken Language Processing. Prentice Hall PTR, Upper Saddle River, NJ, 2001.
[7] C. Jankowski, A. Kalyanswamy, S. Basson, and J. Spitz. Ntimit: A phonetically balanced, continuous speech, tele-phone bandwidth speech database. InProc. Int. Conf. on Acoustics, Speech, and Signal Processing, volume 1, pages 109–112, Albuquerque, NM, April 1990. IEEE.
[8] J. M. Kates. Classification of background noises for hearing-aid applications.J. Acoust. Soc. of Am., 97(1):461–470, Jan-uary 1995.
[9] V. D. Larson, D. W. Williams, W. G. Henderson, and L. E. Luethke. Efficacy of 3 commonly used hearing aid circuits: A crossover trial. Journal of the American Medical Associ-ation, 284(14):1806–1813, October 2000.
[10] Y. Linde, A. Buzo, and R. M. Gray. An algorithm for vector quantizer design. IEEE Trans. Commun., COM-28:84–95, January 1980.
[11] A. Martin, J. Godfrey, E. Holliman, and M. Przybocki. Spidre corpus. Technical Report LDC94S15 CD-ROM, Lin-guistic Data Consortium, Philadelphia, PA, 1994.
[12] N. Merhav and C.-H. Lee. On the asymptotic statistical be-havior of empirical cepstral coefficients.IEEE Trans. Signal Processing, 41(5):1990–1993, May 1993.
[13] T. K. Moon. The expectation-maximization algorithm.IEEE Signal Processing Mag., 13(6):47–60, November 1996. [14] P. Nordqvist and A. Leijon. An efficient robust sound
clas-sification algorithm for hearing aids.J. Acoust. Soc. of Am., 115(6):3033–3041, June 2001.
[15] T. C. Parent, R. Chmiel, and J. Jerger. Comparison of per-formance with frequency transposition hearing aids and con-ventional hearing aids. J. American Academy of Audiology, 8(5):355–365, October 1997.
[16] E. S. Parris and M. J. Carey. Language independent gender identification. InProc. Int. Conf. on Acoustics, Speech, and Signal Processing, volume 2, pages 685–688, Atlanta, GA, May 1996.
[17] G. E. Peterson and H. L. Barney. Control methods used in a study of the vowels. J. Acoust. Soc. of Am., 24(2):175–184, March 1952.
[18] B. Raj and R. Singh. Classifier-based non-linear projection for adaptive endpointing of continuous speech. Computer Speech and Language, 17(1):5–26, January 2003.
[19] M. Roch, R. R. Hurtig, J. Liu, and T. Huang. Towards a cohort-selective frequency-compression hearing aid. In
Proc. of the The Intl. Conference on Mathematics and En-gineering Techniques in Medicine and Biological Sciences, pages 164–170, Las Vegas, NV, June 2004.
[20] M. F. Schwartz. Identification of speaker sex from isolated, voiceless fricatives. J. Acoust. Soc. of Am., 43(5):1178– 1179, 1968.
[21] S. Singh and T. Murry. Multidimensional classification of normal voice qualities.J. Acoust. Soc. of Am., 64(1):81–87, July 1978.
[22] C. W. Turner and R. R. Hurtig. Proportional frequency com-pression of speech for listeners with sensorineural hearing loss.J. Acoust. Soc. of Am., 106(2):877–886, August 1999. [23] R. Vergin, A. Farhat, and D. O’Shaughnessy. Ro-bust gender-dependent acoustic-phonetic modelling in con-tinuous speech recognition based on a new automatic male/female classification. InInt. Conf. on Spoken Lan-guage Processing, pages 1081–1084, Philadelphia, PA, Oc-tober 1996.
[24] B. Xiang and T. Berger. Efficient text-independent speaker verification with structural gaussian mixture models and neural network. IEEE Trans. Speech Audio Processing, 11(5):447–456, September 2003.
![Figure 1. Wide band spectrograms of a fe- fe-male speaker saying [ m eI k^] (make). Diph-thongs showed a marked increase in error rate between the 8 and 16 kHz corpora](https://thumb-us.123doks.com/thumbv2/123dok_us/1908390.2779739/5.918.103.401.108.458/figure-spectrograms-speaker-saying-thongs-showed-increase-corpora.webp)