A. Guillalet alii, Frattura ed Integrità Strutturale, 49 (2019) 341-349; DOI: 10.3221/IGF-ESIS.49.34
341 Focused on Fracture Mechanics versus Environment
Effect of shape factor on structural reliability analysis of a surface
cracked pipeline-parametric study
Abdelkader Guillal
Université M’hamed Bougara de Boumerdès
[email protected], https://orcid.org/0000-0001-7236-4928
Noureddine Abdelbaki
Université Akli Mohaned Oulhadj de Bouira
[email protected], http://orcid.org/0000-0002-2345-6790
Mohamed El Amine Bensghier, Mourad Betayeb
Université M’hamed Bougara de Boumerdès[email protected], https://orcid.org/0000-0002-5854-775X [email protected], https://orcid.org/0000-0002-7751-2034
Bogdan Kopei
Ivano-Frankivsk National Technical University of Oil and Gas [email protected], http://orcid.org/0000-0002-5445-103X
ABSTRACT. The variation of crack shape factor (a/c) during propagation has
an important role on calculation of the stress intensity factor (SIF), where imprecise estimation of this latter can lead us to an inaccurate prediction of failure probabilities. For the case of external cracked surface pipeline carried oil and gas products, such estimation can results undesired fault decisions like excessive repairs action or inspection planning. In this paper, the structural integrity analysis of pipeline with semi elliptical crack on the external surface is evaluated. Reliability calculations expressed in term of reliability index β are carried out based on Monte Carlo simulation and First Order reliability Method (FORM). The crack shape factors are varied to cover a variety of geometries from shallow to deep cracks while fatigue crack growth is assumed in depth direction. For SIF estimation, surface and deep point are considered. Results of the analysis indicate that for a constant crack depth a/t, the reliability index is strongly affected by a/c ratio and the trend is not similar in deep and surface point for different crack shapes.
KEYWORDS. Crack, Pipeline, Reliability, Failure Index, Monte Carlo
Simulation.
Citation: Guillal, A., Abdelbaki, N., Bensghier, M.E.A., Kopei, B., Effect of shape factor on structural reliability analysis of a surface cracked pipeline-parametric study, Frattura ed Integrità Strutturale, 49 (2019) 341-349.
Received: 02.03.2019
Accepted: 05.05.2019
Published: 01.07.2019
Copyright: © 2019 This is an open access article under the terms of the CC-BY 4.0, which permits unrestricted use, distribution, and reproduction in any medium, provided the original author and source are credited.
A. Guillalet alii, Frattura ed Integrità Strutturale, 49 (2019) 341-349; DOI: 10.3221/IGF-ESIS.49.34
342
INTRODUCTION
ne of the strategic energy resources are oil and natural gaz. they have the advantage to ensure a continues and reliable energy supply with an acceptable cost. An important reason behind this success is the reliability of system transmission via pipeline from zone of production to market zone. Pipes carrying such hazardous products are subject to different type of defects. Crack growth in pipelines is an inevitable problem due to its nature. Cracks in pipeline can have different origins such as pipe manufacturing defect, welding defect or external damage. Crack growth may lead to a real concern about structural performance and failure of system production. The reliability and the fracture prediction of such piping systems are primordial given their impact on the economic plan and safety. Several researchers studied the fracture behavior of pipes containing semi elliptical surface cracks and the change of crack shape during fatigue crack growth. Zhang and Ferguson [1] developed model to predict crack shape development, under fatigue. Induced cyclic fatigue is due to service fluctuating pressure in pipeline based on API579 Stress Intensity Factor calculation and Paris law. For given initial a/c and a/t, final crack length with the crack propagation to through-wall thickness can be predicted. They found that crack shape development is strongly influenced by initial crack shape and depth ratios. The BS 9710 standard proposes an approximate integration method for fatigue life estimation.
Mahmoud [2] compared different methods used to predict crack shape development during fatigue crack growth in tension plate with experimental data. The used methods are based on analytical and empirical equations. The comparison
shows that analytical method based on local SIF (Kloc) calculated according to Newman and Raju formula [3] and the
assumption of Cc=0.9Ca (Cc and Ca are fatigue crack growth rate in surface and deep point) is the best solution over the
full range of initial crack shape values compared to experimental data with standard deviation less than 0,07. Boukharouba [4] reviewed proposed prediction model of crack shape factor evolution with depth ratio in fatigue cracking test for the following cases: tension plate, three point bending plates and tube under internal pressure. For the last case, they conclude that a/c ratio passes by maximum (growth in deep direction is more rapid comparing to surface direction) then remains steady following horizontal asymptote during crack growth. Another important conclusion is that behavior of a/c evolution is similar in thick plate under tension and thick tube under internal pressure. This finding can be supported by the work of Zhu and Tao [5] where they found that stress distribution and stress intensity factor in plate and pipe are similar for the same magnification load.
Probabilistic methods are widely used when evaluating the structural performance due to theirs advantages. Different mechanisms failure are studied using Probabilistic methods such as corroded pipelines in [6-8] in comparing to deterministic methods or assessment again target reliability using calibration safely factor, it gives many advantages. The large number of input parameter involved in structural analysis, evaluation of failure probability can be optimized using probabilistic methods. Use of worst case input parameters and very pessimistic estimations can be avoided. In probabilistic fatigue calculation many authors take into consideration crack growth in depth direction only for simplification purpose [9] or assume basic Paris crack growth in depth and surface direction where crack growth rates are equal : Ca=Cc [10]. Leander and Al-Emrani [11] published reliability fatigue assessment of steel bridge. They illustrated the
effect of initial crack aspect ratio on fatigue lifetime. They found that for a target reliability of 3.1 and Gumbel distribution of stress range, crack with initial a/c=1 had longer fatigue life then crack with initial a/c=0. However, the effect of shape factor variability on the estimation of reliability index is a point not well illustrated. The Influence of random character of initial shape ratio on crack shape development, during probabilistic analysis has to be more clarified according to proposed crack shape prediction model.
In this work, the effect of crack shape factor on reliability index calculation is considered. The aim is to show the lack of precision associated to inaccurate estimation of shape factor during crack growth. The variation of reliability index with crack shape factor is illustrated with plots at constant crack depths. This paper is structured as follow. Probabilistic model based on liner elastic fracture mechanics was established. A developed reliability method called “Importance sampling at the design point “was used to generate simples. This method is a simulation method based on crude Monte Carlo method. Then a case study of pipeline with axially external defect is applied.
PROBABILISTIC MODEL
Liner elastic fracture mechanics
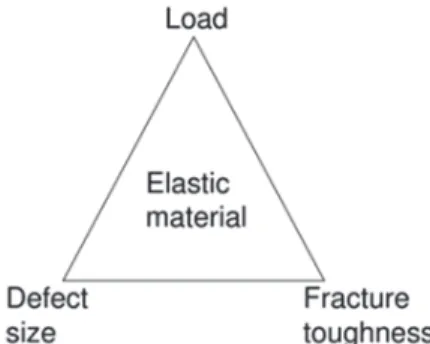
iner Elastic Fracture Mechanics (LEFM) is widely used to evaluate structural reliability of onshore pipelines. Early
model of LEFM simplify the relation modeled using triangle in Fig. 1. Therefore, three main parameters are
involved as load, defect size and fracture toughness. In real situation, the problem is more complex; where many
O
A. Guillalet alii, Frattura ed Integrità Strutturale, 49 (2019) 341-349; DOI: 10.3221/IGF-ESIS.49.34
343
parameters characterized by their uncertainties are involved and alter the three cited parameters such: fluctuating pressure, crack shape, constrain and other parameters.
Stress intensity factor (SIF) is the most common parameter used to represent driving forces that allow surface crack to propagate. The early formula of Irwin for stress intensity factor is developed by many researchers. Closed form solution for SIF where derived for many simple configurations. Newman and Raju have proposed an empirical stress intensity factor equation for SIF estimation expressed by the following formula:
( ) I t b a K S S F Q (1)
where St represent remote uniform-tension stress, Sb is the remote bending stress on outer fiber, Q is the shape factor for
elliptical crack and F is the stress-intensity boundary-correction factor.
Figure 1: Stress-intensity boundary-correction factor Uncertainties related to cracked surface in pipeline
Several uncertainties are related to fatigue life estimation of onshore pipeline. Scatter in material proprieties, loading conditions, crack initial dimensions and pipeline geometrical configuration are input parameters for failure probability estimation, in which these parameters have large influence on calculation precision [12]. In probabilistic analysis, these parameters are presented as random variables. In practice, it is difficult to obtain an applicable representation of its randomness. When data are available from laboratory test or from service inspection, statistical representation can be derived easily. In other cases, the definition of scatter can be done by gathering variability of data from previous literature considering specification of the actual study.
Uncertainties related to loading parameters
The applied load on oil and gas pipeline in case of axial surface crack is a circumferential stress due to internal pressure which is calculated via Barlow equation presented in Eqn. (1):
* 2 * b P D S t (2) where:
∆σ: applied pipeline wall stress range (MPa). D: pipeline diameter (mm).
∆P: fluctuating pressure range (MPa). t: pipeline wall thickness (mm).
The uncertainties considered for load parameters are related to variation of all parameters involved in stress estimation, typically the geometrical (D, t) parameters and service pressure (∆P).
During assessment of pipeline subjected to fatigue crack growth, both maximum operating pressure and actual operational characteristics should be considered. The first indicate the maximum cyclic stress experienced by the pipeline. The second gives information about increase and drop in operating pressure (∆P) and the frequency of cyclic stress. The direct way to quantify the cyclic pressure experienced during service time is Pressure Time History recording. The information gathered
A. Guillalet alii, Frattura ed Integrità Strutturale, 49 (2019) 341-349; DOI: 10.3221/IGF-ESIS.49.34
344
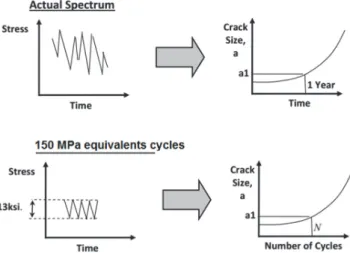
by this record is the fluctuating pressure range and number of times that take place. To make this information useful as a constant amplitude pressure change events during time period, a cycle counting method as rain flow method can applied to obtain the Pressure Range Histogram. To easily asses and compare the cyclic severity of a given pressure time history, Stress Severity Indicator (SSI) is efficient tool. SSI is the number of cycles of a given pressure range required to grow a crack the same amount as the actual pressure time history over one year. An example is illustrated in Fig. 2 where SSI of 150 MPa equivalent cycles is used.
Figure 2: Spectrum Severity Indicator. Limit state function of cracked pipeline
Reliability problem related to fatigue cracks in pipelines can be expressed using limit state function (LSF) that separate the failure region (LSF 0) (e.g. plastic collapse, fracture) and the safe region (LSF>0). The considered limit state in this work is based on LEFM where it defines the failure as fracture that the crack growing force represented by stress intensity factor Ki reaches a critical value equivalent to fracture toughness Kic, therefore the limit state function can be represented
as follow:
I
IC
LSF K K (3)
From above the considered problem is modeled as probability of failure estimation where the goal is to calculate failure probability of each crack configuration based on simulation or analytical methods such as the Monte Carlo Simulation or FORM method. The Eqn. (2) can be expressed as:
0f IC I
P LSF K K (4)
𝑃 𝐿𝑆𝐹 represents the failure probability and the results are expressed in term of reliability index. This later is related to the probability of failure according to Eqn. 4:
1
β Φ Pf
(5)
where Φ is the inverse of standardized normal distribution function.
RELIABILITY METHODS
robabilistic methods are widely used when evaluating the structural performance of pipeline due to theirs advantages[13, 14]. Comparing to deterministic method or assessment again target reliability using calibration safely factor, it gives many advantages. Due to the large number of input parameter involved in structural analysis,
P
A. Guillalet alii, Frattura ed Integrità Strutturale, 49 (2019) 341-349; DOI: 10.3221/IGF-ESIS.49.34
345
evaluation of failure probability can be optimized when using probabilistic methods. Use of worst case input parameters can be avoided so on very pessimistic estimations.
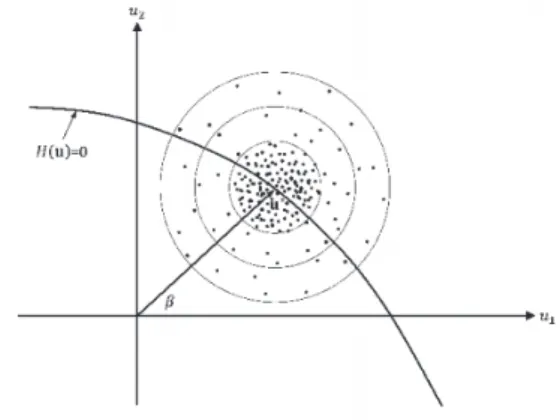
The reliability analyses were performed using Importance Sampling at the design point method. This method is based on crude Monte Carlo method, were the sampling is focused on important regions in order to save computational resources and time consuming. Regions of importance during reliability analysis can be considered as failure domain precisely region with the highest probability density among all realizations in the failure region. Fig. 3 shows the design point in the normal space witch accomplish the criterion of highest probability density. This point is situated on the limit state function and has the smallest distance to the origin of normal space [15].
The key aspect of the method is to define the design point using First Order Reliability Method “FORM”. This design point is then used to have an importance sampling density function, the new density function is used to generate samples and calculate failure probability.
Figure 3: Design point in the normal space
APPLICATION AND RESULTS
Case of study a. Material parameters
he main design parameter involved in this study is fracture toughness where the considered material is API X 80 steel. This latter is a high strength steel characterized by high strength and toughness, Guillal [16] made a review about development of high strength steel and the effect of local brittle zone on weld joints toughness. It was concluded that Carbon content reduction and a better management of alloying elements, enhance mechanical properties
in developed API 5L grade steel. Estimation of Fracture toughness is based on Charpy V notch test from [17] and the
used correlation to convert Charpy data to facture toughness presented in Eqn. (5) as fallow: 12 *
IC
K CVN (6)
b. Geometrical parameters
Fig. 2 illustrate pipeline dimension with a crack on the surface where its geometries are dimension on pipeline. The scatter in diameter and thickness of pipe is due pipe manufacturing and fabrication process. Cracks are generally characterized by NDT inspection tools. For purpose of our study, defect size is varied to cover a wide range of deep and shallow cracks. The used geometrical configuration is a pipeline with 1219.2 mm of diameter and 12.1 mm of wall-thickness. Random distribution of diameter and thickness of pipeline are presented in Tab. 1.
c. loading parameters
Larger pipe diameters and high pressure are known to be the most economical solutions in oil and gas transportation. New constructed pipelines reach a diameter of 56” and service pressure of 11-12 MPa. In our case, an API grade X80 steel is chosen to reflect used API modern steel in many projects. Maximum operating pressure and it random propriety are presented in Tab. 1.
A. Guillalet alii, Frattura ed Integrità Strutturale, 49 (2019) 341-349; DOI: 10.3221/IGF-ESIS.49.34
346
Figure 4: Geometry of pipeline avec crack on the external surface
Variables Description μ St Distribution
a Crack depth (mm) 0.2t, 0.4t, 0.6t, 0.8t Fixed
c Crack length (mm)
a/c=0.125c-0.25c-0,375-0,5-1-1,5-2 Fixed
D Outside diameter (mm) 1219,2 0,0121 Normal
t Pipe thickness (mm) 12,1 0,605 Normal
P Maximum operating pressure (MPa) 8 0,08 Normal
KIc Fracture toughness (MPa.m1/2) 137 13,7 Normal
Table 1: Random variables and their statistical proprieties Results and discussions
a- Parametric study
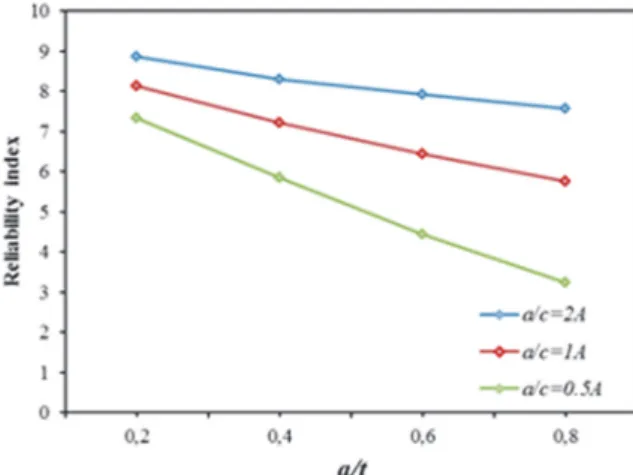
Reliability index is calculated using different configuration of crack shape and depth ratio. The used Reliability method is Importance sampling at the design point method described in section 3. Results of this study are presented in form of variation of reliability index. Fig. 5 illustrates the variation of reliability index with different crack to depth ratio for three cases: deep crack (a/c=2), semicircular crack (a/c=1) and shallow crack (a/c=0.5).
The calculations are made in deep point. The first observation is that reliability index decrease with increasing crack depth ratio. It seems that for all depth ratios shallow crack has reliability index lower then semicircular and deep crack. The difference is greater as depth ratio is increased.
Figure 5: Variation of reliability index with depth ratio at different shape ratio.
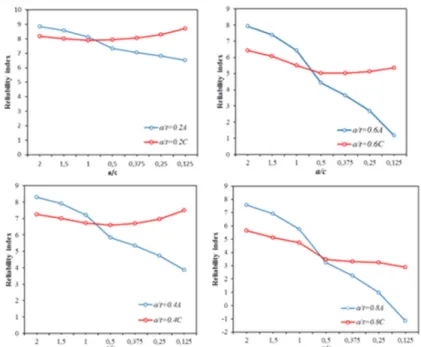
Moreover, the variation of reliability index with different shape ratios at fixed crack depths is investigated. Two cases are considered in Fig. 6:
Case 1: reliability index estimated at deep point Case 2: reliability index estimated at shallow point
A. Guillalet alii, Frattura ed Integrità Strutturale, 49 (2019) 341-349; DOI: 10.3221/IGF-ESIS.49.34
347
In case 1, the letter A is used to refer to deep point. It is clear that reliability index is strongly influenced by shape factor. For the same depth ratio, reliability index decreases with increasing of the crack length. This trend is accentuated with increasing depth ratio from 0.2 to 0.8. A direct consequence is that a lack of precision during crack geometrical identification can lead to a considerable error in reliability estimation in advanced stage of growth (a/t = 0.8) comparing to initial stage (a/t = 0.2)
In case 2, the letter C is used to refer to surface point. For (a/t ≤ 0.4), reliability indexis approximately steady for the shape ratio (a/c > 1) and increase with decreasing (a/c). For (a/t > 0.4), the inverse is happening, where β is decreasing for (a/c ≥ 1) and approximately steady for (a/c < 1). This means that the influence of crack shape factor is not same for all configurations of cracks when SIF is calculated in surface point. Although, comparing values of reliability index for different depth ratio, it seems that β decrease with increasing depth as showed in Fig. 5. As consequence, calculation of reliability index in deep point illustrates a monotonic effect of shape factor variability on structural reliability analysis. Another point should be noted, for high shape ratio (a/c ≥ 1), reliability index in surface βA is lower than those in deep
point βC; while βA for surface point is higher than βC for (a/c < 1). This Remarque implies that considering SIF in surface
point results in high or less conservatism then deep point according to the considered crack shape ratio.
Figure 6: Variation of reliability index with different cases of shape factor at constant a/t b- Reliability fatigue assessment
In this second part, the fatigue life time of cracks with two different shape factors is calculated based on Paris crack growth expressed in Eqn. (6):
* * m a a m c c da C K dN dc C K dN (7) where:
Ca=Cc are Paris crack growth rates in deep and surface directions, they are assumed to be equal.
∆Ka, ∆Kc are the change in applied stress intensity factor in deep and surface point respectively.
Paris crack growth expressed in Eqn. (6) considers tow dimensional crack growth. Simultaneous evolution of crack depth and length can reflect the crack shape evolution. Tow configurations of initial shape are presented in Tab. 2. The first is a small crack with semicircular shape, the second is a shallow crack with an aspect ratio a/c=0.2. An applied 150 MPa equivalent cycles is used to represent the stress severity indicator in term of number of cycle during fatigue life of the pipeline.
A. Guillalet alii, Frattura ed Integrità Strutturale, 49 (2019) 341-349; DOI: 10.3221/IGF-ESIS.49.34
348
Variables Description μ cov Std Distribution
a1 Crack depth (mm) 4 / / Fixed
c1 Crack length (mm) 4 / / Fixed
a2 Crack depth (mm) 4 / / Fixed
c2 Crack length (mm) 20 / / Fixed
D Outside diameter (mm) 1219,2 0.0 0,0121 Normal
t Pipe thickness (mm) 12,1 0,605 Normal
P Maximum operating pressure (MPa) 8 Fixed
∆σ applied pipeline wall stress range
(MPa) 150 Fixed
KIc Fracture toughness (MPa.m1/2) 137 13.7 Normal
Ca=Cc Fatigue crack growth rate
(mm/cycle) 5*10
-9
Fixed
m Fatigue exponent 3.1 Fixed
Table 2: Input parameters for fatigue calculations.
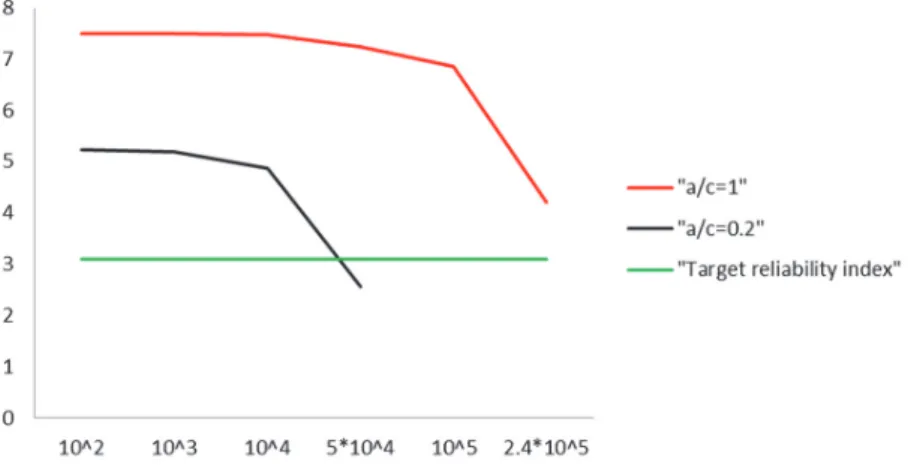
A target reliability index of 3.1 is fixed for comparison purpose. Calculations are made using the same reliability method and input variables presented in Tab. 2. Variation of reliability index is plotted against number of experienced cycles for both configurations of crack.
According to Fig. 7, crack with initial a/c = 0.2 and a/c = 1 have a fatigue life time of 5*104 and >2.4*105 respectively.
This results can be interpreted according to Fig. 5, where β for shape ratio a/c = 0.5 is less than β for a/c = 1, so the first case reach the target reliability index before the second. Also, these results seems to be in difference with those in [11] where the authors fixed the aspect ratio for all fatigue life. He found that semicircular crack had a shorter life time then shallow crack. This disagreement may be attributed to the assumption of fixed shape factor. Stress intensity factor is estimated with less accuracy. The authors in [11] made the rest of his calculations with constant shape factor a/c=0.62 following recommendations in [18] in order to not shadow the influence of others parameters of study.
Figure 7: Fatigue life time of cracks with different shape factor
CONCLUSION
n this article, effect of crack shape factor in reliability analysis of axially cracked pipeline was illustrated. Shape and depth crack ratio were varied to cover different crack shape and growth ranges. Reliability index was plotted against different configurations of shape and depth ratio. According to the variation of reliability index calculated in deep point, this later is greatly influenced by the crack shape and depth ratio. Shallow cracks have lower reliability index followed by deep cracks .As consequences, it seems that shallow cracks are more susceptible to cause fracture then deep cracks. Reliability index calculated in deep point decrease with increasing of depth ratio for all crack shape. The reliability
A. Guillalet alii, Frattura ed Integrità Strutturale, 49 (2019) 341-349; DOI: 10.3221/IGF-ESIS.49.34
349
index calculated in surface point has a variation that is not similar for all shape and depth ratio configurations. As a conclusion, Consideration of results from deep point reflects the sensitivity of reliability index to crack configuration while calculations in surface point reflects change in dependency of reliability index to the crack shape. Fatigue life calculation shows that variation of crack shape factor can influence reliability index estimation. Initial shallow crack was revealed to have shorter life time then initial semicircular crack differently from results in [11]. Finally, an accurate correlation between a/t and a/c can give more precision in service life estimation of cracked pipeline.
REFERENCES
[1] Zhang, K., Ferguson, J. (2017). Crack Shape Development in Fatigue Growth Assessment for Pipelines, presented at
the Corrosion 2017, New Orleans, Louisiana, USA,
[2] Mahmoud, M. A. (1988).Quantitative prediction of growth patterns of surface fatigue cracks in tension plates,
Engineering Fracture Mechanics, 30, pp. 735-746. DOI: 10.1016/0013-7944(88)90134-8.
[3] Newman, J. C. and Raju, I. S. (1981). An empirical stress-intensity factor equation for the surface crack, Engineering Fracture Mechanics, 15, pp. 185-192. DOI: 10.1016/0013-7944(81)90116-8.
[4] Boukharouba, T., Azouaoui, K., Gilgert, J., Azari, Z., and Pluvinage, G. (2008). Some Insights into the Fatigue Crack Propagation in Tubes Under Internal Pressure—Proposition of Predicting Models, in Safety, Reliability and Risks Associated with Water, Oil and Gas Pipelines, ed: Springer, p.^pp. 183-204. DOI: 10.1007/978-1-4020-6526-2.
[5] Zhu, L. and Tao, J. (2016). Comparison of Stress Intensity Factors of Part Surface Flaws at Stress Concentration in
Plate and Pipe Between FE Analysis and Weight Function Approach, p. V01AT01A010. DOI: 10.1115/pvp2016-63262.
[6] el Amine, M., Seghier, B., Bettayeb, M., Bouali, E. and Gaceb, M. (2017). Probabilistic approach evaluates reliability of pipelines with corrosion defects.
[7] el Amine, M., Seghier, B., Keshtegar, B. and Elahmoune, B. (2018). Reliability analysis of low, mid and high-grade
strength corroded pipes based on plastic flow theory using adaptive nonlinear conjugate map, Engineering Failure Analysis, 90, pp. 245-261. DOI: 10.1016/j.engfailanal.2018.03.029.
[8] el Amine, M., Seghier, Keshtegar, B., Correia, J. A., Lesiuk, G. and De Jesus, A. M. (2019). Reliability analysis based on hybrid algorithm of M5 model tree and Monte Carlo simulation for corroded pipelines: Case of study X60 Steel grade pipes, Engineering Failure Analysis, 97, pp. 793-803. DOI: 10.1016/j.engfailanal.2019.01.061.
[9] Kocańda, D. and Jasztal, M. (2012). Probabilistic predicting the fatigue crack growth under variable amplitude
loading, International Journal of Fatigue, 39, pp. 68-74. DOI: 10.1016/j.ijfatigue.2011.03.011.
[10]Bettayeba, M., Bouali, E., Abdelbaki, N. and Gaceb, M. (2012). Establishment of a database and a classification of the defects in the metal of pipes according to their severity, Procedia Engineering, 42, pp. 607-615.
DOI: 10.1016/j.proeng.2012.07.453.
[11]Leander, J. and Al-Emrani, M. (2016). Reliability-based fatigue assessment of steel bridges using LEFM–A sensitivity
analysis, International Journal of Fatigue, 93, pp. 82-91. DOI: 10.1016/j.ijfatigue.2016.08.011.
[12]Kirkemo, F. (1988). Applications of probabilistic fracture mechanics to offshore structures, Applied Mechanics
Reviews, 41, pp. 61-84. DOI: 10.1115/1.3151882.
[13]el Amine, M., Seghier, B., Bettayeb, M., Correia, J., De Jesus, A. and Calçada, R. (2018). Structural reliability of
corroded pipeline using the so-called Separable Monte Carlo method, The Journal of Strain Analysis for Engineering Design, 53(8), pp. 730-737. DOI: 10.1177/0309324718782632.
[14]Keshtegar, B., el Amine, M., Seghier, B., (2018). Modified response surface method basis harmony search to predict
the burst pressure of corroded pipelines, Engineering Failure Analysis, 89, pp. 177-199. DOI: 10.1016/j.engfailanal.2018.02.016.
[15]Abdelkhalak El, H., ChangWu, H. and Bouchaïb, R. (2017). Overview of Structural Reliability Analysis Methods Part
II Sampling Methods, Incertitudes et fiabilité des systèmes multiphysiques, 1. DOI: 10.21494/iste.op.2017.0116.
[16]Guillal, A., Abdelbaki, N., Gaceb, M. and Bettayeb, M. (2018). Effects of Martensite-Austenite Constituents on
Mechanical Properties of Heat Affected Zone in High Strength Pipeline Steels-Review, Chemical engineering transactions, 70, pp. 583-588. DOI: 10.3303/CET1870098.
[17]Briottet, L., Batisse, R., de Dinechin, G., Langlois, P. and Thiers, L. (2012). Recommendations on X80 steel for the design of hydrogen gas transmission pipelines, International Journal of Hydrogen Energy, 37, pp. 9423-9430.
DOI: 10.1016/j.ijhydene.2012.02.009.