20th International Conference on Structural Mechanics in Reactor Technology (SMiRT 20) Espoo, Finland, August 9-14, 2009 SMiRT 20-Division V, Paper 1816
On the Floor Response Spectra due to Aircraft Impact
Anton Andonov
a, Kiril Apostolov
a, Dimitar Stefanov
a, and Marin Kostov
aa
Risk Engineering LTD , Sofia, Bulgaria, e-mail: [email protected]
Keywords: Large Aircraft Impact, Reactor Building, Non-linear Dynamic Analysis, Floor Response Spectra.
1
ABSTRACT
Assessment of the effects of a large aircraft impact on a NPP reactor building are the basic topics of the present work. The focus is on the dynamic response of the internal sub-structures, by means of floor response spectra. The factors influencing the floor response spectra, as the nonlinearities of the impact area, load time function shape and the impact velocity are pointed out and subsequent conclusions are made. Alternative motion parameters for assessment of the damage potential and procedure for indirect assessment of the equipment capacity are also discussed.
2
INTRODUCTION
The load case – aircraft impact, is not new in the Nuclear Power Plant design. It can be considered, that the starting point, has been the request of the US National Regulatory Commission in 1968 for safety evaluation of the Three-Mile Island nuclear power plant station against accidental aircraft impact, Riera (1980). Impact of commercial aircraft has been considered and as representative case, normal impact of Boeing 720 with velocity of 103m/s was investigated. As part of this project, the method for calculation of the load function of aircraft impact on rigid target has been developed and published, Riera (1968). The work is considered as pioneering study of the aircraft impact problem and the developed method developed for load function calculation, known later on as Riera’s method, is still used today.
Later, in the early 1970’s the aircraft impact problem was subjected of widening interest from both sides of the Atlantic, which resulted in large number of relevant publications. Two main trends were formed. The US concept, i.e. impact of commercial aircraft - Boeing 720 or 707 class at landing speed – and the German concept for impact of military fighter aircraft at flight speed. Based on the work of, Drittler and Gruner (1973), an official design load function of Phantom II was introduced by the German Department of the Interior in 1974, Henkel and Wölfel (1984). Consequently, several national regulatory agencies introduced the load case aircraft impact as design basis. Therefore, after 1974 several plants in Switzerland, Belgium and all nuclear power plants in Germany have been specifically designed to resist accidental aircraft crash.
Since, the first studies of aircraft impact on nuclear facilities in the seventies, the engineers’ attention was concentrated on both aspects from structural mechanics point of view: 1) the structural capacity to be assured and 2) all components within the structure must sustain the induced vibrations.
the peak values will exceed the spectral acceleration of the seismic FRS, Riera (1980). Also it was found that the obtained FRS were very sensitive to the analysis input parameters – FRS corresponding to reaction-time curves for the same aircraft and impact velocity, but obtained by different methods, may be quite different in the high frequency range; the corners of the polygonal approximation to the reaction-time curve introduce high frequency components that play a decisive role in the values of the floor spectral acceleration in the high frequency range; the local non-linear response will filter and modify the vibration loading on the internal structures and equipment. All this uncertainties together with high peak values of the acceleration FRS (AFRS), which may be several times larger than the acceleration of gravity may lead to expensive design requirements, which do not necessary lead to improvement of the plant reliability. Despite, the short-comings of both, the “deterministic” approach and of the using of acceleration FRS (AFRS) only, were pointed out in the early beginning of studying the problem – aircraft impact, both concepts are still state-of-the-art today. Respectively, the same uncertainties are still valid.
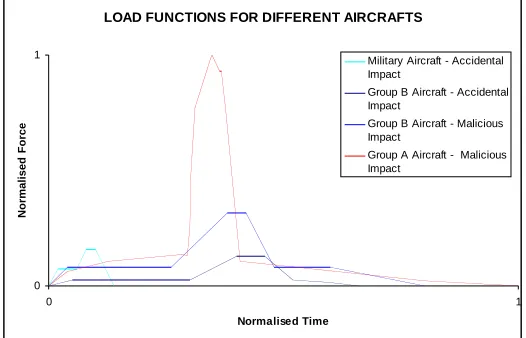
After, the events from September 11, a new load case was born – intentional impact of large passenger airliner. The loading parameters – peak force, load function shape, impulse – will vary significantly by changing the aircraft size (mass) and impact velocity. From structural engineer’s point of view, the aircrafts can be divided in three groups: Group A – large aircrafts with weight more than 330t (A380, A340, B747, B777); Group B – intermediate aircrafts with weight between 150t and 330t (A300, A330, A350, B767, B707); Group C – small aircrafts with weight less than 150t (A321, B737).
Figure 1, is qualitative comparison between the normalised load time functions of Phantom II and Boeing 707 describing accidental crash and available in the literature, Henkel and Wolfel (1984) and the load functions of or Group B aircraft and or Group A aircraft describing malicious impact. It is obvious that this new loading is from completely different scale, therefore can not be treated as the design basis load cases of aircraft impact. To satisfy the new high demands, raised from this new load case, new activities and investigations of airplanes impacting nuclear power plants were prompted. Presently the research is concentrated mostly in three fields – 1) coupled analysis taken into account the missile-target interaction, 2) refined modelling and dynamic analysis of the target structure considering the material non-linearity and 3) alternative procedures for assessment of the damage potential of the induced vibrations additionally to the classical approach of using AFRS. With the present work, the authors hope to add some contribution to the last two fields.
LOAD FUNCTIONS FOR DIFFERENT AIRCRAFTS
0 1
0 1
Normalised Time
N
o
rm
a
li
s
e
d
F
o
rc
e
Military Aircraft - Accidental Impact
Group B Aircraft - Accidental Impact
Group B Aircraft - Malicious Impact
Group A Aircraft - Malicious Impact
Figure 1. Selected load time functions for different aircraft impacts
3
METHOD OF INVESTIGATION
to the Riera method, Riera (1968). The reactor building is represented by detailed spatial model taking into account the non-linear material behavior and soil-structure interaction. The basic goal is to perform parametric study of the factors influencing the floor response spectra and to propose alternative approach for assessment of the damage potential of the induced vibrations. For the purpose series of non-linear time history analyses of complex spatial model are performed varying some significant parameters.
3.1 Object of the investigation
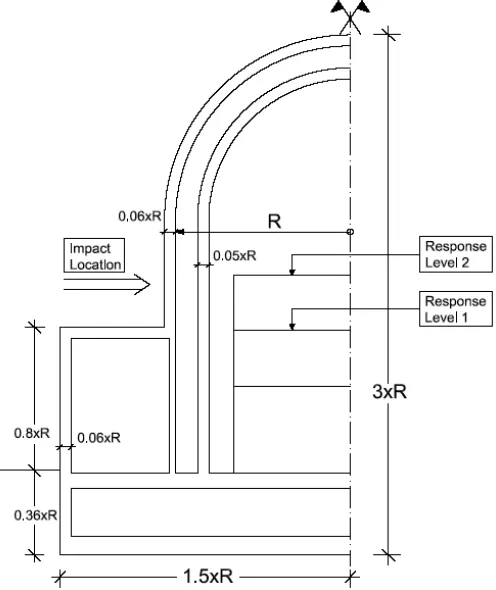
Representative structure of typical double shell reactor building, designed to resist impact of military jet is object of investigation in the present study. The structure includes all basic elements of modern reactor building. Double-shell containment concept is used to meet the safety requirements. Pre-stressed reinforced concrete is used for the inner containment. The outer protective shell is constructed of non-stressed reinforced concrete, aimed at protection against external hazards. Inside the containment the Accident Localization Area (ALA) is situated where all the basic equipments of the primary circuit is positioned. At two sides of the containment two adjacent annexes are located and all the structures are supported by a common foundation part. A vertical cut of a typical reactor building structure used in the present analyses is given in Figure 2.
Several aircraft crash scenarios are analysed in the present work of impacts with different speed on the cylindrical part of the protective shell. The floor response spectra evaluation is performed for two levels from ALA. The impact location and the response levels are shown in Figure 2.
Figure 2. Schematic view of typical reactor building employing the double shell concept.
3.2 Loading
F(t)=Re[x(t)]+ [x(t)]V2(t) (1)
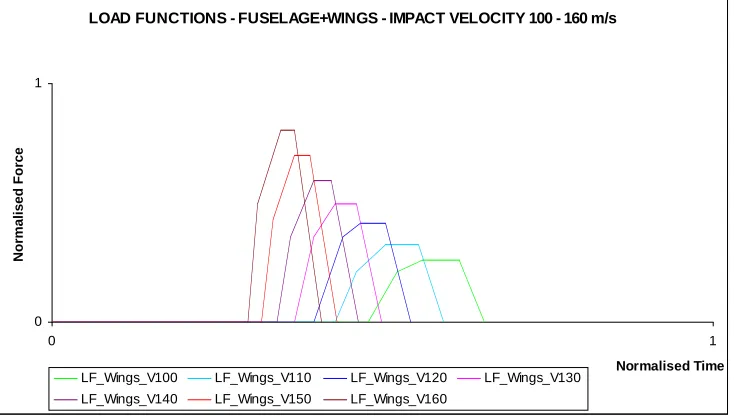
Furthermore, with some modification of the original method, separate load functions are calculated for all distinct structural parts of the aircraft – fuselage, wings and engines. Afterwards, the calculations are repeated with different velocities from 100 to 160 m/s and different fuel quantity as percent of the fuel capacity. Generally, the impact of the wings together with the central reservoir, control the shape and the intensity of the load function. Figure 3 illustrates the influence on the impact velocity over the normalised wing’s load function shape and intensity. Generally, with increasing the velocity, the load function becomes sharper – higher peak loading, steeper loading slopes and shorter duration. Except on the structural capacity, these effects have also serious effect on the shape and intensity of the AFRS. The impact area is based on geometrical considerations.
LOAD FUNCTIONS - FUSELAGE+WINGS - IMPACT VELOCITY 100 - 160 m/s
0 1
0 1
Normalised Time
N
o
rm
a
li
s
e
d
F
o
rc
e
LF_Wings_V100 LF_Wings_V110 LF_Wings_V120 LF_Wings_V130
LF_Wings_V140 LF_Wings_V150 LF_Wings_V160
Figure 3. Normalised impact load functions of representative aircraft from Group A, for impact velocities ranging from 100 to 160 m/s.
3.3 Numerical model and analyses
A detailed 3D model of the reactor building is developed. Shell elements are used for the model creation and different element integration orders were applied depending mainly on the significance of the area. Also the main equipment units are considered in the model, taking in account their geometry, mass and connection with the structure. The soil-structure interaction is represented by spring elements.
All analyses are executed with the SOLVIA finite element code and direct time integration method is used with a basic time step of 0.0005s as it is varied in specific places of each analysis.
In the containment shell model finite elements have been used simulating all cross section elements – concrete core, steel facing and reinforcing grid. In order to increase the solution accuracy, the containment shell is simulated by plane SHELL elements with increased number of integration points in the cross section depth,–which is 7. To these 7 integration points in the concrete core, additional integration points have been added for the rebar layers. Thus one could analyse the stressed state and degree of concrete damage within the depth of the containment structure wall together with the stress condition of the reinforcement. Principal composition of the finite elements used is shown on Fig. 4 (left upper corner).
Figure 4. Composition of the finite element used, together with the material constitutive laws.
4
RESULTS
To describe the sensitivity of the calculated AFRS depending on the different input parameters, comparison of AFRS for different load functions was made. The influence of the type of the load function used (discrete for particular velocity or enveloped) and the influence of the impact velocity were investigated.
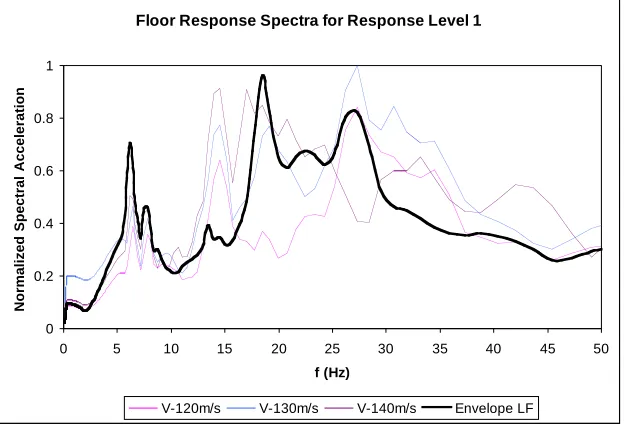
4.1 Influence of the load function shape
When analysing several impact scenarios as locations and with several impact velocities for each direction, one can be tempted to reduce the input load functions by enveloping 2 or 3 load functions with close velocities. Doing so, the engineer will be on the safety side when evaluating the structural capacity, since the enveloped load function will increase the impulse and thus the input energy. However, such enveloping modifies the dynamic parameters of the impact loading and can eventually lead to incorrect calculation of the FRS and eventually underestimation of the maximum spectral acceleration. On figure 5, an example of AFRS computed on response level 2 for load function with impact velocities 120, 130 and 140, together with the AFRS from load function which envelopes the mentioned load functions.
Floor Response Spectra for Response Level 1
0 0.2 0.4 0.6 0.8 1
0 5 10 15 20 25 30 35 40 45 50
f (Hz)
N
o
rm
a
li
z
e
d
S
p
e
c
tr
a
l
A
c
c
e
le
ra
ti
o
n
V-120m/s V-130m/s V-140m/s Envelope LF
Figure 5. Influence of the load function shape/type on the AFRS.
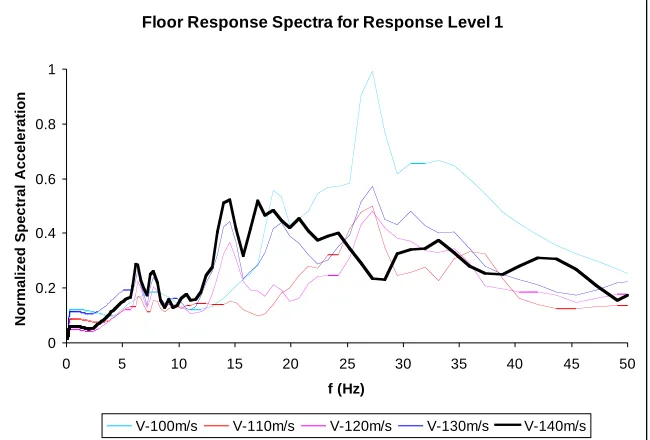
4.2 Influence of the impact velocity
Another interesting topic for investigation is the effect of the impact velocity on the internal structure response. There is no doubt, that most damages on the structure will be produced by the impact with the highest velocity (If all other conditions are the same). However, this can be not so straightforward regarding the floor response spectra. With increasing the impact force and therefore the damages of the structure, the dynamic response will be modified due to the non-linearity and thus will modify the input motion of the internal structure, both as frequency content and intensity. Figure 6, describes comparison of the AFRS at response level 2 for different impact velocities from 100 to 140 m/s.
Floor Response Spectra for Response Level 1
0 0.2 0.4 0.6 0.8 1
0 5 10 15 20 25 30 35 40 45 50
f (Hz)
N
o
rm
a
li
z
e
d
S
p
e
c
tr
a
l
A
c
c
e
le
ra
ti
o
n
V-100m/s V-110m/s V-120m/s V-130m/s V-140m/s
Figure 6. Influence of the impact velocity on the AFRS.
The AFRS due to the highest velocity impact is dominant in the low frequency range since the total input energy is generally higher. However, due to the strongest non-linear response the high frequencies are damped out. Furthermore, the highest spectral acceleration is actually produced from the slowest impact. This is because the structure resists the impact nearly elastic and transmits most of the energy directly to the internal substructures.
5
DISCUSSION ON ALTERNATIVE ASSESMENT OF THE DAMAGE POTENTIAL OF
THE INDUCED VIBRATIONS
There is continuing trend in the earthquake engineering community to look for a better evaluator of seismic motion damage potential. Most specialists agree that the peak acceleration and the acceleration response spectra are not always efficient as indicators of the potential damage although they are simple for use and lead to direct estimation of the inertia forces. The standard seismic design still relies on classical spectral theory and on acceleration. It is out of the scope of the present work to investigate all available parameters for calculation of the damage potential of the seismic or other dynamic motion. However, example of using the cumulative absolute velocity as indicator of the damageability potential is given. Also, alternative representation of the FRS in acceleration-displacement coordinates is given.
5.1 Cumulative Absolute Velocity
!
=Td
dt t a CAV
0 . )
( (4)
Where, a(t) is the acceleration, and Td the total duration. Standard methodology for CAV calculation is developed in US NRC RG 1.166 (1997), where CAV is incrementally calculated in one second intervals, where at least one value exceed 0.025g. The threshold of 0.025g is a significant assumption for definition of standardised CAV and any change of the threshold will change the CAV value of the record. If the threshold, is assumed zero, as in equation (4), than the CAV will depend from the duration definition.
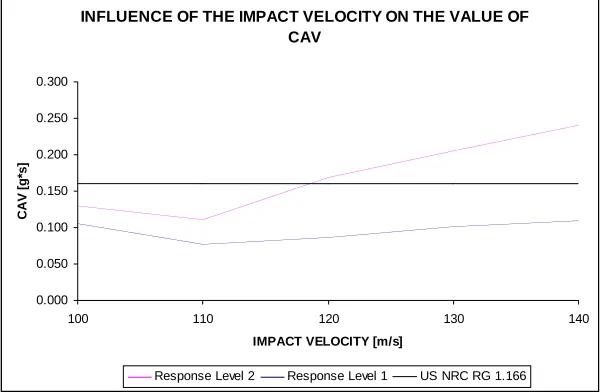
On Figure 7, the CAV values computed on response levels 1 and 2 from impacts with different velocities are plotted together with the limit of 0.16*g, given in US NRC RG 1.166 (1997). One should expect that under that limit, the damages in engineered structures are limited.
INFLUENCE OF THE IMPACT VELOCITY ON THE VALUE OF CAV
0.000 0.050 0.100 0.150 0.200 0.250 0.300
100 110 120 130 140
IMPACT VELOCITY [m/s]
C
A
V
[
g
*s
]
Response Level 2 Response Level 1 US NRC RG 1.166
Figure 7. Influence of the impact velocity (from 100 to 160 m/s) on the value of CAV.
The decrease of the CAV, with increasing the velocity from 100 to 110 m/s is due to the beginning of the non-linear response of the structure, which damp the induced vibrations. Thereafter, the intensity of the vibration in the equipment locations will depend from complex interaction of increasing loading intensity, increasing damping due to non-linear response, change of the dynamic characteristics of the sub-structures etc. This can lead to smooth (nearly constant) or sharp increasing of the strong motion damageability, here measured as CAV, depending on the response location.
The computed values of CAV can be compared with seismic ones or with some appropriate limit, as showed as example on Figure 7. Similar procedure, based on CAV with appropriate upper limit, can be used as additional tool for indirect or preliminary assessment of the damage potential of impact induced vibration.
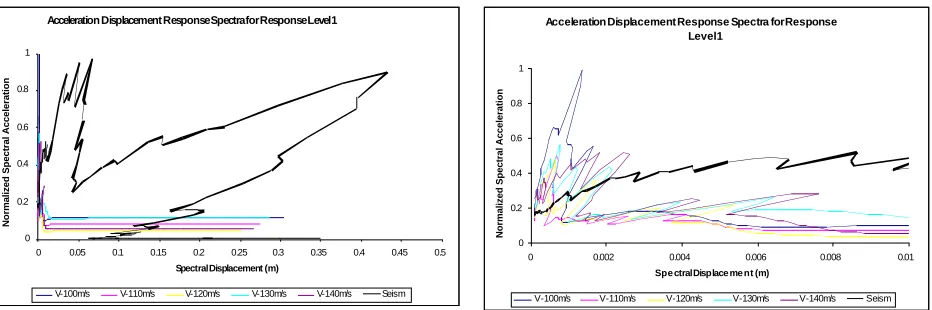
5.2 Acceleration Displacement Response Spectrum
The standard response spectra contained in the building codes is a plot of the acceleration vs. period (or frequency) domain which is convenient for the code design procedure, based on forces (strength). However, both forces and deformation are important in the dynamic response. Therefore it is convenient to plot the spectra in an acceleration vs. displacement domain which has been termed Acceleration Displacement Response Spectrum (ADRS). The ADRS is utilized by the capacity spectrum method, Freeman (1978), which is based on direct graphical comparison of the ADRS with the capacity curve of particular MDOF structure converted also in spectral acceleration – spectral displacement coordinates. The force-deformation capacity curve is converted in spectral acceleration-spectral displacement coordinates using the modal properties of the structure presented as equivalent SDOF oscillator. The intersection point of the capacity curve and the ADRS is called performance point, ATC 40 (1996), and gives the maximum response acceleration and displacement.
Acceleration Displacement Response Spectra for Response Level 1 0 0.2 0.4 0.6 0.8 1
0 0.05 0.1 0.15 0.2 0.25 0.3 0.35 0.4 0.45 0.5
Spectral Displacement (m)
N o rm a li z e d S p e c tr a l A c c e le ra ti o n
V-100m/s V-110m/s V-120m/s V-130m/s V-140m/s Seism
Acceleration Displacement Response Spectra for Response Level 1 0 0.2 0.4 0.6 0.8 1
0 0.002 0.004 0.006 0.008 0.01
Spe ctral Displace me nt (m)
N o rm a li z e d S p e c tr a l A c c e le ra ti o n
V-100m/s V-110m/s V-120m/s V-130m/s V-140m/s Seism
Figure 8. Influence of the impact velocity (from 100 to 160 m/s) on the ADRS and comparison with seismic spectrum.
The spectral acceleration from the impact response spectra exceed the seismic ones only in the range of extremely small spectral displacements (high frequency range), which should produce considerably smaller damage potential of the impact produced ground motion. Also, the ADRS can be used under the capacity spectrum method for simplified indirect assessment of the equipment response and capacity.
6
CONCLUSION
Series of non-linear dynamic analyses of impact of large commercial aircraft with different impact
velocities are performed and floor response spectra at representative locations are computed. The
results lead to the conclusion that the highest impact intensity (peak force) dos not necessary
produce conservative results, in form of floor response spectra. Also, the enveloping of several load
functions with similar velocities, despite that is conservative for the evaluation of the load bearing
capacity and that can decrease sufficiently the time cost for analysis of many impact scenarios, can
lead to underestimation of the high frequency response.
The applicability of alternative “ground” motion parameter for assessment of the vibration damage potential is discussed, together with procedure for indirect assessment of the internal structures, based on code provisions for seismic design/assessment of conventional structures.
REFERENCES
ATC-40. 1996. Seismic evaluation and retrofit of concrete buildings, Applied Technology Consul.
Drittler, K., Gruner, L., Sutterlin,L. 1973. Zur Auslegung kern-technischer Anlagen gagen einwirkungen von aussen. IRS-W-7.
Freeman, S.A. 1978. Prediction of response of concrete buildings to severe earthquake motion. ACI SP-55, P.589-605.
Henkel, F.-O., Wölfel, H. 1984. Building concept against airplane crash, Nuclear Engineering and Design. Vol. 79, P. 397-409.
Henkel, F.-O., Klein, D. 2007. Variants of analysis of the load case airplane crash. SMiRT 19, paper J03-2.
Joval, O. 2007. Airplane crash simulations: comparisson of analyses results with test data. SMiRT 19, paper J04-4.
Riera, J.D. 1968. On the stress analysis of structures subjected to aircraft impact forces. Nuclear Engineering and Design, Vol. 8, P. 415-426.
Riera, J.D. 1980. A critical reapraisal of nuclear power plant safety against accidental aircraft impact. Nuclear Engineering and Design, Vol. 57, P. 193-206.