TITLE PAGE
Decision Support System of Coal Mine Planning
Using System Dynamics Model
To the Faculty of Geosciences, Geoengineering and Mining
of the Technische Universität Bergakademie Freiberg
approved
THESIS
to attain the academic degree of
Doktor-Ingenieur
(Dr.-Ing.)
submitted
by M.Sc. Phongpat Sontamino
born on the 03.11.1978 in Nakhon Si Thammarat/ Thailand Reviewers: Prof. Dr. Carsten Drebenstedt, Germany
Prof. Dr. Pitsanu Bunnaul, Thailand Prof. Dr. Horst Brezinski, Germany
ABSTRACT
Coal is a fossil fuel mineral, which is presently a major source of electricity and energy to industries. From past to present, there are many coal reserves around the world and large scale coal mining operates in various areas such as the USA, Russia, China, Australia, India, and Germany, etc [1, 2]. Thailand’s coal resources can be found in many areas; there are lignite mining in the north of Thailand, the currently operational Mae Moh Lignite Mine [3, 4], and also coal reserves in the south of Thailand, such as Krabi and Songkhla [5], where mines are not yet operating. The main consumption of coal is in electricity production, which increases annually. In 2019, the Thai Government and Electricity Generating Authority of Thailand (EGAT) plans to run a 800 MW coal power plant at Krabi [6], which may run on imported coal, despite there being reserves of lignite at Krabi [5]; the use of domestic coal is a last option because of social and environmental concerns about the effects of coal mining. There is a modern trend in mining projects, the responsibility of mining should cover not only the mining activity, but the social and environmental protection and mine closure activities which follow [6]. Thus, the costs and decisions taken on by the mining company are increasingly complicated.
To reach a decision on investment in a mining project is not easy; it is a complex process in which all variables are connected [7]. Particularly, the responsibility of coal mining companies to society and the environment is a new topic. Thus, a tool to help to recognize and generate information for decision making is in demand and very important. In this thesis, the system dynamics model of coal mine planning is made by using Vensim Software [8] and specifically designed to encompass many variables during the period of mining activity until the mine closure period. The decisions use economic criteria such as Net Present Value (NPV) [9], Net Cash Flow (NCF), Payback Period (PP) [10], and Internal Rate of Return (IRR), etc.
Consequently, the development of the decision support system of coal mine planning as a tool is proposed. The model structure covers the coal mining area from mine reserves
make the right decisions on their policies, economics, and the planning of new coal mining projects.
Furthermore, the model is used to analyse the case study of the Krabi coal-fired power plant in Thailand, which may possibly use the domestic lignite at Krabi. The scenario simulations clearly show some potential for the use of the domestic lignite. However, the detailed analysis of the Krabi Lignite Mine Project case shows the high possible risks of this project, and that this project is currently not feasible. Thus, the model helps to understand and confirm that the use of domestic lignite in Krabi for the Krabi Coal Power Plant Project is not suitable at this time. Therefore, the best choice is imported coal from other countries for supporting the Krabi Coal Power Plant Project.
Finally, this tool successfully is a portable application software, which does not need to be installed on a computer, but can run directly in a folder of the existing application. Furthermore, it supports all versions of Windows OS.
ACKNOWLEDGEMENTS
I would like to express my deepest and warmest thanks and gratitude to my supervisor Prof. Dr. Carsten Drebenstedt for his kind supervision, valuable advice, guidance, for reviewing this thesis, and his support throughout my study in the Federal Republic of Germany. In addition, special thanks to my reviewers and all PhD committees, Prof. Dr. Horst Brezinski, Prof. Dr. Pitsanu Bunnaul, Prof. Dr. Mohamed Amro, Prof. Dr. Bernhard Jung, and Prof. Dr. Carsten Felden, for all recommendations in this thesis. I address my hearty and special thanks and gratitude to my home country (Thailand) for granting me the scholarship to do a doctorate at the TU Bergakademie Freiberg. I thank all of the staff of the Thai embassy in Berlin, and all of the scholarship staff in Thailand for their aid in providing support during the time I have spent in Freiberg, Germany. Many thanks are directed to my colleagues in the Department of Mining and Materials Engineering, Faculty of Engineering, Prince of Songkla University; and especially to Asst. Prof. Dr. Manoon Masniyom for their advice and support of everything during my study.
I am also greatly thankful to all the colleagues and staff of the Institute of Mining and Special Civil Engineering; Dr. Günter Lippmann, Dr. Pham Van Hoa, Mr. Richard A. Eichler, Mr. Martin Pfütze, Mr. Inthanongsone Inthavongsa and others, for their kindness and encouragement during my studies.
Many thanks must go to the Mae Moh Lignite Mine in Thailand, especially to Mr. Ampon Kitichotkul, Mr. Titipun Phongramon, and others for support data and allowing me to use all of the information to form the case study in this thesis.
I address my sincere thanks to my parents and all my family members for their continued support, education, and tolerance.
Finally, special thanks to my wife Mrs. Chutikarn Sontamino, for her great love, forbearance, tolerance, and encouragement. I owe my wife a debt of gratitude for her
TABLE OF CONTENTS
Title Page ... I Abstract ... III Acknowledgements ... V Table of Contents ... VI List of Figures ... VIII List of Tables ... XI List of Abbreviatio ... XII
1 Introduction ... 1
1.1 Stage of Coal Mining System ... 1
1.2 Thailand Coal Mining and Problems ... 5
1.3 Objectives ... 8
1.4 Remarks ... 8
1.5 Thesis Outlines ... 9
2 Literature Reviews ... 11
2.1 Multi-method Simulation Approach ... 11
2.2 System Dynamics Theory and Modelling ... 12
2.2.1 Overview ... 12
2.2.2 The System Dynamics Approach ... 13
2.2.3 SD Modelling and Simulation ... 14
2.2.4 Feedback Thinking ... 15
2.2.5 System Structure ... 17
2.3 System Dynamics Modelling Software Selection ... 19
2.4 System Dynamics Model and Decision Making in Mining ... 21
2.5 Chapter Conclusion ... 25
3 Research Methodology and Model Development ... 27
3.1 Research Approach ... 27
3.2 Develop SD Model ... 29
3.2.1 Causal Loop Diagram ... 29
3.2.2 System Dynamics Model ... 32
3.3 Chapter Conclusion ... 42
4 Case Study Krabi Lignite Mine ... 43
4.3 Model Verification ... 59
4.3.1 Logical checking ... 60
4.3.2 Model structure checking ... 60
4.3.3 Model unit checking ... 61
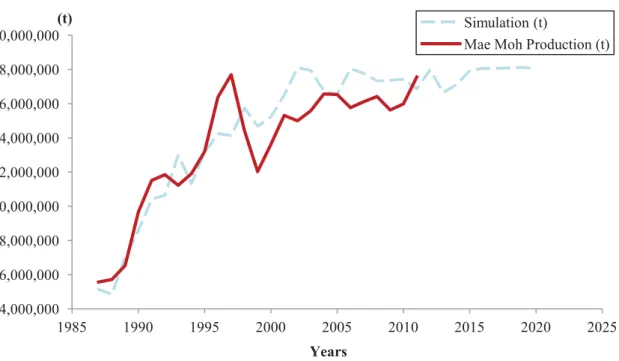
4.3.4 Compared calculation result with real data ... 61
4.4 Simulation Conditions Setup ... 66
4.4.1 Sensitivity Analysis Conditions ... 67
4.4.2 Scenario Simulation Conditions ... 67
4.4.3 Optimum Funding Conditions ... 69
5 Case Study Simulation Results and Discussion ... 70
5.1 Simulation Results of Krabi Lignite Mine Project ... 70
5.1.1 Sensitivity Analysis Results ... 70
5.1.2 Scenario Simulation Results ... 81
5.1.3 Optimum Funding Result ... 91
5.2 Discussion of Krabi Lignite Mine Project ... 94
5.2.1 The Comparison of Scenarios Simulation ... 94
5.2.1 Electricity Price Effect on Krabi Lignite Mine Project ... 98
5.2.2 Economic Value of Krabi Lignite Mine Project ... 100
5.2.3 The Alternative of Krabi Coal Power Plant Project ... 102
6 Development of Application Interface ... 105
6.1 Application Interface Result ... 106
6.1.1 Scenario Simulation Menu ... 108
6.1.2 Sensitivity Analysis Simulation Menu ... 111
6.2 Application Installation and Usage ... 114
7 Summary and Recommendation ... 116
7.1 Summary ... 116
7.2 Recommendations for Further Research ... 117
References ... 119
I. Appendix 1: Background Information ... 124
World Coal Status and Coal Mining ... 124
Social and Environmental Problems of Coal Mining ... 139
Mine Economic Valuation ... 143
II. Appendix 2: Additional Information Table ... 166
III. Appendix 3: Model Equations Code ... 173
LIST OF FIGURES
Figure 1.1: Top 10 world coal reserves (2008) [1] ... 1
Figure 1.2: World energy consumption by sources (1987-2012) [13] ... 2
Figure 1.3: Resources to production ratio (R/P ratio) [13] ... 2
Figure 1.4: World energy source of electricity [14] ... 3
Figure 1.5: Environmental impact of mining (example) [6] ... 4
Figure 1.6: Mae Moh Lignite Mine and Power Plant [4] ... 5
Figure 1.7: The simple process of surface coal mining in Thailand (modified) [18]... 6
Figure 1.8: Sources of electricity in Thailand and the world [14] ... 7
Figure 2.1: Forrester’s organizing framework for the system structure ... 17
Figure 2.2: The conceptual model of C. Roumpos, et.al. [7] ... 21
Figure 2.3: Fan’s flow diagram of coal production and supply [62] ... 22
Figure 2.4: Concept of the Caselles-Moncho’s model [63] ... 23
Figure 2.5: Principle of the O’Regan model diagram [64] ... 24
Figure 3.1: Research approach and SDM development procedure ... 27
Figure 3.2: Causal loop diagram of mine planning system ... 29
Figure 3.3: The conceptual diagram for mine planning decision (Narrow Sense) ... 30
Figure 3.4: The conceptual diagram for mine planning decision (Wider Sense) ... 31
Figure 3.5: The conceptual diagram for mine planning decision (Widest Sense) ... 31
Figure 3.6: SDM Structure of Mining System ... 34
Figure 3.7: SDM Structure of Economic Decision ... 36
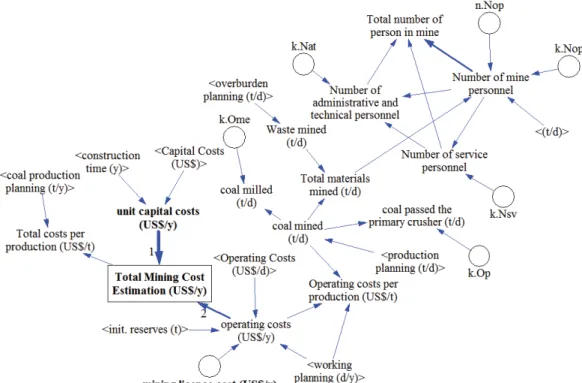
Figure 3.8: SDM Structure of Total Cost and Worker Estimation ... 37
Figure 3.9: SDM Structure of Operating Cost Estimation ... 38
Figure 3.10: SDM Structure of Capital Cost Estimation ... 40
Figure 3.11: SDM Structure of Power Plant Economic Value ... 41
Figure 4.1: Coal potential resources and reserves of Thailand (Modified) [65] ... 43
Figure 4.2: Coal Production in Thailand (1987-2012) (Revised) [66, 67] ... 45
Figure 4.3: Coal Consumption in Thailand (1987-2012) (Revised) [66, 67] ... 46
Figure 4.4: Position map of Krabi coal reserves (Modified) [70] ... 47
Figure 4.5: Lignite Price (1949-2011) [36] ... 52
Figure 4.10: Model Structure Checking Result ... 60
Figure 4.11: Model Unit Checking Result ... 61
Figure 4.12: Mae Moh Lignite Mine (Modified) [68] ... 62
Figure 4.13: Comparison of Mae Moh Production by Real Data and Simulation ... 65
Figure 4.14: Procedure of Simulation Result Making ... 66
Figure 4.15: Lignite Price Trend Forecasting (Modified) [88] ... 69
Figure 5.1: Sensitivity Analysis Result of Lignite Price ... 71
Figure 5.2: Sensitivity Analysis Result of Stripping Ratio... 72
Figure 5.3: Sensitivity Analysis Result of Coal Heating Value ... 73
Figure 5.4: Sensitivity Analysis Result of Tax Rate ... 75
Figure 5.5: Sensitivity Analysis Result of Discount Rate ... 76
Figure 5.6: Sensitivity Analysis Result of Unit S&EP Cost ... 77
Figure 5.7: Sensitivity Analysis Result of Unit Mine Closure Cost ... 78
Figure 5.8: Sensitivity Analysis Result of Deposit Interest Rate ... 79
Figure 5.9: Summary sensitivity analysis of each variable to NPV Balance ... 80
Figure 5.10: The decision criteria result of the Constant Price Scenario ... 82
Figure 5.11: The decision criteria result of the Normal Forecasting Price Scenario ... 85
Figure 5.12: The decision criteria result of the Worst Forecasting Price Scenario ... 88
Figure 5.13: The decision criteria result of the Best Forecasting Price Scenario ... 90
Figure 5.14: Cumulative mining fund a long period of mine life ... 92
Figure 5.15: Mining fund cash flow comparison... 92
Figure 5.16: The optimum mining fund on the Normal Forecasting Price Scenario ... 93
Figure 5.17: The comparison of scenario simulation graph results I ... 95
Figure 5.18: The comparison of scenario simulation graph results II ... 96
Figure 5.19: The comparison of scenario simulation graph results III ... 97
Figure 5.20: Krabi power plant decision condition ... 100
Figure 5.21: Economic value of society by royalties and corporate tax ... 101
Figure 5.22: Unit of power plant fuel cost and profit comparison ... 103
Figure 6.1: Interface Diagram of DSS-CMPv1.0 ... 106
Figure 6.2: Cover Interface of DSS-CMPv1.0 ... 107
Figure 6.7: Scenario Result II Interface of DSS-CMPv1.0 ... 110
Figure 6.8: Scenario Result III Interface of DSS-CMPv1.0 ... 110
Figure 6.9: Sensitivity Analysis Condition Setup Interface of DSS-CMPv1.0... 111
Figure 6.10: DSS-CMPv1.0 Sensitivity Graph of Net Cash Balance (example) ... 112
Figure 6.11: DSS-CMPv1.0 Sensitivity Graph of NPV Balance (example) ... 113
Figure 6.12: DSS-CMPv1.0 Sensitivity Graph of Cumulative Mining Fund (example) ... 113
Figure 6.13: Application password protection ... 115
Figure I.1: Pyramid of the USA coal resources and reserves [22] ... 124
Figure I.2: Resource to production ratio 2013 [12] ... 127
Figure I.3: Coal potential and occurrence around the world [24] ... 127
Figure I.4: Distribution of proved reserves in 1992, 2002, and 2012 [13] ... 128
Figure I.5: Surface coal mining method (example) [27] ... 129
Figure I.6: Longwall mining method [32] ... 130
Figure I.7: Coal production and consumption by region [13] ... 131
Figure I.8: Coal consumption per capita 2012 [13] ... 133
Figure I.9: The global coal price 1949 - 2011 (Modified) [36] ... 135
Figure I.10: Cost of fossil-fuel receipts at electric generating plants 1973-2012 [35] ... 136
Figure I.11: Coal production, consumption, import, and export in USA. [38] ... 138
LIST OF TABLES
Table 2.1: List of system dynamics modelling software (Modified) [60] ... 19
Table 2.2: The analytical comparison of the top 5 of system dynamics software [60] ... 20
Table 4.1: Analytical coal quality of Krabi [5] ... 48
Table 4.2: Analytical coal resources in Krabi [5] ... 49
Table 4.3: Statistical analysis of the coal price in US$/t [36] ... 53
Table 4.4: Energy plan of Thailand 2012-2030 [74] ... 54
Table 4.5: Statistical analysis of the discount rate [80, 82 , 84] ... 59
Table 4.6: Mechanical properties of coal and overburden in Mae Moh Mine [69] ... 64
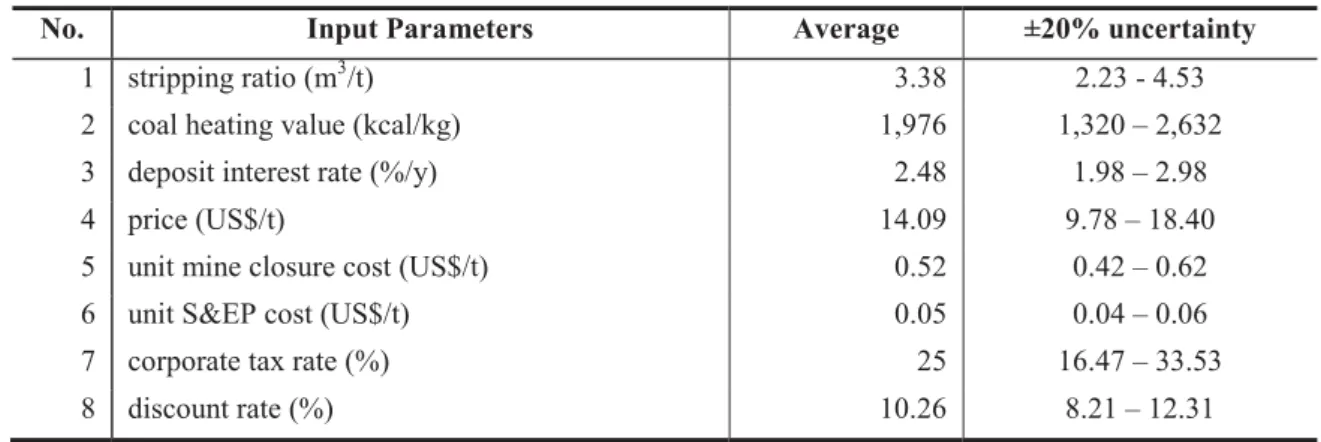
Table 4.7: List of input variable values used for sensitivity analysis ... 67
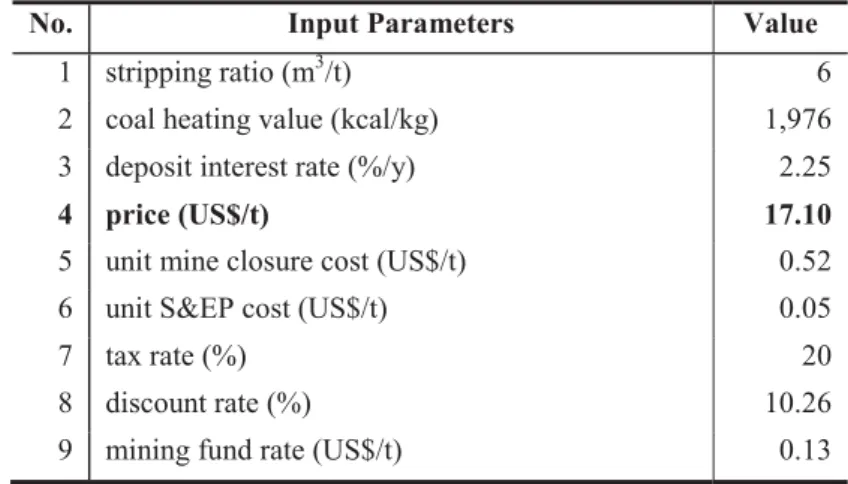
Table 4.8: List of highlight input variable for Constant Price Scenario ... 68
Table 4.9: Criteria of the optimum condition ... 69
Table 5.1: Summary critical point in each scenario ... 98
Table 5.2: Summary alternative of Krabi Coal Power Plant Project ... 104
Table I.1: Top 5 world hydrocarbon energy reserves by country (2011) [2 2] ... 128
Table I.2: Top 5 world coal reserves by countries (2013) [12] ... 128
Table I.3: Top 5 world coal producers (2004-2012) [33, 34] ... 132
Table I.4: Top 5 world coal consumers (2008-2013) [12] ... 132
Table I.5: Coal average sales prices (2011) [35] ... 134
Table I.6: Top 5 world coal importing countries (2006-2012) [37] ... 137
Table I.7: Top 5 world coal exporting countries (2006-2012) [39] ... 138
Table I.8: Mining costs for ore and waste [43] ... 145
Table II.1: The lignite production of Thailand (1987-2012) [66, 67] ... 166
Table II.2: The lignite consumption of Thailand (1987-2012) [66, 67] ... 167
Table II.3: List of input parameter values in Constant Price Scenario ... 168
Table II.4: List of input parameters of the model ... 169
Table II.5: List of auxiliary input parameter unit converters ... 169
Table II.6: List of auxiliary input parameters of unit cost (k.xi) and power (n.xi) ... 170
LIST OF ABBREVIATIONS
Ac Required Area for Milling Plant PV Present Value
ADJTIM Adjustment Time DSS Decision Support System Ap Required Area for Soil Dumping Oc Operating Costs
Ars Required Area of Maintenance Shop t Tonne/Tonnes/Metric ton
Ave. Average kcal Kilo Calories
BBOE Billion Barrels of Oil Equivalent Cpcp Cost of Primary Crusher Plant
BTU British Thermal Unit Nat Number of Administrative and Technical
Staffs Cal Calories m3 Cubic Meters
Cc Clearing Costs S.D. Standard Deviation
Cce Communication and Electrical Distribution
Costs
kWh Kilowatt Hour
Cde Drilling Equipment Cost Gcpd General Service Cost Per Day
CFA Cash Flow Analysis q Imputed Interest Cle Cost of Shovel Supplemented Scpd Surface Service Cost
Cpmf Constructing and Equipping Shop Costs At (0) Periodic Amount of The Cash-layout Costs
Crs Fuelling System Costs DCF Discount Cash Flow
Css Soil Stripping Cost Dcpd Drilling Cost Per Day
Cws Waste Stripping Cost Bcpd Blasting Cost Per Day
DSSN Dry Small Steam Nuts Cgc Cost of Gyratory Crushers
EGAT Electricity Generating Authority of Thailand
Aof Administrative Office Area Required
EHIA Environmental Health Impact Assessment S&EP Social and Environmental Protection FV Future Value N/A Not Available
G&A General and Administrative Cof Cost of Office Building
Hec Haulage Equipment Costs t Time
i Discount Rate GWh Gigawatt Hour IPP Independent Power Producers SPP Small Power Producers
IRR Internal Rate of Return Ar Access Road Costs of Milling Plant
J Joules WACC The Weighted Average Cost of Capital kg Kilogram g Gramm
Max. Maximum Gcal Giga Calories
MEP Materials, Expenses, and Power Csh Cost of Maintenance Shop
MFR Mining Fund Rate NCF Net Cash Flow
Min. Minimum US$ United States Dollars ($) MIT Massachusetts Institute of Technology DYNAMO Dynamics Model Software MJ Mega joules kJ Kilojoules
MTOE Million Tonnes of Oil Equivalent s Second
NPV Net Present Value Ccm Clearing Costs of Milling Plant
Construction Ns Number of Shovels Ecpd Electrical Power Cost
Nsv Number of Service Personnel Adc Administration Costs
Nt Number of Trucks AW Expense Parameter
PP Payback Period Cssm Costs of Stripping Soil Overburden
R/P Resources to Production Do Depth of Soil Overburden
Rt Net Cash Flow CLD Causal Loop Diagram
S Optimum Shovel Size Ccpd Primary Crushing Cost
SD System Dynamics Cme Costs of Mass Excavation for Milling Plant
SDM System Dynamics Model A Area of Soil Overburden
St Optimum Truck Size Acpd Administrative and Technical Staff Cost
Sum. Summation CIF Cost, Insurance, and Freight T Milling Rate Csw Cost of Surface Warehouse
Tc Ore Passing the Primary Crusher Rate Ec Engineering Costs
Td Ore/Waste is drilled off per day Lcpd Loading Cost Per Day
To Ore Mining Rate Chc Cost of Mine Changehouse
Tp Total Materials Mined Rate D Total Direct Costs
Tw Waste Mine Rate Cmsf Cost of Miscellaneous Surface Facilities
TOE Tonnes of Oil Equivalent BOE Barrel of Oil Equivalent FGD Flue Gas Desulphurization Equipment bbl Barrel of Oil
/a Per Year, Annual, Yearly SR Stripping Ratio CHV Coal Heating Value DIR Deposit Interest Rate P Coal Price DR Discount Rate
TR Tax Rate UMCC Unit Mine Closure Cost USEC Unit S&EP Cost Dmnl Dimensionless of Unit AB Agent Based DE Discrete Event
1
INTRODUCTION
1.1
Stage of Coal Mining System
Coal is one of the world’s most plentiful energy resources [11], and in 2013, it was estimated that there are roughly 892 Bt reserves around the world, which should be last approximately 113 years, compared with oil and gas which offer 53.3 years and 55.1 years respectively [12]. Therefore, it is today, and will be in the future, the most important global supplier of electricity, both for people and industries. Nowadays, there are still many coal resources around the world, some of which can provide an economic reserve when coal prices increase. Moreover, there are large coal mining industries operating in several countries; the top 10 world coal reserves are shown in Figure 1.1.
Figure 1.1: Top 10 world coal reserves (2008) [1]
Figure 1.2: World energy consumption by sources (1987-2012) [13]
Comparing the hydrocarbon energy resources of the world (2012), coal is a main energy consumption by sources (Figure 1.2) and still has the longest period of availability of energy sources, followed by gas and oil respectively [13], (Figure I.2).
Figure 1.3: Resources to production ratio (R/P ratio) [13]
Coal is the most significant resource for electricity production in the world. The fraction Coal
Natural gas
Oil Million tonnes of oil equivalent (MTOE)
hydropower (14%), nuclear (12%), heavy oil and diesel (10%), and renewable energy (4%) [14], (Figure 1.4).
Figure 1.4: World energy source of electricity [14]
Although current coal mining processes are well managed in some countries by the use of advanced technologies, some environmental impacts are inevitable to the larger area and nearby communities; there are also long term effects of the mine closure period. Possible environmental impacts of mining include; waste water, heavy metal contamination of water and soil, acid mine drainage, soil degradation, noise, and vibrations, etc. [15] (Figure 1.5).
Currently, society is concerned about the environmental problems of mining, this means that mining companies must adhere to stricter rules and try to better control the social and environmental effects and mine closure management [6, 16]. Therefore, coal mining companies must more carefully consider investment in a new coal mining project, than in the past, as there are more associated costs and risks. Moreover, in some countries, mining companies must provide care and recuperation after the mining operation, as part of the mine closure period.
The decision to invest in a coal mining project is a complex system and requires a huge 40% 20% 12% 10% 14% 4% Coal Gas Nuclear
Heavy Oil & Desel Hydro
Renewable
Coal
Gas Hydro
environmental protection must also be considered. It means increasing costs for the mining company to deal with [7].
(a) Acid mine drainage, (b) Water pollution, (c) Soil degradation, and (d) Landscape and land use change Figure 1.5: Environmental impact of mining (example) [6]
Therefore, to understand the complex variables in the coal mining system, mining companies need a tool that can connect every variable, and can calculate or simulate quickly and flexibly, providing many alternative results to support the mining company in the decision making process. This is especially true of Thailand, where the reserves of the Mae Moh Lignite Mine decline every year. It was estimated to cease production 2047 [4], so the investment ideas for new coal mines in Thailand, such as Krabi and Songkhla, must be decided and prepared as quickly as possible.
In this thesis, system dynamics (SD) theory and modelling [17] is used for several complex coal mine systems by converting multiple variables of coal mine planning into a System Dynamics Model (SDM). The Vensim Software is one of the most popular software to develop the SDM. The powerful tools and functions that are included in the Vensim PLE (free version), let the beginning user have a chance to learn the software.
a b
free version, which is needed in this thesis, such as the sensitivity analysis and optimization tools, is chosen. The Vensim DSS version also included the tool to make a user interface and package application, which made it comfortable to publish to other users; the detailed comparisons of the SDM software are shown in the section 2.3 (p. 19). Therefore, propose the development of an application SDM, as a fast and flexible computer application tool to support the decision making, and to help coal mine planning. The structure of the model will cover not only the coal mining period, but also the social and environmental protection, and mine closure. From the results of this model, possible scenarios with both positive and negative impacts of the coal mining system can be identified; thus helping the coal mining industry to make the right decision on their investment. The real data used in the model mainly uses data from the Mae Moh Lignite Mine and older data from the Krabi Lignite Mine in Thailand for validating and simulating the alternatives of re-operation of Krabi Lignite Mine in the future.
1.2
Thailand Coal Mining and Problems
There are 2 general methods of coal mining, (1) surface mining and (2) underground mining. However, coal mining in Thailand is dominated by surface mining, and the biggest operational lignite mine in Thailand is the Mae Moh Lignite Mine, (Figure 1.6).
Usually, surface coal mining entails many activities from prospecting, exploration, and operation, until reclamation after mine closure; thus, it results in a long period for social and environmental impacts, and needs to be well managed. Nowadays, mines in Thailand and many countries are required by the government to rehabilitate the mined area. This means the decision to invest in new coal mines is more complicated and costly as there are more activities to be managed, and a longer required commitment. Coal resources are found in many areas from the north to the south of Thailand, most of them are lignite deposits and small-scale lignite reserves. However, some coal deposits in Thailand hold more than 100 Mt, and as such can be economically operated, examples include Mae Moh reserve, Krabi reserve, and Songkhla reserve [5].
Figure 1.7: The simple process of surface coal mining in Thailand (modified) [18]
At the end of 2012, Thailand had proven reserves of about 1,239 Mt, which can be used for 68 years [13]; and the Mae Moh Lignite Mine is the biggest of these reserves still running. It has economical reserves of 825 Mt, of which 364 Mt has been used and 461 Mt is still remaining (2011) [4]. All of the produced lignite from the Mae Moh Lignite Mine is used for electricity generation, producing around 15-17 Mt/y. It is used to feed
13 electrical generators that have a total capacity of approximately 2,625 MW, and cover about 20% of the electricity demand in Thailand [19].
Electricity in Thailand is mainly produced by gas (65%), which is mainly from domestic sources, 58%, or imported from Myanmar, 42%. It increases the risk of widespread blackouts in Thailand, whenever the pipeline of gas from Myanmar shuts down. Other sources of electricity are coal (20%), hydropower (5%), hydropower from other countries (7%), heavy oil and diesel (1%), and renewable energy (2%) [14], (Figure 1.8), Thailand seems to have a problem with balancing energy sources for electricity production.
Figure 1.8: Sources of electricity in Thailand and the world [14]
The over dependence on gas will have to change, and the requirement of electricity sources must be balanced by reducing the gas demand and increasing the ratio of coal and other sources used in the future. Therefore, when the coal demand of Thailand increases, it affects not only the production rate of coal mining at present, but also the investment in new coal mining projects, as these must include the cost of social and environmental protection and mine closure.
The Ministry of Energy for Thailand has a plan to build a coal-fired power plant, with a 0 10 20 30 40 50 60 70
Coal Gas Nuclear Heavy Oil & Desel
Hydro Renewable
%
World Thailand
countries, such as Indonesia and Australia etc., or (2) using the domestic lignite reserves.
Consequently, a tool to support decision-making based upon complex variables, such as those in coal mining, is very important. This is especially important in Thailand, which seems to have a problem balancing energy sources, and needs to re-balance by increasing coal consumption together with other sources in the future. Also, the domestic coal reserves in Krabi, which could be used for the Krabi Coal Power Plant Project, should be checked for feasibility and suitability.
1.3
Objectives
This thesis has 2 main objectives. Firstly, to develop a system dynamics model of surface coal mine planning to act as a decision making tool, to help understand the behaviour of variables in a surface coal mining system, and to help find the optimum conditions of a coal project.
Secondly, to use the developed decision making tool for an analysis of the situation of coal mining in Thailand, especially concerning the possibility of opening a new coal mine in Krabi to serve the 800 MW Krabi Coal Power Plant Project, and to advise on the future situation of coal mining in Thailand.
1.4
Remarks
As above mentioned, the importances of coal resources are, firstly as the main energy source for electricity in the world, and it holds the second place as a source of other energies [13]. The demand of coal increases every year, despite the limited proven coal reserves. Therefore, coal reserves have to be managed and sustainability of use planned. Thailand seems to have a problem balancing energy sources for electricity generation; gas reserves in Thailand reduce drastically every year due to the high consumption rate, however Thailand’s coal reserves remain. So, when the decision is made to increase coal consumption or to invest in new coal mining, all of the advantages and disadvantages of the mining system should be clear. Then the good management of the
coal mining system should start right away from the moment the decision to invest is made. Hence, in general, the decision support system for coal mine planning is a very useful tool to provide information and clarify understanding of mining projects; it enables good decision making, both globally and for the situation in Thailand.
This thesis aims to develop an alternative decision making tool for solving complex variable problems in coal mine planning. Furthermore, the tool help to understand the relationship of all relevant variables in the coal mining system. The tool is developed by using Vensim DSS Software, which is supported by system dynamics theory and modelling. It is performed and displayed under the various simulated scenarios for optimizing the most suitable planning conditions for the case study of the Krabi Lignite Mine Project in Thailand. Successful development of this tool will lead to better decisions for proper planning and suitable management policy in general coal mining system and also in the Thai coal mining system.
1.5
Thesis Outlines
The next parts of this thesis are organised into the following chapters:
Chapter 2: the literature reviews, focus on reviewing the problem solving methodologies and why choose system dynamic modelling to solve this problem. Then an understanding of system dynamics theory and modelling is made. The software selection is reviewed and analysed for making a system dynamics model of coal mine planning, and also the previous research related to decision support systems in mining or coal mining, are reviewed. Finally, the conclusion of the gap of previous researches and potential to do this thesis, are included in this chapter.
Chapter 3: the research methodology and model development concentrates on the system dynamics methodology to develop the system dynamics model of coal mine planning in this thesis. First, the causal loop diagram of this thesis is made. After that, the system dynamics model of this thesis is proposed in this chapter.
support case study in this thesis. The prototype model is verified by real data of Mae Moh Lignite Mine. After that, decision criteria and sensitivity analysis conditions, also the simulation scenario and optimum funding conditions are discussed and selected for simulating results of case study Krabi Lignite Mine Project.
Chapter 5: The case study simulation results and discussion are proposed. The modelling and simulation result is made. It is one of the core chapters of the research which deals with the case study of Krabi Lignite Mine Project, such as result of sensitivity analysis, the scenario simulation results, the optimum funding results. Finally, the discussion of the case study which including, scenario simulation comparison, electricity price effects, economic value of the project and alternatives, are proposed in this chapter.
Chapter 6: the development of the application interface is presented. The application software is one of the targets of this thesis. First, the application interface is made. Then, the application installation and usage are explained in this chapter.
Chapter 7: the summary and recommendation are presented in this chapter. It is a summary of the big picture of this thesis, and also including some suggestions and ideas for further research, are provided.
Appendix 1: the background information is covered a general information on coal and coal mining, and also providing information on Thailand’s coal resources and coal mining. The information also includes the mining theory, espectically surface mining, mine planning and coal mining; focusing on understanding of parameters in the coal mining system and how they are connected. Moreover, the reviewing theories of an economic analysis and mining cost estimation of the mining project are included.
Appendix 2: additional information tables are presented to support details of parameter boundary and initial value of variables for all scenarios simulations in this thesis.
Appendix 3: the model equations code is proposed.
2
LITERATURE REVIEWS
A method of solving problems is modelling, which the system under study is replaced by a simple object. It uses to describe the real system and/or its behavior [94].
Modelling and simulation is commonly used when conducting experiments on a real system would be impossible or impractical, for example, (1) the high cost of prototyping and testing, (2) the fragility of the system will not support extensive tests, and (3) the duration of the experiment in real time is impractical, etc [94].
2.1
Multi-method Simulation Approach
Solving problems by modelling are based on abstraction, simplification, quantification, and analysis. Each of the different modelling methodologies assumes different levels of each of these factors [93].
Nowadays, there are 3 modelling methodologies used to solve problems, including, (1) System Dynamics (SD) modelling, (2) Discrete Event (DE) modelling, and (3) Agent Based (AB) modelling. The first two methodologies were developed by Jay Forrester in 1950s, and by Geoffrey Gordon in 1960s, respectively. Both methods employ a top-down view of things. Finally, the AB approach, a more recent development, is a bottom-up approach where the modeler focuses on the behavior of the individual objects [93].
The SD method assumes a high abstraction level, a big picture level, and is primarily used for strategic/policy level problems. While the DE model is commonly used for operational and tactical levels, and AB model is flexibly used at all levels, such as competing companies, consumers, projects, ideas, vehicles, pedestrians, or robots. The methodology modelling selection is shown below [93].
When a system is individual data, then use an AB approach.
When a system is complex continuous variables, then use an SD approach.
Therefore, whenever the system or problem is complex variables and continuous changing along the time, SD approach is probably be a first choice to solve the problem.
2.2
System Dynamics Theory and Modelling
2.2.1
Overview
System dynamics is an academic discipline created by Prof. Jay W. Forrester of the Massachusetts Institute of Technology (MIT). System dynamics is originally rooted in the management and engineering sciences, but has gradually developed into a tool useful in the analysis of social, economic, physical, chemical, biological, and ecological systems [55].
System Dynamics [17] is generally used in the field of social science, business, management, economic, and environment [56, 57]. Then, Meadow et al., Is the first team to publish the well-known books that referred to the system dynamics theory by name “Limit to Growth” (1972), “Beyond the Limit” (1993), and “Limits to Growth: The 30-Year Update” (2004) [58]. Even now, the system dynamics theory is applied to use in many fields of research.
System dynamics is a computer-aided approach to policy analysis and design. It applies to dynamic problems arising in complex social, managerial, economic, or ecological systems – literally any dynamic systems characterised by interdependence, mutual interaction, information feedback, and circular causality [59].
The field developed initially from the work of Jay W. Forrester [57]. His seminal book Industrial Dynamics (Forrester, 1961) is still a significant statement of philosophy and methodology in the field. Within 10 years of its publication, the span of applications grew from corporate and industrial problems to include the management of research and development, urban stagnation and decay, commodity cycles, and the dynamics of growth in a finite world. It is now applied in economics, public policy, environmental studies, and theory building in social science, and other areas, as well as its home field, management. The name industrial dynamics no longer does justice to the breadth of the field, so it has become generalised to system dynamics. The modern name suggests
dynamics emerge out of servomechanisms engineering, not general systems theory or cybernetics (Richardson, 1991) [59].
2.2.2
The System Dynamics Approach
In the field of system dynamics, a system is defined as a collection of elements that continually interact over time to form a unified whole. The underlying relationships and connections between the components of a system are called the structure of the system. One familiar example of a system is an ecosystem. The structure of an ecosystem is defined by the interactions between animal populations, birth and death rates, quantities of food, and other variables specific to a particular ecosystem. The structure of the ecosystem includes the variables important in influencing the system [55].
The term dynamics refers to change over time. If something is dynamic, it is constantly changing. A dynamic system is therefore a system in which the variables interact to stimulate changes over time. System dynamics is a methodology used to understand how systems change over time. The way in which the elements or variables composing a system vary over time is referred as the behaviour of the system. In the ecosystem example, the behaviour is described by the dynamics of population growth and decline. The behaviour is due to the influences of food supply, predators, and environment, which are all elements of the system [55].
One feature that is common to all systems is that a system’s structure determines the system’s behaviour. System dynamics links the behaviour of a system to its underlying structure. System dynamics can be used to analyse how the structure of a physical, biological, or literary system can lead to the behaviour that the system exhibits. By defining the structure of an ecosystem, it is possible to use system dynamics analysis to trace out the behaviour over time of the ecosystem based upon its structure [55].
The system dynamics approach involves [59]:
Defining problems dynamically, in terms of graphs over time.
Striving for an endogenous, behavioural view of the significant dynamics of a system, a focus inward on the characteristics of a system that themselves
Thinking of all concepts in the real system as continuous quantities interconnected in loops of information feedback and circular causality.
Identifying independent stocks or accumulations (Levels or Stock) in the system and their inflows and outflows (Rates or Flow).
Formulating a behavioural model capable of reproducing, by itself, the dynamic problem of concern. The model is usually a computer simulation model expressed in nonlinear equations, but is occasionally left un-quantified as a diagram capturing the stock-and-flow/causal feedback structure of the system.
Deriving understandings and applicable policy insights from the resulting model.
Implementing changes resulting from model-based understandings and insights.
2.2.3
SD Modelling and Simulation
Mathematically, the basic structure of a formal system dynamics computer simulation model is a system of coupled, nonlinear, first-order differential equations or integral equations, [59]
d
dtXሺtሻ=f(X, P) (2.1)
where Xis a vector of levels (stocks or state variables),
Pis a set of parameters,
fis a nonlinear vector-valued function.
Simulation of such systems is easily accomplished by partitioning simulated time into discrete intervals of length, (dt), and stepping the system through time, one (dt) at a time. Each state variable is computed from its previous value and its net rate of change x'ሺtሻ: xሺtሻ=x(t-dt)+dt×x'(t-dt). In the earliest simulation language in the field
(DYNAMO), this equation is written with time scripts, K is the current moment, J is the previous moment, and JK is the interval between time J and K: X.K=X.J+[(dt)×(X_rate.JK)], (Richardson and Pugh, 1981). The computation interval “dt” is selected small enough to have no discernible effect on the patterns of dynamic
sophisticated integration schemes are available (although the equation written by the user may look like this simple Euler integration scheme), and time scripts may not be evidenced.
Forrester's original work stressed a continuous approach, but increasingly modern applications of system dynamics contain a mix of discrete differential equations and continuous differential or integral equations. Some users associated with the field of system dynamics work on the mathematics of such structures, study the theory and mechanics of computer simulation, analysis, and simplification of dynamic systems, policy optimization, dynamical systems theory, and complex nonlinear dynamics and deterministic chaos.
The main applied work in the field, however, focuses on understanding the dynamics of complex systems for the purpose of policy analysis and design. The conceptual tools and concepts of the field – including feedback thinking, stocks and flows, the concept of feedback loop dominance, and an endogenous point of view – are as important to the field as its simulation methods.
2.2.4
Feedback Thinking
Conceptually, the feedback concept is at the heart of the system dynamics approach. Diagrams of loops of information feedback and circular causality are tools for conceptualising the structure of a complex system and for communicating model-based insights. Intuitively, a feedback loop exists when information resulting from some action travels through a system and eventually returns in some form to its point of origin, potentially influencing future action. If the tendency in the loop is to reinforce the initial action, the loop is called a positive or reinforcing feedback loop; if the tendency is to oppose the initial action, the loop is called a negative or balancing feedback loop. The sign of the loop is called its polarity. Balancing loops can be variously characterised as goal-seeking, equilibrating, or stabilising processes. They can sometimes generate oscillations, as when a pendulum seeking its equilibrium goal gathers momentum and overshoots it. Reinforcing loops are sources of growth or the
and balancing circular causal feedback processes can generate all manner of dynamic patterns [59].
x
Loop dominance and nonlinearity
The loop concept underlying feedback and circular causality by itself is not enough. However, the explanatory power and insights of feedback understandings also rest on the notions of active structure and loop dominance. Complex systems change over time. A crucial requirement for a powerful view of a dynamic system is the ability of a mental or formal model to change the strengths of influences as conditions change, that is to say, the ability to shift the active or dominant structure [59].
In a system of equations, this ability to shift-loop dominance comes about endogenously from nonlinearities in the system. For example, the S-shaped dynamic behaviour of the classic logistic growth model
ൌǦʹ can be seen as the consequence of a shift in
loop dominance from a positive, self-reinforcing feedback loop (aP) producing exponential-like growth to a negative balancing feedback loop (-bP2) that brings the system to its eventual goal. Only nonlinear models can endogenously alter their active or dominant structure and shift loop dominance. From a feedback perspective, the ability of nonlinearities to generate shifts in loop dominance and capture the shifting nature of reality is the fundamental reason for advocating nonlinear models of social system behaviour [59].
x
The endogenous point of view
The concept of endogenous change is fundamental to the system dynamics approach. It dictates aspects of model formulation: exogenous disturbances are seen at most as triggers of system behaviour, like displacing a pendulum; the causes are contained within the structure of the system itself like the interaction of a pendulum’s position and momentum that produces oscillations. Correct responses are also not modelled as
functions of time, but are dependent on conditions within the system. Time by itself is not seen as a cause [59].
More importantly, theory building and policy analysis are significantly affected by this endogenous perspective. Taking an endogenous view exposes the natural compensating tendencies in social systems that conspire to defeat many policy initiatives. Feedback and circular causality are delayed, devious, and deceptive. For understanding, system dynamics practitioners strive for an endogenous point of view. The effort is to uncover the sources of system behaviour that exist within the structure of the system itself [59].
2.2.5
System Structure
These ideas are captured in Forrester’s (1969) organizing framework for the system structure of SD [59]:
Figure 2.1: Forrester’s organizing framework for the system structure
The closed boundary signals the endogenous point of view. The word closed here does not refer to open and closed systems in the general system sense, but rather refers to the effort to view a system as causally closed. The model’s goal is to assemble a formal structure that can, by itself, without exogenous explanations, reproduce the essential characteristics of a dynamic problem [59].
closed causal boundary. Without causal loops, all variables must trace the sources of their variation ultimately outside a system. Assuming instead that the causes of all significant behaviour in the system are contained within some closed causal boundary forces causal influences to feed back upon themselves, forming causal loops. Feedback loops enable the endogenous point of view and give it structure [59].
x
Levels and rates
Stocks (levels) and the flows (rates) that affect other parameters are essential components of system structure. A map of causal influences and feedback loops is not sufficient to determine the dynamic behaviour of a system. A constant inflow yields a linearly rising stock; a linearly rising inflow yields a stock rising along a parabolic path, and so on. Stocks (accumulations, state variables) are the memory of a dynamic system and are the sources of its disequilibrium and dynamic behaviour [59].
J. W. Forrester (1961) placed the operating policies of a system among its rates (flows), many of which assume the classic structure of a balancing feedback loop striving to take action to reduce the discrepancy between the observed condition of the system and a goal. The simplest rate structure results in an equation of the form [59]:
Netflow=(Goal-Stock)
ADJTIM (2.2)
where ADJTIM is the period of time over which the level adjusts to reach the goal [59].
x
Behaviour is a consequence of system structure
The importance of levels and rates appears clearer, when one takes a continuous view of structure and dynamics. Although a discrete view, focusing on separate events and decisions, is entirely compatible with an endogenous feedback perspective, the system dynamics approach emphasises a continuous view. The continuous view strives to look beyond events to see the dynamic patterns underlying them. Moreover, the continuous
Events and decisions are seen as surface phenomena that ride on an underlying tide of system structure and behaviour. It is that the underlying tide of policy structure and continuous behaviour that is the system dynamicity’s focus [59].
There is thus a distancing inherent in the system dynamics approach – not so close as to be confused with discrete decisions and myriad operational details, but not so far away as to miss the critical elements of policy structure and behaviour. Events are deliberately blurred into dynamic behaviour. Decisions are deliberately blurred into perceived policy structures. Insights into the connections between system structure and dynamic behaviour, which are the goal of the system dynamics approach, come from this particular perspective of distance [59].
2.3
System Dynamics Modelling Software Selection
Nowadays, there are many SDM software in the market. Most of them are softwares those are being developed. A function that supports simulation is limited and there are bugs in the program. The popular SDM softwares are chosen for analysing and make the final decision of the software, which is used in this thesis. The five important current system dynamics simulation softwares are shown in Table 2.1.
Table 2.1: List of system dynamics modelling software (Modified) [60]
Name License Version Last Web site Price* (US$) Remarks
AnyLogic Commercial only
7.0 http://anylogic.com Contact Seller
No free trial version, supports system dynamics, agent based and discrete event modelling DYNAMO Commercial, no
longer distributed commercially
N/A N/A N/A
Powersim
Studio Commercial with a free trial 9.0 http://www.powersim.com 2,457 Express version limited function and free trial 6 months
Stella,
iThink Commercial only 10.0 http://iseesystems.com 2,499 Vensim Commercial
with a free for education and
6.2 http://Vensim.com/ 1,995 PLE version free for educational and personal use
After that, the analytical comparison of the personal opinion of the top five available software types in the field of system dynamics modelling and simulation is shown in Table 2.2.
Table 2.2: The analytical comparison of the top 5 of system dynamics software [60] Criteria Vensim Powersim Stella/iThink DYNAMO AnyLogic
Trial version 5 4 0 0 0
Function support simulation 4 4 4 3 5
Commercial price version 5 4 4 0 0
User interface 4 4 4 1 4
Model structure style 4 5 5 2 4
Popularity 4 5 5 1 3
Continue development 5 5 5 0 5
Total Score 31 31 27 7 21
Note: 5 = Excellent; 4 =Very Good; 3 = Good; 2 = Fair; 1 = Poor; 0 = Not Available
When comparing some of the software for developing system dynamics models, the Powersim software and Vensim software get the top score (Table 2.2). They offered free trial versions, and are free for education and personal licenses. Both software types have the same model structure style. Powersim model structure looks nicer than the Vensim model structure. However, the Powersim software has a limited license period (6 months), limited maximum number of variables in the model, and other functions; where as the Vensim software has no limited license time, no limit on variables in the model, but it is also limited in function. Comparing the price for the top version of each commercial software type, the Vensim software is the cheapest of the system dynamics modelling software, detail is shown in Table 2.1 (p. 19).
At first, Vensim Software free version is chosen for learning. After that, the generic model of this thesis is developed. Finally, the Vensim commercial version is chosen because of function available for supporting the objective of this thesis.
Therefore, the final System Dynamics Software used to develop a system dynamics model in this thesis, is the Vensim DSS Software. This version is the most sophisticated
publishing to other users. The details of how to use the Vensim can be found in the Vensim User Manual [87].
2.4
System Dynamics Model and Decision Making in Mining
System dynamics theory, modelling, and the development of a decision making tool has been applied in the field of mining for a long time. Focusing on mining and coal mining fields, some researchers have used this conceptual theory to solve their problems in the mining fields. This is discussed in this section:
It began with Budzik, et.al., (1976) [61] developing an energy model, called FOSSIL1, by using the system dynamics theory. The purpose of the development was to understand energy balancing, to manage the USA reserves of coal, oil, and gas. Later, model updates of FOSSIL2 and FOSSIL3, etc., were published.
C. Roumpos, et.al., (2004) proposed the development of a decision making model for lignite deposit exploitability. The model was developed in the form of mathematical equations modelling, which included parameters in four sub models, (1) the deposit condition and the mine characteristics, (2) environmental and socioeconomic parameters, (3) competition, and (4) market [7]. The conceptual model of C. Roumpos, et.al., is shown in Figure 2.2.
The C. Roumpos mathematical model result of annual cash flow (Ai) in € is shown in equation (2.3)[7]: ൌ ቈ ȽൈȽ ͳͲͲͲൈ൫ȽǦȽ൯Ǧ ͲǤͺൈȽȽሺ Ƚሻ ȽȽ ൈͳͲሺͳǦሻȽ (2.3)
Where, Pα = Capacity of the power plant (MW), Tα = Operating hour of the power plant (h/y),
Iα = Investment cost for power plant construction (€), Hα = Calorific Value (kcal/m3),
cpα= Production cost in power plant (€/kWh), ceα= Environmental cost (€/t), cf = Fuel
cost (€/m3), k = Construction time (y), N = Depreciation time or project life time (y),
pα= Selling price of electricity (€/kWh), n= Power plant efficiency (%), ε = Discount
rate (%), and t = Tax rate (%).
Fan, et al. (2007) developed a system dynamics base model for coal investment in China. In this paper, a system dynamics model was developed taking the investment in the coal industry, available reserves, mine construction and coal supply capability into account [62].
Figure 2.3: Fan’s flow diagram of coal production and supply [62]
PCsm NPCsm SPCsm Cmc MERS ARS ICGP GPI NARS MRS ERsm MERsm Psm CD ERtv MERtv Ptv Ism ICmw ERS
where:
ARS Available reserves for constructing mines MERsm Mining-employed reserves by stale-owned mines
CD Coal demand MRS Mining reserves
Cmc Coefficient of mine construction MERtv Mining-employed reserves by town or village mines ERS Explored reserves NARS New available reserves for mine construction ERsm Extraction in state-owned mines NPCsm New production capacity of state-owned mines ERtv Extraction in town or village owned mines PCcm Production capacity of constructing mines GPI Geological prospecting investment PCnsp Production capacity of newly started project ICGP Investment coefficient in geological prospecting PCsm Production capacity of state-owned mines ICmw Investment coefficient of mining and washing of coal Psm Production of state-owned mine
Ism Investment in state-owned mine construction Ptv Production of town or village owned mines MERS Mining-employed reserves SPCsm Scrapped production capacity of state-owned mines
The results of Fan’s research showed many scenarios. The simulation of the model helped to find the economic scenario, where the available reserves would approximately reach 8.6 Bt/y, to meet the requirements of China’s expectation.
Caselles-Moncho, et al. (2006) studied the dynamic simulation model of a coal thermo-electric plant with a flue gas desulphurization system (FGD). This research developed a dynamic simulation model that had been used to present the likely responses of the electricity industries’ latest perturbations such as changes in environmental regulations, international fuel market evolution, restriction on fuel supply and increase on fuel prices, liberalisation of the European Electricity Market, and the results of applying energy policies and official tools such as taxes and emission allowances [63].
The results of Caselles-Moncho’s research showed the optimal strategy, including: (a) minimum energy production (b) specific net consumption of 2,207,000 t/GWh (the consumption curve means), (c) theoretical participation of the different fuels, (d) desulphurization running at 100% and (e) minimum commercialization of ashes, scoria, and gypsum [63].
O’Regan et al. (2001) from Ireland, published a paper about an insight into the system dynamics method: a case study in the dynamics of international minerals investment. This research presented an explanation of the system dynamics method. The aim of the model was to examine how environmental policy affects the investment and development decisions of the mining industry within the broader context of government minerals policy [64].
Figure 2.5: Principle of the O’Regan model diagram [64]
In summary, the O’Regan’s model aimed to encapsulate best practice in the field of system dynamics. It emphasised the difference between actual and perceived conditions
Investment in Exploration Discoveries Mining Activity Economics Viability of Marginal Deposits Clean Technology Investment in R&D Enviromental Legislation Public Satisfaction S S S S O S S S O O O R1 B1 B2 R2
as a basis for action. It made explicit the underlying assumptions as a basis for further expansion. It highlighted system structure as a catalyst for change. It did not by itself provide objective answers. Instead, it was a learning device and an aid to understanding. It was not a replacement for analytical thinking, but rather complementary to it [64]. Therefore, the decision support system of coal mine planning by using system dynamics model is a new and efficient tool to support making a decision on complex variables of new coal mining project. It can be fulfilled objectives of this thesis, which included the additional cost of social and environmental protection cost and mine closure cost. The system dynamics modelling is the most suitable methodology in this purposed because it can deal with:
complex relationship of variables,
flexibility of changing value of input variables,
fast and no limit of calculation in a long period of mining project, and
easy to find sensitivity of variables and optimum solutions.
After reviewed and analysed, Vensim DSS software is chosen to develop the model because it has a free version for beginner to learn and the commercial version covers all functions that need to use in this thesis. Finally, it is also be the cheapest one of the popular software in this field.
2.5
Chapter Conclusion
The literature review of this thesis starts with the background information in Appendix 1 (p. 124), and it gives ideas to develop this thesis.
The mining cost estimation technique by O'Hara (1980), referred to in Hustrulid, et.al, (1998, 2006) [43, 44] is mainly used in this thesis. This technique is also used or developed in many other works. It proposed the mining cost estimation in the form of
prospecting and exploration cost, mine closure cost, and also a part of social and environmental protection cost. The use of O’Hara’s cost estimation, which is mainly used for mining cost estimation in this thesis, is also confirmed in initial mining projects by M. Osanloo, et.al. (2004) [86]. It is noticed that the O’Hara’s technique normally gave a higher estimated result when compared with the real result.
The economic decision in business, especially in mining, still popularly uses multiple criteria like Net Cash Flow (NCF), Net Present Value (NPV), Internal Rate of Return (IRR), Payback Period (PP), Cash Flow Analysis (CFA), etc [9-10, 51, 79, 85]. Furthermore, NPV is a main criterion for decision making on investment and project planning. Therefore, the “NPV Balance” is the summation of the mining fund and NPV, and is the final economic criteria for accepting or rejecting a coal mining project.
The review of the literature also found some research in mining and coal mining that used the concept and theory of system dynamics, such as Caselles-Moncho, et.al.’s research (2006) [63], which used economic decision criteria as Cash Flow Analysis (CFA) and developed a system dynamics model of coal-gas power plant management in Spain. Moreover, the research of Fan, et.al. (2007) [62], also developed a system dynamics model of coal mining investment in China, which looked for suitable strategy and policy control of coal mining in China.
Furthermore, some research focused on the decision making tool in lignite deposit like C. Roumpos (2004) [7], which also gave the idea and some important parameters for developing the SDM of this thesis. The idea of social and environmental protection and post-mining management and evaluation should be the responsibility of a mining company, is shared by many researchers, such as C. Drebenstedt, et.al. (2004, 2006, 2010, and 2011) [6, 16, 40, 53-54], L. Wilde (2007) [46], A. H. Watson (2006) [45], and A. Peralta-Romero and K. Dagdelen (2007) [47], etc. This literature review also proposed the idea that environmental protection costs are always cheaper than the costs associated with the correction of environmental problem when they arise.
Therefore, the gap in previous researches can be filled by the development of system dynamics model as a decision support system of coal mine planning in this thesis.
3
RESEARCH METHODOLOGY AND MODEL DEVELOPMENT
3.1
Research Approach
Research approach starts with the development of SD model. The boundary of this SD model development is supported by mining cost equations, economic equations, and others, which explained in Appendix 1: Background Information (p. 124). The system dynamics theory and modelling and Vensim Software (Chapter 2) are used to develop SDM of coal mine planning. First, the causal loop diagram, and then system dynamics model, are developed in this part, see details in Section 3.2.1 and Section 3.2.2.
After the prototype model is made, the step of analyse variables in the case study of Krabi Lignite Mine is made, see details in Chapter 4 (p. 46). The variables are separated into 3 groups, (1) mining variables (p. 46), (2) economic decision variables (p. 51), and (3) exogenous variables (p. 52).
After that, the model is verified in 4 steps, including, (1) logical checking (p. 60), (2) model structure checking (p. 60), (3) model unit checking (p. 61), and (4) compared calculation result with real data (p. 61). When the model passed step of model verification, it goes to the simulation conditions setup (p. 66). After that, the decision support system of coal mine planning model is used to simulate the case study result, see in chapter 5 (p. 70) and develop the application interface, see chapter 6 (p. 105). The simulation results of Krabi Lignite Mine Project are included, (1) sensitivity analysis results (p. 70), (2) scenario simulation results (p. 81), and (3) optimum funding result (p. 91). Then, it comes to the discussion of Krabi Lignite Mine Project in the big picture with Krabi Coal Power Plant is shown in Section 5.2 (p. 94).
Moreover, to support general end users, the application interface for the model is developed. It helps much to reduce the confusing how to use the model. The application interface result is shown in Section 6.1 (p. 106), and then the application installation and usage is done, see in Section 6.2 (p. 114).
Finally, the summary of this research and recommendation for future research development is proposed in Chapter 7 (p. 116).
3.2
Develop SD Model
3.2.1
Causal Loop Diagram
The basis of system dynamics model development is the analysis of the causal loop diagram (CLD). The principle concept of the mine planning system for this thesis is shown in Figure 3.2.
(R – Reinforcing loop; B – Balancing loop; + is positive effect; - is negative effect) Figure 3.2: Causal loop diagram of mine planning system
After the principle concept is made into a CLD, the analytical detail of variables is developed for understanding the economic parameter connections and the present condition of the project planning. The conceptual diagram for project planning is shown in Figure 3.3.
Figure 3.3: The conceptual diagram for mine planning decision (Narrow Sense)
Because of the recent importance placed on social and environmental problems caused by mining and mine closure, the newly modified conceptual diagram (Wider Sense) for mine planning is made, (Figure 3.4).
The concept of social and environmental protection (S&EP) cost could be anything to protect the community nearby mining from effects of mine, which are affected directly. In addition, it should make the better quality of life of the community, such as, health care insurance, scholarships, public infrastructure, etc. The mine closure cost is also important because after the end of mine operation many mining tries to stop every activity and do not have mine closure period because it is costly without income.
Therefore, a solution which would be a key to sustainability of mining and social and community nearby is mining fund. The mining fund should be managed by the committee, which including mining company, community, government, etc. It is a better guarantee to protect the environment and quality of life after the end of mining,
3.2.2
System Dynamics Model
x
Boundary of Parameters in the Model Development
Parameters in the model can be arranged in many ways as mentioned in the section 2.2.5 (p. 17), but in this case, the parameters are arranged into two groups:
Input parameters
The input parameters are, in other words, exogenous parameters. These parameters are not influenced by any other parameters in the model, but are controlled by the source of data and information outside of the model boundary. The user can change the value of each input parameter freely, to see the effect of the output parameters. The input parameters can be divided into two groups, (1) the main input parameters and (2) the auxiliary input parameters.
There are 48 main input parameters. There are highlighted in the bold text style for some important input parameters, which are used to simulate scenarios in the model. The list of the input parameters is shown on the Table II.4 (p. 169).
Generally, the auxiliary input parameters, of which there are two groups, support model calculation. The first group is the unit converter; these do not have to change value because the value is specific for converting units. The list of auxiliary input parameters for unit conversion is shown on the Table II.5 (p. 169).
The second group of the auxiliary input parameters is the group for unit cost estimation (k.xi) and the powers for the pattern graph (n.xi), which have a certain number of values from the theory of cost estimation by O'Hara (1980) [43, 44]. However, the value of these auxiliary input parameters can be adjusted, if the users know the unit cost specific to their own mine. A list of auxiliary input parameters for the unit cost estimation (k.xi) and the powers for the pattern graph (n.xi) is shown on the Table II.6 (p. 170).
Output parameters
The output parameters are endogenous parameters. These parameters are always influenced by others parameters in the model, or in some cases by the end point parameter of the model. There are 138 output parameters that are calculated by the model. The main output parameters are highlighted in the bold text style. The list of output parameters is shown on the Table II.7 (p. 170).
x
SD Model Structure
Introduction
The developed result of the system dynamics model structure of the decision support system of coal mine planning can be separated into six sub-model including:
Mining System
Economic Decision
Total Cost and Worker Estimation
Operating Cost Estimation
Capital Cost Estimation
Power Plant Economic Value
All sub-models are connected by other parameters such as, mining production rate, operating cost, and capital cost, etc. The SDM equations are shown in Appendix 3: Model Equations Code (p. 173).
Model structure of mining system
The mining system sub-model structure began with the stock or amount of coal reserves; this may refer to potential reserves or economical reserves from the geological analysis of the ore body. In this development, the coal production rate directly affected
![Figure 1.7: The simple process of surface coal mining in Thailand (modified) [18]](https://thumb-us.123doks.com/thumbv2/123dok_us/10919823.2980943/20.892.118.753.439.823/figure-simple-process-surface-coal-mining-thailand-modified.webp)
![Table 2.2: The analytical comparison of the top 5 of system dynamics software [60]](https://thumb-us.123doks.com/thumbv2/123dok_us/10919823.2980943/34.892.100.758.291.511/table-analytical-comparison-dynamics-software.webp)

![Figure 4.2: Coal Production in Thailand (1987-2012) (Revised) [66, 67]](https://thumb-us.123doks.com/thumbv2/123dok_us/10919823.2980943/59.892.166.777.118.452/figure-coal-production-thailand-revised.webp)
![Table 4.6: Mechanical properties of coal and overburden in Mae Moh Mine [69]](https://thumb-us.123doks.com/thumbv2/123dok_us/10919823.2980943/78.892.101.754.137.305/table-mechanical-properties-coal-overburden-mae-moh.webp)