Autonomous Fault Detection for Performance Bugs in
Component-Based Robotic Systems
Johannes Wienke
1and Sebastian Wrede
1Abstract— We present a novel fault detection method for application in component-based robotic systems. In contrast to existing work, our method specifically addresses faults in the software system of the robot using a data-driven methodology which exploits the inter-process communication of the system. This enables an application of the approach without expert knowledge or availability of complex software models. We specifically focus on performance bugs, which slowly degrade the performance of the system and are thereby harder to detect but also most valuable for automatic recovery. Using a data set recorded on a RoboCup@Home platform we demonstrate the performance and applicability of our method and analyze the types of faults that can be detected by the method.
I. INTRODUCTION
Despite the existence of many advanced techniques for preventing software failures in the first place (e.g. testing, model-based engineering, simulation, development work-flows, code reviews), robotic systems still contain bugs and therefore sometimes fail to accomplish their intended missions. Reasons for this are manifold, but specifically include the complexity of current robotic systems as well as the very open nature of interactions with the environment, especially in case of human-robot interaction (HRI). Due to this high complexity, high potential for implementation errors exists and these errors might even not be easily detectable by the aforementioned techniques, as some of these techniques are usually hard or even impossible to apply due to the interaction of the robot with the world. Thus, current robotics systems frequently contain failures [1].
As a consequence, aside from classical engineering meth-ods to ensure proper software quality, an important aspect to improve the stability of current robotic systems is the detection of faults, which inevitably happen at runtime. Detecting such faults allows to react to them in a proper way, potentially with a successful repair strategy [1], [2]. The need to detect and handle faults at runtime becomes even more important in robotics with the recent advances in physical human-robot interaction in industrial settings, where any fault can result in serious injuries, even at the development stage. Autonomousfault detection and isolation (FDI) methods which promise to detect faults at runtime are adopted in several technical disciplines that require stable system operation, but so far only very limited usage can be observed in robotics. Reasons include the constant development in robotics, which prevents the use of static and hard to maintain fault detection methods during the
1 Research Institute for Cognition and Robotics (CoR-Lab), Bielefeld
University, Germany
{jwienke,swrede}@techfak.uni-bielefeld.de
constant system evolution, as well as the general availability of suitable and general-purpose models. While considerable research on specific areas like sensor or actuator faults exists (cf. [3], [4]), failures in the control software have largely been ignored so far, despite being equally important (cf. [1]). Finally, especially in research, many different kinds of robotic platforms are constantly being constructed. There-fore, solutions for specific fault detection problems on one platform are often hardly transferable to other platforms without in-depth knowledge on the algorithms. Consequently, more general-purpose methods are required to foster the application of FDI techniques for non-expert users.
In the following we present a novel and general-purpose method for fault detection in robotics which addresses the aforementioned challenges. Our method specifically ad-dresses the software control system of the robot and can be applied without expert knowledge. It is a data-driven method using machine-learning techniques which can be retrained for novel systems with a reasonable amount of work.
II. TARGET SYSTEMS & ASSUMPTIONS Our fault detection method specifically addresses im-plementation errors in the robot’s control system. Since requiring a complete model of the software system for the fault detection method to function would contradict an easily applicable method, we need a proxy to assess the state of the system. For this purpose we assume the robot to be implemented as a distributed system using a component-based middlware which uses inter-process communication like ROS [5] or our own middleware RSB [6], which should be fulfilled for many research systems. Given this fact, we assume that the inter-process communication of the system components is a sufficient proxy to assess the state of the system. This assumption has already been verified by Golombek et al. [7], but not with a focus on individual components. Our method extends on this and models these components, which allows to better isolate faults.
In order to be applicable at runtime, the middleware must support introspecting the communication of individual components at runtime, ideally with a low runtime overhead, which is possible for most modern middlewares. Addition-ally, information about the existing components of the system and their communication channels should be provided, if a manual specification shall be prevented.
With respect to the kinds of faults we want to detect, we specifically focus on performance-related issues, as defined by Application Performance Management [8]. Such faults do not immediately render the system unusable, e.g. through
crashing important components, but instead slowly degrade its perceived or computational performance and often only occur on special inputs. Hence, they are much harder to detect and easily missed during short testing cycles in active development work [9]. Also, these non-catastrophic issues have a higher potential for being recovered at runtime and therefore are the most valuable ones to detect with FDI methods. Consequently, we need a way to continu-ously assess the computational resource demands of system components and therefore assume that target systems are equipped with a monitoring system which uncovers the process resource demands. Many of these systems exist for server monitoring (e.g. munin1 or Nagios2), but they are often operating at lower temporal resolutions than required for fast robotics operations. Monajjemi et al. [10] provide an example for a monitoring system specifically tailored to robotics. This monitoring system, however, currently lacks the ability to expose the acquired performance counters back to the middleware, which would provide an easy integration path for the fault detection approach at runtime. For this reason and our own use of a different middleware, we have implemented our own monitoring system, which provides even more detailed performance counters from the Linux
proc filesystem for each component via the middleware. Implementing a comparable solution for other systems is an achievable task and should therefore not limit the applicabil-ity of our proposed fault detection method.
Generally, we agree with and target the requirements on monitoring systems introduced in Khalastchi et al. [11], which state that these systems must be computationally light to prevent modifications and further failures in the system, must have a low false-positive rate and they should be able to detect context failures. These are failures that manifest in measurements which would be normal in a certain state, but are faulty in another one. Comparable requirements have also been proposed by Steinbauer and Wotawa [12] and we agree with these.
Summing up, our method needs a distributed system, where the component communication can be introspected at runtime and where performance counters for each component are provided at a reasonable resolution (e.g.1 Hz).
III. METHOD
Our proposed fault detection method is based on the idea that given the inter-process communication of a system component, an expectation on the resource demand of that component at each moment in time can be learned. If the current resource demands of the component deviate from the learned expected value, the component is assumed to be in a faulty state.
We train a model for all components of the system based on reference executions [13] which are classified by an expert user to be successful and therefore are assumed to be free of failures. This method does not prevent the training data from
1http://munin-monitoring.org/ 2https://www.nagios.org/
COMPONENT MONITOR
Event Seq Counters
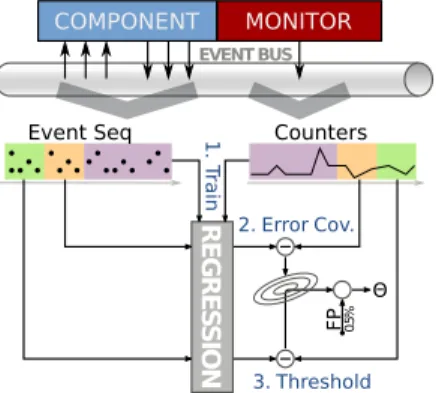
R E G R E S S IO N 1. T rain FP 0.5% Θ 2. Error Cov. 3. Threshold EVENT BUS
Fig. 1. Structural overview of the training of our approach. Colored region in the event and performance counter series indicate the different partitions of the training data used in sequential training steps.
containing samples of a system containing errors in the first place, but their manifestation as failures3 is less likely since
the expert user of the system should be capable to validate the delivered service. This assumption is used by several other publications in this area, e.g. Golombeket al. [7] and Jianget al. [15]. Moreover, suitable modeling methods are able to deal with a certain amount of falsely labeled items in the training data [16].
Given the training data generated this way we have to deal with a one-class classification or novelty detection problem, which we address with a residual-based fault detec-tion approach (cf. Ding [17]). Figure 1 visualizes the basic steps which are performed to generate a model for a sin-gle component. After acquiring the relevant communication events or messages4 for the target component as well as the
performance counter time series from the reference execu-tions of the system (upper part of Figure 1), a regression model is trained which predicts the various performance counters based on encoded communication events (step 1 in Figure 1). In a second step, the error of this model is calculated and an empirical covariance matrix is calculated which characterizes the ability of the regression to predict the different performance counters. Based on this covariance, the Mahalanobis distances is used to compute a threshold on the regression error which ensures a desired false-positive rate on the training data (step 3 in Figure 1). In case a novel observation results in an error higher than this threshold, the component is classified as being in a faulty state at that moment in time. The training of the regression and the estimation of the threshold are performed in batch on the training data.
The aims of this procedure are the following. First of all, no special training data or system models are required to build a fault detector for a component. Only a few reference executions of the system are necessary, which ensures that it is easy to apply the method in new or constantly changing 3A failure being the visible manifestation of an implementation error on the delivered service of a system as defined by Laprie [14].
4For brevity, we will call any kind of acquired inter-process communica-tion artifact an event even if it does not originate from a strictly event-based middleware.
systems. As we train a fault detector for each component of the system, fault isolation in terms of the affected com-ponents for a fault is possible, which improves the ability to handle and debug occurring faults. Finally, training the fault detector for a specific false-positive rate provides a configuration option which shall ensure that detection results are not ignored due to excessive false positive rates.
In the following subsections we will outline the required steps to build up and apply a fault detector for a component. A. Feature Generation
We assume that for a system component c := {S} we know the complete set of communication channels S := {s1, . . . sc} (e.g. topics for ROS) the component commu-nicates on, where S := Si ∪So denotes the union of the component’s input channelsSi and output channels So. For each execution of the system, we acquire a timeseries with the performance counters for that component, which is
P :={pt:t∈T} (1)
wherept∈Rnis the vector of performance counter at timet
andT is the set of timestamps for the measurements, which is assumed to have equidistant spacing, 1 Hz in our case. Additionally, for each communication channel sn ∈ S we have acquired a time series with the communication events that occurred, which is defined as
Es:={m(rt) :t∈Ts} (2) where Ts is of no specified frequency due to the undeter-mined nature of component communications, and
m(rt) :R 7→Rn :=et (3) is an encoding function which converts each structured communication events from the set of raw events R into a vector.Rdepends on the communication middleware and therefore the encoding function m(rt) needs to be defined for each middleware. Since our method should be reusable across different systems, we use a generic encoding function, which can convert any RSB communication event to a numeric representation, however, it would also be possible to implement functions which are specifically tailored to a certain robot system. Therefore we use the following RSB-specific encoding function:
mrsb(rrsb) :=
Size of event cause vector Size of event payload Size of user info vector
(4)
This function converts all countable user-defined entries in an RSB event as well as the size of the binary payload into a vector.
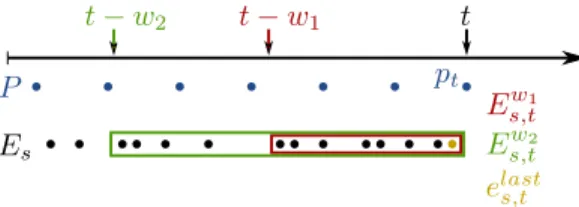
Since the event series Es are not synchronized with the counters P, a synchronization is required. To create fault detection results at a constant rate, we have decided to reuse the timing T of the performance counters P for this purpose and therefore the events need to be conformed to
Fig. 2. Visualization of the feature generation and synchronization approach for a single scopeswith two temporal windowsw1(red) andw2(green).
Features are computed for the performance counters (blue)pt at timet.
Rectangular regions indicate the events inside the respective window and the yellow event instance is the most recent one occurring beforet.
this frequency. For each communication channel s∈ S we generate a new multi-dimensional feature time series
Fs:={fts:t∈T} (5) where eachfs
t is computed at the timestamps of the perfor-mance counter time series and has the following structure:
fts:= mean(Ew1 s,t) count(Ew1 s,t) .. . mean(Ewn s,t) count(Ewn s,t) elast s,t (6)
whereW :={w1. . . wn} are several temporal windows of length wi ∈R. Inside each of these windows, Es,twi are all events on communication channel s which are inside the window starting from timestampt and going backwards in time untilt−wi, thereby fulfilling:
Ewi
s,t:={e
s
µ∈Es:µ∈(t−wi, t]} (7)
meancomputes the element-wise mean of all event instances in Ewi
s,t and count the number of instances. Finally, elasts,t , indicates the most recent event in Es that occurred before timestamp t. Figure 2 visualizes this approach. In order to create the complete feature vector for a component, the individual channel feature vectorsfs
t are stacked to form:
F :={ft:t∈T} (8) ft:= fs1 t .. . fsc t (9)
Since it might happen that not all theoretically available communication channels are actually used in a system, they are ignored when stacking the complete feature vector.
This way of modeling the feature vector was chosen to include information about the temporal structure of the com-munication already inside the feature vector, which enables us to use models that otherwise have no specific temporal representation. We have used temporal windows of length 2.5 s and 6 s in our own experiments, which have been empirically chosen to match expected communication fre-quencies for major components in our system.elast
s,t has been added to the feature vector in order to provide information
in case communication on a scope is less frequent than the longest temporal window. Finally, we explicitly include also the outgoing communication channelsSoof a component in order to have a proxy for the internal state of that component, since not all components are stateless and purely input-driven.
B. Regression
The described feature generation approach is applied to the data collected during the reference executions of the system, resulting in several encoded time series of features and their associated performance counters. These series are concatenated to form a single set of training inputs. This set is split into 3 partitions (colored backgrounds in Figure 1). Since the temporal structure is encoded in each feature vector, random permutations with fixed size can be used here. With the first partition of the training data we train a regression model to predict the performance counters based on the features, which we define as follows:
r(ft) :F 7→P (10)
After scaling the features to zero mean and unit variance, we have received the best performance in terms of detection results as well as training speed with a multi task imple-mentation of the Elastic Net regression method [18], which is well suited for our case with potentially high feature dimensionality and correlated regression targets.
C. Threshold Estimation
Based on the trained regression model, the classification idea is to compare the predicted resource usage with the actually consumed resources of the analyzed system compo-nent and to define the compocompo-nent’s state as faulty in case the deviation exceeds a threshold. As we are only training from non-faulty examples, defining a suitable threshold cannot be performed in terms of actual classification performance. Therefore, we define the threshold so that a desired false-positive rate on an independent partition of the training data is reached.
In order to define this threshold, we need a suitable distance metric. As we have observed that the regression performance for certain performance counters is worse than for others, we use the remaining partition of the training data to first estimate a covariance matrix for the regression errors (step 2 in Figure 1). Based on this covariance, we can compute the threshold using the Mahalanobis distance
d(pt, p0t) :P×P 7→R≥0 (11)
where p0t indicates the predicted counters. This procedure ensures that performance counters, which are harder to predict, have less impact on the classification than the ones with higher certainty. We use a gradient descent method to compute the final threshold Θ (step 3 in Figure 1), which will always find the optimal threshold due to the strictly monotonic nature of the error function.
D. Classification
For the online fault detection the procedure is then straight forward. For the encoded features we first predict the ex-pected performance counters, then compute the distance to the measured counters and compare the results with the threshold, resulting in the following decision function:
f aulty(ft) :=d(pt, r(ft))>Θ (12) IV. EVALUATION
In order to validate our approach we have evaluated it on a previously published data set [19] for evaluating fault detection approaches in component-based robotic systems. Up to our knowledge, no suitable data set with the targeted fault categories, event data, performance counters and accu-rate ground truth existed before, which made it necessary to recored a new one. In this data set, a mobile robot platform performs a modified version of the restaurant task from the RoboCup@Home competition 2015 [20]. Here, an operator first guides the robot around a room, demonstrating locations of drinks and tables and afterwards the robot detects guests, takes their orders and serves the drinks using its manipulator. During executing of the system different non-catastrophic performance-related faults have been triggered. These faults range from resource leaks and skippable computations up to algorithmic errors and issues with the communication middleware. They are scheduled in consecutive time slices for each recording trial. Each slice contains one scheduled fault that might affect multiple components. The data set contains the complete event communication of the robot, ground truth information about the induced faults and de-tailed performance counters for each component. It consists of10fault-free runs of the system and33runs with induces faults. For further details, please refer to Wienkeet al.[19]. We have trained a fault detection model for all components of the system which communicate via RSB based on the 10 fault-free trials of the corpus. In order to compare the performance of our model on the data set, we have additionally implemented a One-Class-SVM (OCSVM) [21] as a standard novelty detection method. The OCSVM detects outliers based on the joint space of features and counters, such that the feature vectors for the OCSVM are:
ftOCSV M:= ft pt (13) We used aν-SVM-based model which has been parameter-ized to achieve the same false-positive rate on the training data as our own model via theν parameter (0.5 %). Finally, we compare our results to a random decision with 50 % chance to classify a data point as being faulty as the absolute baseline. From training we would not have any information on the distribution of the two detection results and therefore using a uniform distribution is the only reasonable decision. For the evaluation, we have decided to use theFβ score as the target metric withβ= 0.1to reflect the fact that a fault detection system with a high false-positive rate will most likely be ignored soon (cf. [11]). With this metric, all com-ponents in all test trials of the data set have been classified
TABLE I EVALUATION RESULTS
F0.1 false-positive rate detection rate AUC
our model 0.521 0.011 0.446 0.650 OCSVM 0.185 0.053 0.229 0.626 random 0.133 0.503 1.000 0.500
at the 1 Hz rate and the resulting boolean time series have been combined and the scores have been computed. Table I shows the results.
Our model reaches by far the bestF0.1score and
addition-ally maintains a false-positive rate close to the intended one. The OCSVM, in contrast, ends up with an approximately 10 times higher false-positive rate as specified for the training. Finally, the detection rate indicates, for how many of the fault instances included in the data set the fault detector indicated a fault at least once within the80 sof fault activity. Of course, the random choice at the 1 Hz pace will very likely detect each fault instance but at the cost of a very high false-positive rate. The OCSVM, despite having a higher false positive rate, still detects only half of the amount of fault instances that our model detects.
In order to generalize these statement, we have also computed ROC curves and calculated the area under the curve (AUC) for the different models. Figure 3 visualizes the curves, which are the micro-averages across all component results. Also across parameter ranges, our model outperforms the OCSVM. Summing up, our model detects more fault instances while maintaining a lower false-positive rate and generally has a better performance across parameters.
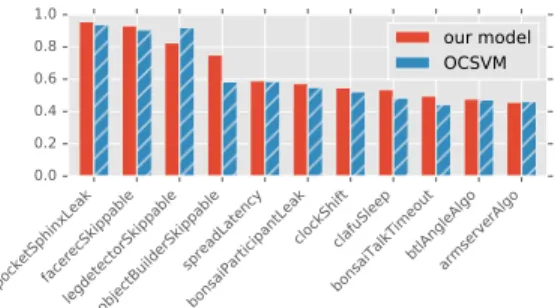
To analyze the general approach of using the generically encoded event communication as well as the performance counters to detect system faults, we have further calculated the AUC metric for each kind of fault included in the data set. For this purpose, for each fault type the individual time slices containing this fault have been isolated for all affected components and the AUC has been computed for all combi-nations of faults and affected components. Figure 4 visualizes the average AUC per fault for both classification approaches. It is visible that most faults that directly influence one of the performance counters (leaks and skippable computations) can be detected well by the approach, whereas other faults
0.0 0.2 0.4 0.6 0.8 1.0
False positive rate 0.0 0.2 0.4 0.6 0.8 1.0
True positive rate
our model OCSVM random
Fig. 3. ROC curves as micro-averages across components.
pocketSphinxLeakfacerecSkippable legdetectorSkippableobjectBuilderSkippable spreadLatency bonsaiParticipantLeak clockShiftclafuSleep bonsaiTalkTimeout btlAngleAlgo armserverAlgo 0.0 0.2 0.4 0.6 0.8 1.0 our model OCSVM
Fig. 4. The AUC scores for each fault kind contained in the evaluation data set. Results have been averaged in case a fault affected multiple components. For details about the individual faults please refer to Wienkeet al.[19].
contained in the data set, which manifest themselves in changed data inside the communication events or in the timing of sparse events are less likely to be detected correctly by the approach. One exception from this general assessment is thespreadLatencybug, which adds periodic latencies to the middleware communication of the whole system. When further analyzing the performance for classifying this fault type for the individual components it becomes visible that the classification is especially successful in case the components use a periodic communication pattern with frequent events. Otherwise, the latencies are not visible to the approach as simply no events have been communicated while the communication was delayed. This further highlights that challenging nature of the evaluation data set.
V. RELATED APPROACHES
Fault detection or more general novelty or anomaly de-tection has a long tradition in several domains and many techniques have been developed. Chandola et al. [16] and Miljkovi [22] present good overviews about these techniques, their categorization and application domains.
With respect to robotics, there has been ongoing research on suitable fault detection approaches and different directions exist. Pettersson [3] gives a good overview on early research for fault detection in robotics and distinguishes between an-alytical, data-driven and knowledge-based approaches. Some of the data-driven approaches mentioned there are using regression, however, often to learn pre-defined classes of failure states. Also, no method specifically focuses on faults in the control system.
A method that focuses on this part of robotic systems has been presented in different development stages by Zamanet al.[2], Weber and Wotawa [23], and Kleineret al.[24]. The fault detection mechanism is based on observers which either check invariants in the communication or encode metrics as Horn clauses. Observers are either manually designed, or derived automatically from reference executions in case of invariant checks. Due to the strict nature of the invariants, imperfect training data will likely affect the detected invari-ants and decrease the performance. Based on the observer results, a diagnosis engine searches for contradictions of the current state with a pre-defined model of the system, thereby requiring a manual modeling of the system behavior.
Khalastchiet al.[11], in contrast, introduce an online fault detection approach which is purely data-driven and based on a sliding window approach to compare current measurements against the previous ones. It does not specifically address performance bugs and is mostly evaluated on sensor or hardware faults. As this method only compares the current data against a recent history, sudden changes in observed variables will likely be misclassified as anomalies, even if they are valid due to a change in the control system’s state. Such changes can often be observed for performance counters, e.g. for on-demand processing components.
A recent approach that uses the communication of the system to assess its state is proposed by Jiang et al. [15]. Here, invariants in the communication are learned based on templates and reference executions of the system. The authors demonstrate the ability of the approach to detect and correct violations which mostly originate from external disturbances of the expected environment of a UAV (e.g. increased wind speed). The approach does not specifically address issues in the control software and detected failures cannot be attributed to certain system components.
Finally, Golombek et al. [7] describe a fault detection method which also utilizes the communication of the robot to assess the system state and which is able to detect performance-related faults. However, only the complete sys-tem is inspected and no detailed information about the affected components is provided.
Finding anomalies in the consumption of resources is also an issue in domains like server administration or cluster computing. Since the variations in resource demand are often more stable than in robotics, many solutions here use time-series processing methods without incorporating contexts like event streams. One noteworthy exception is Knorn and Leith [25], where in addition to a base model of the resource usage, an additive event model exists that adds resource consumption patterns for pre-trained events. These event models need to be recorded beforehand, which prohibits the easy application of the approach in the robotics domain, with many state changes and events that need to be modeled.
Summing up, the combination of addressing faults in the robot’s software system with isolation of individual components based on a data-driven method, which does not require complex modeling is a unique property of our method and makes it applicable to a wide range of platforms. The exploitation of communication events to predict resource consumptions is a unique approach that has not been ad-dressed in a suitable manner for the robotics domain.
VI. CONCLUSIONS & OUTLOOK
We have introduced a novel method to detect performance-related faults in component-based robotic systems. The method successfully uses the middleware communication of each component to assess its state, which verifies our initially stated hypothesis. With this method we were able to outperform standard anomaly detection methods on a challenging benchmark of a mobile robot system. We have specifically taken care that the method is easily applicable to
a broad range of robotic systems without requiring in depth expert knowledge and that it results in a low false-positive rate to ensure that the system will be used by developers and operators. Moreover, we have extended the scope of existing data-driven methods to provide detection results for individual components of a system, which allows more fine-grained reactions and better debugging.
The performance of our approach definitely depends on the structure of the distributed software system of the robot. We assume our method to perform better in case the components are of smaller size with higher data exchange via the middle-ware. The benchmark system already contained several quite complex components with only limited visibility of certain inputs via the middleware (e.g. camera images) for which we could achieve reasonable performances. Still, more research on the effect the system structure has on the detection performance is required. The evaluation has also shown that the approach captures faults directly affecting performance counters better than faults which are reflected in the event data or sparse temporal patterns. To increase the performance for such cases, existing methods like communication invari-ants could be added to the system to form an ensemble-based classification scheme.
An issue which we have not explicitly addressed yet is the one of resource sharing between components, e.g. of the CPU. In case of starvation, all components on the same host are affected. While training from real executions of the system is generally able to learn these influences in case they occur also under normal circumstances, a faulty starvation of shared resources will likely result in too many components being reported as unhealthy. This is also an issue in case a component ends up in a faulty state which affects its behavior of producing events. As training from real executions inevitably includes assumptions about the specific data rates in the system, any deviation in the inputs will be noticed by the downstream components’ fault detectors. We plan to address this issue in two ways. On the one hand, the existing model information about the component input and output channels is sufficient to construct a component dependency graph, which can be exploited to reason about the upstream causes of a detected failure. On the other hand, we are evaluating how to generate training data independent of the real system execution, which captures the component developer’s assumptions about suitable inputs and data rates for the component. Usually, this will allow higher variations then experienced in a single system, which in turn will resolve the issue of false-positive detections for downstream components. Also, this will prevent regenerating training data for the whole system in case individual components are changed. As generating such training data will involve a further development step, we specifically try to facilitate this process via software engineering methods.
In any case, the current method is already able to capture a wide range of performance bugs with a reasonable overhead for integrating it. We therefore hope that it will increase the stability of current robotics systems and we will continuously improve it and integrate it into our systems.
ACKNOWLEDGMENT
This work was funded as part of the Cluster of Excel-lence Cognitive Interaction Technology ‘CITEC’ (EXC 277), Bielefeld University and by the German Federal Ministry of Education and Research (BMBF) within the Leading-Edge Cluster Competition “it’s OWL” (intelligent technical systems OstWestfalenLippe) and managed by the Project Management Agency Karlsruhe (PTKA).
REFERENCES
[1] G. Steinbauer, “A survey about faults of robots used in
RoboCup,” inRoboCup 2012: Robot Soccer World Cup XVI,
Springer, 2013, pp. 344–355.
[2] S. Zaman, G. Steinbauer, J. Maurer, P. Lepej, and S. Uran,
“An integrated model-based diagnosis and repair
architec-ture for ROS-based robot systems,” in2013 IEEE
Interna-tional Conference on Robotics and Automation (ICRA 2013),
Piscataway, NJ: IEEE, 2013, pp. 482–489.DOI:10.1109/
ICRA.2013.6630618.
[3] O. Pettersson, “Execution monitoring in robotics: A survey,”
Robotics and Autonomous Systems, vol. 53, no. 2, pp. 73–88,
2005.DOI:10.1016/j.robot.2005.09.004.
[4] G. Steinbauer, M. M¨orth, and F. Wotawa, “Real-time
di-agnosis and repair of faults of robot control software,” in RoboCup 2005: Robot Soccer World Cup IX, A. Breden-feld, A. Jacoff, I. Noda, and Y. Takahashi, Eds., Berlin,
Heidelberg: Springer, 2006, pp. 13–23. DOI: 10 . 1007 /
11780519_2.
[5] M. Quigley, K. Conley, B. Gerkey, J. Faust, T. Foote, J.
Leibs, R. Wheeler, and A. Y. Ng, “ROS: An open-source
Robot Operating System,” inICRA workshop on open source
software, 2009, p. 5.
[6] J. Wienke and S. Wrede, “A middleware for collaborative
research in experimental robotics,” inIEEE/SICE
Interna-tional Symposium on System Integration (SII2011), (Kyoto,
Japan), IEEE, 2011, pp. 1183–1190.DOI:10.1109/SII.
2011.6147617.
[7] R. Golombek, S. Wrede, M. Hanheide, and M. Heckmann,
“Online data-driven fault detection for robotic systems,” in INTELLIGENT ROBOTS AND SYSTEMS, San Francisco:
IEEE, 2011, pp. 3011–3016. DOI: 10 . 1109 / IROS .
2011.6095034.
[8] M. J. Sydor, Apm best practices: Realizing application
performance management. Apress, 2010.
[9] G. Jin, L. Song, X. Shi, J. Scherpelz, and S. Lu,
“Un-derstanding and detecting real-world performance bugs,” in PROCEEDINGS OF THE 33RD ACM SIGPLAN CONFER-ENCE ON PROGRAMMING LANGUAGE DESIGN AND IMPLEMENTATION, J. Vitek, L. Haibo, and F. Tip, Eds.,
New York, NY, USA: ACM, 2012, p. 77.DOI:10.1145/
2254064.2254075.
[10] V. Monajjemi, J. Wawerla, and R. Vaughan, “Drums: A
middleware-aware distributed robot monitoring system,” in Computer and Robot Vision (CRV), 2014 Canadian Confer-ence on, IEEE, Montreal, QC: IEEE, 2014, pp. 211–218. DOI:10.1109/CRV.2014.36.
[11] E. Khalastchi, M. Kalech, G. A. Kaminka, and R. Lin,
“On-line data-driven anomaly detection in autonomous robots,” Knowledge and Information Systems, vol. 43, no. 3, pp. 657–
688, 2015.DOI:10.1007/s10115-014-0754-y.
[12] G. Steinbauer and F. Wotawa, “Detecting and locating faults
in the control software of autonomous mobile robots,” in International Joint Conference on AI, L. P. Kaelbling, Ed., 2005, pp. 1742–1743.
[13] K. Shen, C. Stewart, C. Li, and X. Li, “Reference-driven
performance anomaly identification,” inProceedings of the
eleventh international joint conference on Measurement and modeling of computer systems, J. Douceur, A. Greenberg, T. Bonald, and J. Nieh, Eds., New York, NY, USA: ACM,
2009, pp. 85–96.DOI:10.1145/1555349.1555360.
[14] J.-C. Laprie, “Dependable computing and fault tolerance:
Concepts and terminology,” in The Twenty-Fifth
Interna-tional Symposium on Fault-Tolerant Computing, Los
Alami-tos, California: IEEE Computer Society, 1995. DOI: 10 .
1109/FTCSH.1995.532603.
[15] H. Jiang, S. Elbaum, and C. Detweiler, “Inferring and
mon-itoring invariants in robotic systems,”Autonomous Robots,
2016.DOI:10.1007/s10514-016-9576-y.
[16] V. Chandola, A. Banerjee, and V. Kumar, “Anomaly
de-tection: A survey,”ACM COMPUTING SURVEYS, vol. 41,
no. 3, 15:1–15:58, 2009. DOI: 10 . 1145 / 1541880 .
1541882.
[17] S. X. Ding,Model-based fault diagnosis techniques: Design
schemes, algorithms and tools, 2nd ed., ser. Advances in
Industrial Control. Berlin: Springer, 2008.DOI:10.1007/
978-3-540-76304-8.
[18] H. Zou and T. Hastie, “Regularization and variable selection
via the elastic net,”Journal of the Royal Statistical Society,
vol. 67, no. 2, pp. 301–320, 2005.
[19] J. Wienke, S. Meyer zu Borgsen, and S. Wrede, “A data set
for fault detection research on component-based robotic
sys-tems,” inTowards Autonomous Robotic Systems, L. Alboul,
D. Damian, and J. M. Aitken, Eds., Springer International
Publishing, 2016, pp. 339–350.DOI:10.1007/978-
3-319-40379-3_35.
[20] L. van Beek, K. Chen, D. Holz, M. Matamoros, C.
Ras-con, M. Rudinac, J. R. des Solar, and S. Wachsmuth, RoboCup@Home 2015: Rule and regulations, 2015.
[21] B. Sch¨olkopf, R. C. Williamson, A. J. Smola, J.
Shawe-Taylor, and J. C. Platt, “Support vector method for novelty
detection,” in Advances in Neural Information Processing
Systems 12 (NIPS 1999), S. A. Solla, T. K. Leen, and K. M¨uller, Eds., MIT Press, 2000, pp. 582–588.
[22] D. Miljkovi, “Fault detection methods: A literature survey,”
in Proceedings of the 34th International Convention on Information and Communication Technology, Electronics and Microelectronics (MIPRO 2011), P. Biljanovic, Ed., Piscataway, NJ: IEEE, 2011, pp. 750–755.
[23] J. Weber and F. Wotawa, “Using AI techniques for fault
lo-calization in component-oriented software systems,” in
MI-CAI 2006: ADVANCES IN ARTIFICIAL INTELLIGENCE, D. Hutchison, T. Kanade, J. Kittler, J. M. Kleinberg, F. Mattern, J. C. Mitchell, M. Naor, O. Nierstrasz, C. Pandu Rangan, B. Steffen, M. Sudan, D. Terzopoulos, D. Tygar, M. Y. Vardi, G. Weikum, A. Gelbukh, and C. A. Reyes-Garcia, Eds., Berlin, Heidelberg: Springer, 2006, pp. 1139–
1149.DOI:10.1007/11925231_109.
[24] A. Kleiner, G. Steinbauer, and F. Wotawa, “Towards
au-tomated online diagnosis of robot navigation software,” in SIMULATION, MODELING, AND PROGRAMMING FOR AUTONOMOUS ROBOTS, S. Carpin, I. Noda, E. Pagello, M. Reggiani, and O. von Stryk, Eds., Berlin, Heidelberg:
Springer, 2008, pp. 159–170. DOI: 10 . 1007 / 978 3
-540-89076-8_18.
[25] F. Knorn and D. J. Leith, “Adaptive kalman filtering for
anomaly detection in software appliances,” inIEEE
INFO-COM workshops 2008, Piscataway, NJ: IEEE, 2008, pp. 1–6. DOI:10.1109/INFOCOM.2008.4544581.