Access to Electronic Thesis
Author: Mohd Fairusham Ghazali
Thesis title: Leak Detection Using Instantaneous Frequency Analysis
Qualification: PhD
This electronic thesis is protected by the Copyright, Designs and Patents Act 1988. No reproduction is permitted without consent of the author. It is also protected by the Creative Commons Licence allowing Attributions-Non-commercial-No
derivatives.
If this electronic thesis has been edited by the author it will be indicated as such on the title page and in the text.
i
LEAK DETECTION USING
INSTANTANEOUS FREQUENCY
ANALYSIS
by
Mohd Fairusham Ghazali
A dissertation submitted to the University of Sheffield for the degree of Doctor Philosophy
May 2012
Department of Mechanical Engineering The University of Sheffield Mappin Street, Sheffield, S1 3JD
ii
Summary
Leaking pipes are a primary concern for water utilities around the globe as they compose a major portion of losses. Contemporary interest surrounding leaks is well documented and there is a proliferation of leak detection techniques. Although the reasons for these leaks are well known, some of the current methods for leak detection and location are either complicated, inaccurate and most of them are time consuming. Transient analyses offer a plausible route towards leak detection due to their robustness and simplicity. These approaches use the change of pressure response of the fluid in a pipeline to identify features. The method used in the current study employ a single pressure transducer to obtain the time domain signal of the pressure transient response caused by a sudden opening and closing of a solenoid valve. The device used is fitted onto a standard UK hydrant and both cause a pressure wave and acquire the pressure history.
The work described here shows that the analysis using Hilbert transform (HT), Hilbert Huang transform (HHT) and EMD based method is a promising tool for leak detection and location in the pipeline network.
In the first part of the work, the analysis of instantaneous characteristics of transient pressure signal has been calculated using HT and HHT for both simulated and experimental data. These instantaneous properties of the signals are shown to be capable of detecting the reflection from the features of the pipe such as leakages and outlet. When tested with leak different locations, the processed results still show the existing of the features in the system.
In the second part of the work, the study is based on newly method of analysing non-stationary data called empirical mode decomposition (EMD) for instantaneous frequency calculation for leak detection. First, the pressure signals were filtered in order to remove the noise using EMD. Then the instantaneous frequency was calculated and compared using different methods. With this method, it is possible to identify the leaks and also the features in the pipeline network. These were tested at different locations of a real water distribution system in the Yorkshire Water region.
iii
Acknowledgements
Foremost I wish to express my sincere gratitude to my supervisors, Prof. S.B.M. Beck and Prof. W.J. Staszewski, for doing such a sterling job of developing my interest and enlarging my knowledge in the professional field. Over the years, I have borrowed liberally from their wisdom, their sense of honour, balance and judgment and their fortitude in pursuing academic research.
Special thanks must be given to Dr. J. Shucksmith, lecturer of Civil and Structural Engineering of the University of Sheffield, for his insightful suggestion on our several co-authored papers.
The author also thanks to Yorkshire Water PLC for their financial support.
Thanks to the Ministry of Higher Education of Malaysia and University Malaysia Pahang for PhD scholarship.
I would like to thank my family members for their endless supports in all aspects and for bringing me great happiness in my life. Not to forget, this space and credit to my dearest wife, Dr Zurainie Abllah and my lovely sons; late Fahmi, Fahim and Fatih, whose love, sacrifice and patience, make me feel stronger and inspired. There is no greater support and encouragement besides all of you.
iv
Table of Contents
Summary ...ii Acknowledgements ...iii Table of Contents ...iv List of Figures ...ix List of Tables ...xv Abbreviations ...xvi Nomenclatures ...xviii Chapter 1 Introduction ...11.1 Structure of water supply system ...2
1.2 Pipe assets ...4
1.3 Effect of corrosions on leakage and pipe failure mechanism ...6
1.4 Water Losses in a network ...8
1.5 Leak and public health risk ...10
1.6 Consequence of leakage and water loss ...12
1.7 Leakage solutions and control ...14
1.8 Leakage Detection ...16
1.9 Summary ...16
1.10 Research scope and objectives ...17
1.11 Thesis organization ...17
Chapter 2 Review of Leak Detection Techniques ...19
2.1 Introduction ...19
2.2 Leakage detection techniques ...21
v
2.2.1.1 Visual observation ...23
2.2.1.2 Tracer injection ...24
2.2.1.3 Thermography ...24
2.2.1.4 Ground penetrating radar (GPR) ...24
2.2.1.5 Acoustic leak detection ...26
2.2.1.6 Pig based method ...27
2.2.2 Leak detection based on internal methods ...28
2.2.2.1 Hydrostatic-testing ...28
2.2.2.2 Mass balance method ...29
2.2.2.3 Pressure point analysis (PPA) ...29
2.2.2.4 Statistical analysis model ...30
2.2.2.5 Transient based methods ...30
2.3 Summary ...37
Chapter 3 Propagation of Waves in Pipelines ...39
3.1 Introduction ...39
3.2 Water hammer phenomenon in a pipeline ...39
3.3 Ideal propagation of transient pressure waves in pipe ...43
3.4 Effect of a leak on a pressure wave ...44
3.5 Effect of features on the pressure wave ...46
3.6 Dispersion and attenuation ...51
3.7 Effect of noise in the system ...54
3.8 Summary ...54
Chapter 4 Signal Analysis Methods for Leak Detection ...55
vi
4.2 Fundamental Concepts ...56
4.2.1 Fourier Transform ...56
4.2.2 Cepstrum ...59
4.2.3 Wavelet ...62
4.2.3.1 Continuous Wavelet Transform (CWT) ...62
4.2.3.2 Discrete Wavelet Transform (DWT) ...63
4.2.4 Hilbert transform and analytical signal ...64
4.2.5 Hilbert-Huang Transform ...67
4.2.5.1 The Empirical Mode Decomposition (EMD) ...68
4.2.5.2 The Sifting Process ...69
4.2.5.3 Instantaneous Frequency (IF) ...76
4.2.5.3.1 Hilbert transforms (HT) ...76
4.2.5.3.2 Normalized Hilbert Transform (NHT) ...77
4.2.5.3.3 Direct Quadrature (DQ) ...79
4.2.5.3.4 Teager Energy Operator (TEO) ...79
4.2.5.4 Recent Development ...80
4.3 Numerical simulations to test leak detection algorithm ...82
4..3.1 EMD analysis ...83
4.3.2 Comparison with the others signal analysis methods ...85
4.4 Summary ...87
Chapter 5 Leak Location in Pipe Networks Modeled with Transmission Line Techniques (TLM) ...89
5.1 Introduction ...89
5.2 Transmission Line Modeling (TLM) ...90
5.2.1 A short history of TLM ...91
vii
5.2.3 Waves at junctions ...94
5.2.4 User input resistance and assumptions involved in TLM ...96
5.3 Pipe network simulation and analysis ...97
5.3.1 Simulated Models ...98
5.3.1.1 Test A: Resistance location 11m from the end of the pipe (A=7m, B=17m and C=11m) ...99
5.3.1.1.1 The HT analysis ...100
5.3.1.1.2 The HHT analysis ...102
5.3.2.1 Test B: Resistance location 17m from the end of the pipe (A=7m, B=11m and C=17m) ...106
5.3.2.1.1 The HT analysis ...107
5.3.2.1.2 The HHT analysis ...109
5.4 Summary ...110
Chapter 6 Instantaneous Phase and Frequency for the Detection of Leaks and Features in a PVC Pipeline ...112
6.1 Introduction ...112
6.2 Description of experimental set up ...113
6.2.1 Signal acquisition ...115 6.3 Analysis of Pressure Signals ...119 6.3.1 Simulated Pressure Signal ...120
6.4 Results ...121
6.4.1 The HT analysis ...121
6.4.2 The HHT analysis ...129
viii Chapter 7 Comparative Study of Instantaneous Frequency Based
Methods for Leak Detection in Pipeline Networks ... 139
7.1 Introduction ...139
7.2 Leak detection scheme outline ...140
7.2.1 Implementation ...140
7.2.2 Numerical simulations to test leak detection algorithm ...141
7.3 Experimental method ...146
7.3.1 Field site 1 -Field operators training site, Esholt ...146 7.3.1.1 Test results ...150
7.3.2 Field site 2 –Yorkshire Water’s distribution network (Roach Road, Sheffield) ...155
7.3.2.1 Test results ...158
7.3.3 Field site 3 –Yorkshire Water’s distribution network (East Bank Road, Sheffield) ...161
7.3.3.1 Test results ...163
7.4 Summary ...165
Chapter 8 Conclusions and future work ...166
8.1 Overview ...166
8.2 Conclusions ...167
8.3 Recommendations for Future Works ...169
References ...171
ix
List of Figures
Figure 1-1: Example of the structure for water supply system ... 2
Figure 1-2: Pipe failure development ... 5
Figure 1-3: Typical installation of cathodic protection. ... 7
Figure 1-4: Different types of pipe failure (a) Circumferential cracking; (b) Longitudinal cracking; (c) Bell splitting; (d) Bell sharing; (e) Blow out holes; (f) Spiral cracking. ... 7
Figure 1-5: IWA standard international water balance and terminology ... 9
Figure 1-6: Hydraulic transient at position x in the system ... 11
Figure 1-7: Leaky water pipe lay next to a sewer pipe ... 12
Figure 1-8: Energy grade line (EGL) of a pipe segment with and without a leak ... 13
Figure 1-9: The four basic components of managing real losses, with secondary influence of pressure management ... 15
Figure 2-1: Estimated total leak by water companies ... 20
Figure 2-2: Several leak detection methods by historical appearance ... 21
Figure 2-3: GPR data before (a) and after (b) interpretation of image ... 25
Figure 2-4: Measurement arrangement for leak using acoustic sensors .... 26
Figure 2-5: Schematic representation of Sahara system ... 28
Figure 2-6: Pressure time history during transient due to the closure of the start valve (top). Detail of the initial pressure wave including the reflected wave from the main (bottom) ... 31
Figure 3-1: Valve closure in a frictionless system ... 41
Figure 3-2: Conceptual wave reflections at a leak. ... 43
Figure 3-3: Transient propagation in pipeline systems. ... 43
Figure 3-4: Pipeline with a leaking point and two boundaries ... 44 Figure 3-5: Transient wave propagation and its reflections from leak 46
x and pipelines boundaries ...
Figure 3-6: Reflection and transmission of wave at junction ... 48
Figure 3-7: Incident wave at reservoir ... 49
Figure 3-8: Incident wave at dead-end/ closed valve ... 49
Figure 3-9: Incident wave at diameter increase in pipe ... 50
Figure 3-10: Pressure waves in an open-ended pipe ... 50
Figure 3-11: Dispersion of wave pulse ... 51
Figure 3-12: (a) Top left- Elastic Pipeline for a Water Transportation System (b) Top right- Transient Pressure Head Trace in the Elastic Pipeline (c) Middle left- Visco-elastic Pipeline for an Urban Drainage System (d) Middle right- Transient Pressure Head Trace in the Visco-elastic Pipeline (e) Bottom left- Randomly Varying Pipe Diameters due to Corrosion (f) Bottom right- Transient Pressure Head Trace in the Disordered-Diameter Pipeline ... 53
Figure 4-1: Procedure of computing the STFT ... 58
Figure 4-2: Example signal s with an echo. ... 61
Figure 4-3: The complex cepstrum of the signal s with an echo. ... 61
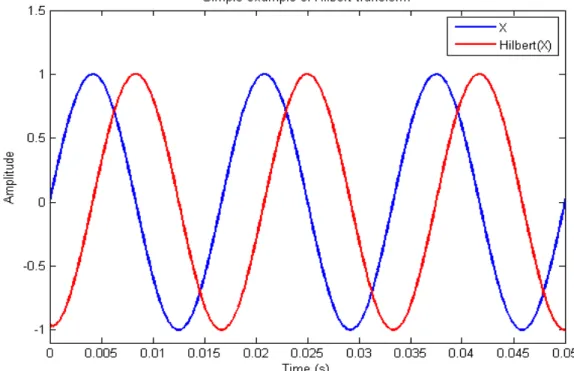
Figure 4-4: A sine wave and its Hilbert transform ... 66
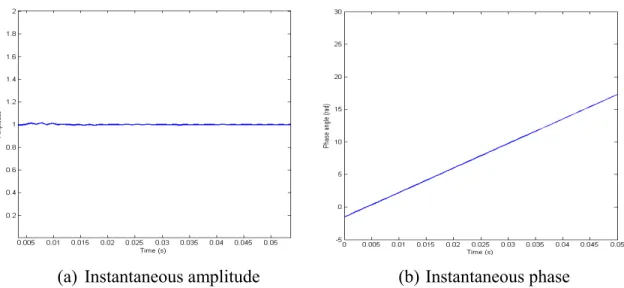
Figure 4-5: Instantaneous characteristics of the Hilbert transform of sine wave. ...66
Figure 4-6: A schematic representation of sifting process. (a) The original signal; (b) The signal in thin solid line; The upper and lower envelopes in dot-dashed lines; The mean in thick solid line; (c) The difference between the signal and mean ...70
Figure 4-7: Effect of repeated sifting process: (a) After 2nd sifting of the result in Figure 4.6(c); (b) After 9th sifting of the signal in Figure 4.6(c) and considered as an IMF ...71
Figure 4-8: Flow chart of EMD process. ...75
Figure 4-9: The instantaneous frequency estimation a linear chirp signal ...77
Figure 4-10 Time domain (top) and frequency spectrum (bottom) of example signal v t ... 82
xi
Figure 4-12: Hilbert spectrum of IMF1-IMF3 of signal v t ... 84
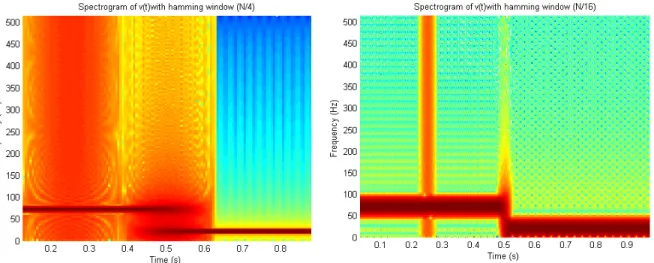
Figure 4-13: Spectrogram of v t at different window size ... 85
Figure 4-14: Scalogram of v t at different wavelet types. ... 86
Figure 5-1: Pipe showing upstream and downstream pressure and flows ... 92
Figure 5-2: Typical topology and dimensions of modelled circuit ... 96
Figure 5-3: Pipe network model without resistance ... 98
Figure 5-4: Pipe network model with resistance ...99
Figure 5-5: Simulated time/pressure response of the pipeline network system ...100
Figure 5-6: Instantaneous phase and instantaneous frequency analysis using HT for Test A. The signal with large resistance in thin solid line (top); The signal with low resistance in dashed lines (middle); The signal without resistance in dot dashed lines (bottom). ... 101
Figure 5-7: The seven IMF components for large resistance signal. ... 103
Figure 5-8: Hilbert spectrum of IMF1-IMF6 of the signal with large resistance ...104
Figure 5-9: Hilbert spectrum of IMF1-IMF4 of the signal with small resistance . 105 Figure 5-10: Hilbert spectrum of IMF1-IMF4 of the signal without resistance. ... 106
Figure 5-11: Simulated time pressure response of the pipeline network system for Test B ...107
Figure 5-12: Instantaneous phase (top) and instantaneous frequency (bottom) analysis using HT for Test B ... 108
Figure 5-13: Decomposed signal of Test B. ...109
Figure 5-14: Hilbert spectrum of IMF1-IMF4 of the signal with small resistance for Test B ... 110
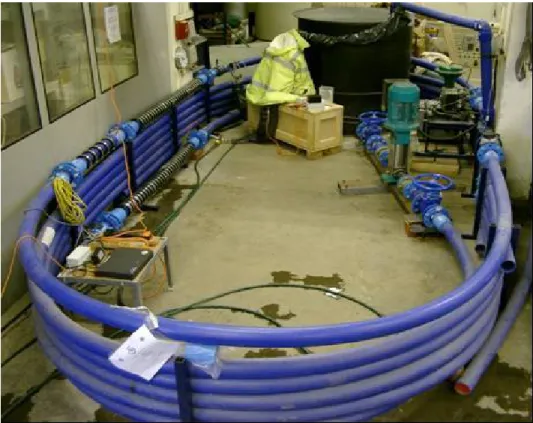
Figure 6-1: The experimental set-up at the University of Sheffield. ... 114
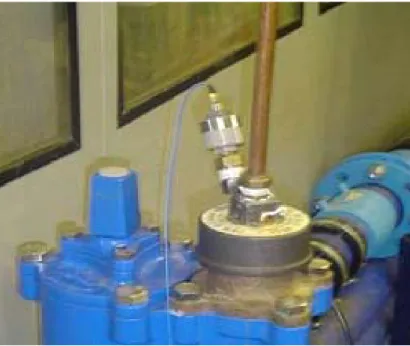
Figure 6-2: The pressure transducer attached to the hydrant ... 115
Figure 6-3: The solenoid valve has been installed and attached to hydrant ... 116
xii
Figure 6-4: Typical pressure response as transient device activated ... 117
Figure 6-5: Leaking point distributed along the pipe.. ... 118
Figure 6-6: The cap is removed to simulate the present of leak. ... 118
Figure 6-7: Ball valve to simulate the leak. ... 119
Figure 6-8: Network model without leak ... 120
Figure 6-9: Network model with leak at 27m from the hydrant ... 121
Figure 6-10: Sampled data from the simulated pipe network. ... 122
Figure 6-11: Instantaneous phase (top) and instantaneous frequency (bottom) analysis using HT of simulated networks without leak (dash line) and with a leak (solid line) located 27m from the valve. ... 123
Figure 6-12: Experimental pressure signal without the present of leak ... 124
Figure 6-13: Instantaneous phase (top) and instantaneous frequency (bottom) from HT analysis of experimental data without the present of leak ... 124
Figure 6-14: Experimental pressure signal with leak located 27m from measuring point ... 125
Figure 6-15 : Instantaneous phase (top) and instantaneous frequency (bottom) from HT analysis of experimental data with a leak located 27m from the measuring point.. ... 126
Figure 6-16: Experimental pressure signal with leak located at 35m (top) and 74.5m (bottom) from measuring point. ... 126
Figure 6-17: Instantaneous phase (top) and instantaneous frequency (bottom) from HT analysis of experimental data with a leak located 35m from the valve. ...127
Figure 6-18: Instantaneous phase (top) and instantaneous frequency (bottom) from HT analysis of experimental data with a leak located 35m from the valve. ... 128
Figure 6-19: The IMF’s and its residue of the simulation data.. ... 130
Figure 6-20: HHT spectrum analysis of IMF4-IMF7 of simulated network without leak. ... 131 Figure 6-21: HHT spectrum analysis of IMF4-IMF7 of simulated
network with leak located 27m from the valve ... 131
xiii Figure 6-22: The IMF’s and its residue of the experimental data. ... 133 Figure 6-23 : Experimental pressure signal for leak at 27m from
measuring point and filtered signal without noise using EMD. ... 134 Figure 6-24: HHT spectrum analysis of IMF4-IMF8 of experimental
data with leak located 27m from the valve ... 134 Figure 6-25: Experimental pressure signal for leak at 35m from
measuring point and filtered signal without noise using EMD. ... 135 Figure 6-26: Experimental pressure signal for leak at 74.5m from
measuring point and filtered signal without noise using EMD. ... 135 Figure 6-27: HHT spectrum analysis of IMF4-IMF9 of experimental
data with leak located 35m from the measuring point. ... 136 Figure 6-28: HHT spectrum analysis of IMF4-IMF9 of experimental
data with leak located 74.5m from the measuring point. ... 136 Figure 7-1: Map of water companies supply each area of England and
Wales ... 139
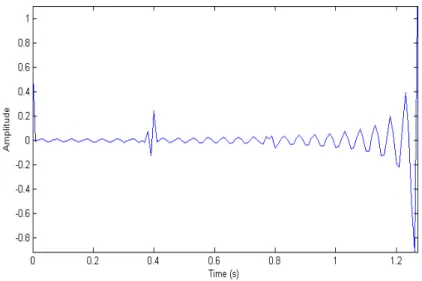
Figure 7-2: The operation procedure of the proposed method ... 141 Figure 7-3:. The synthetic signal with the present of artificial impulse. ...142 Figure 7-4: The 5 IMFs component with its residue for the
) ( ) ( ) (t x t vt s = + ... 143 Figure 7-5: The simulated signal with instantaneous frequency by HT,
NHT, DQ, TEO and Cepstrum. ... 143 Figure 7-6: The 11 IMFs component with its residue for the s t
x t v t noise ... 145 Figure 7-7: The simulated signal with noise and instantaneous
frequency contribution by HT,NHT,DQ,TEO and Cesptrum. ... 146 Figure 7-8: Yorkshire Water’s field operators training site in Esholt,
Bradford: (a) Google maps view(red circle); (b)View of pipeline path; (c) Schematic map pipeline arrangement. ... 147 Figure 7-9: Field site 1 test setup with distances of all features relative
to the testing hydrant are shown. ... 148 Figure 7-10: The device used to generate and collect the pressure 149
xiv transient signal. ...
Figure 7-11: The complete measurement setup during the test ... 149 Figure 7-12:. Sampled data from field site 1 test. ... 150 Figure 7-13: The IMF’s and its residue of field site 1 test. ... 151 Figure 7-14: Original signal (left) and filtered signal (right) of the raw
data from field site 1 test ... 152 Figure 7-15: Instantaneous frequency analysis by HT,NHT,DQ,TEO
and Cesptrum and Taghvaei of the field site 1 test ... 153 Figure 7-16: Field site 2 configuration: (a) Google maps view (marked
as red); (b) Schematic map pipeline arrangement. ... 156 Figure 7-17:. Typical connection of pressure transducer to the hydrant. ... 157 Figure 7-18: Connection of solenoid valve to hydrant to generate
pressure transient.. ... 157 Figure 7-19: Sampled data from field site 2 test. ... 158 Figure 7-20: Instantaneous frequency analysis by HT, NHT, DQ, TEO
and Cesptrum and Taghvaei of the field site 2 test data using hydrant 1 (H1). ... 159 Figure 7-21: Instantaneous frequency analysis by HT,NHT,DQ,TEO
and Cesptrum and Taghvaei of the field site 2 test data using hydrant 2 (H2). ... 160 Figure 7-22: Field site 3 test configuration: (a) Google maps view
(marked as red); (b) Schematic map pipeline arrangement. .... 162 Figure 7-23: Sampled data from field site 3 test. ... 163 Figure 7-24: Instantaneous frequency analysis by HT, NHT, DQ, TEO
xv
List of Tables
Table 4-1: Comparison of STFT, the wavelet and the HHT... 87 Table 5-1: Common junction ... 94 Table 6-1: Summary result of the tests with and without leaks using
HT ... 128 Table 6-2: Summary result of the tests with and without leaks using
HHT ... 137 Table 7-1: Summary result of field site 1 test data for different
instantaneous frequency analysis ... 154 Table 7-2: Summary result of field site 1 test data for different
instantaneous frequency analyses: (a) Results of analysis using hydrant 1 (H1); (b) Results of analysis using hydrant 2 (H2) ... 161 Table 7-3: Summary result of field site 3 test data for different
xvi
Abbreviations
DMA District meter area
MSCL Mild steel cement lined
PCCP’s Prestressed concrete cylinder pipes
PVC Polynivyl chloride
EPA Environmental protection agency IWA International water association
SIV System input volume
NRW Non revenue water
UFW Uncounted for water
IWSA International water supplying association AWWA American water works association CIWEM Chartered institution of water and environmental management EGL Energy grade line
ALC Active leakage control
PLC Passive leakage control
CARL Current annual real losses UARL Unavoidable annual real losses
FT Fourier transform
AM Amplitude modulation
FM Frequency modulation
STFT Short time Fourier transform
HT Hilbert transform
HHT Hilbert Huang transform
xvii
IF Instantaneous frequency
GPR Ground penetrating radar PPA Pressure point analysis
MOC Method of characteristics
GA Generic algorithm
ITA Inverse transient analysis
SWDM Standing wave difference method PPWM Portable pressure wave method
EMD Empirical mode decomposition
IMF Intrinsic mode function
NHT Normalize Hilbert transform
DQ Direct quadrature
TEO Teager energy operator
DWT Discrete wavelet transform CWT Continuous wavelet transform STP Standard temperature pressure
EEMD Ensemble empirical mode decomposition
HS Hilbert spectrum
SUNAS Sheffield university network analysis software
LEL Leakage economic level
MDPE Medium density polyethylene
xviii
Nomenclatures
a Wave speed of fluid (m/s)
i
a Wave speed of i-th pipe (m/s) 0
a Incoming wave speed (m/s)
i
A Area of i th pipe (m 2) 0
A Incoming pipe area ( m 2)
b Time translation parameter )
(k
C Wavelet coefficient
d
C Discharge coefficient
The first IMF IMFs
nth IMF derive from sifting process
D Pipe diameter (m)
) , (j k
d Detail coefficients at level j and location k
d Distance between access points (m)
f Frequency ) (w F Fourier transform of f(t) g Gravity vector (m / s2 ) j −1
J Number of levels of DWT decomposition
k Elastic property (n/m2)
M Number of data point
P Pressure (Pa)
Re Reynolds number of the flow (related to the pipe diameter)
xix s Transmission factor t Time (s) peak t Time delay (s) a t Time instance (s) u Velocity (m/s) V Velocity vector (m/s) w Angular frequency ) (t w Window function ) (t
x Time domain factor
leak X Position of leak H Δ Change in head (m) 0 H
Δ Head of pressure wave (m)
R H
Δ Head of reflected wave (m)
s
H
Δ Head of transmitted wave (m)
P
Δ Change of pressure (Pa)
V
Δ Change in fluid velocity (m/s)
f
Δ Frequency resolution
t
Δ Time resolution
ε Turbulent rate of diffusion (m2 / S 3 )
k Turbulence intensity (KW / m2 )
μ Dynamic viscosity ( Pa.s ) ν Kinematics viscosity (Kg.m.s−1)
ρ Fluid density (Kg.m−3 )
τ Position in time of Gaussian window )
, ( f
xx )
( ,b t a
ψ Scale version of base wavelet CWT
k j,
ψ Scale version of base wavelet for DWT ) (t Aj Wavelet approximation ) (t Di Detail coefficient of DWT ) (t ψ Wavelet function ) (x φ Scaling function ψ
C Admissibility wavelet condition x, y, z Cartesian coordinates
1
Chapter 1
Introduction
Water is an essential element for life which is necessary for the survival of human beings and is scarce supply in most parts of the world. According to the Global water Supply & Sanitation assessment report [1], at the beginning of 2000, one sixth (1.1 billion people) of the world’s population was without access to a potable water supply. As a result, there is an increasing awareness around the world of the need to prevent the loss of this natural resource. In the last decade, with changing climatic conditions, population growth and the increasing cost of access to water resources, many countries must cope with limited resources. In many countries water companies have identified the problem and measures are already being undertaken to foster an approach of better management of the water distribution systems [2]. These efforts come from effective water utilisation, reduction of wastage and control policies to demand management strategies. Water loss from the water distribution systems remains one of the main problem issues facing not only developing, but also developed countries throughout the world. Aging pipes is one of the predominant factors to the water loss as water transmission and distribution networks continue to deteriorate with time [3].
It is not practical to prevent many pipes from failure since a significant proportion of pipelines was installed in the first part of 20th century and are now in poor condition. Additionally, although, pipeline systems are currently designed and constructed in accordance with relevant quality standards set by authority to maintain their integrity, leaks are an inevitable problem even in new pipeline networks. In general, pipeline systems can be considered to be in an acceptable state if they have an average annual pipe break ratio below 40 per 100 km [4].
A key to developing a leak detection strategy is to monitor the system from an early stage. Leakage occurring from transmission and distribution mains normally cause large pressure surge events, sometimes catastrophic, which can cause damage to road infrastructure and vehicles. Furthermore, due to different topology and hydraulic characteristic's component
2 of the water distribution system, separate leak detection and location methods have been proposed in the past. As it will be presented in the review of the literature in the next chapter, great efforts have been made in order to develop methodologies or devices for determination of leaks, with some limited success.
1.1
Structure of a water supply system
Water systems are lifelines of communities. Generally, the design and complexity of drinking water supply systems may be different significantly, but all of them have the same basic principle; to convey the water from the source such as treatment facility to their customers. They are made of such items as valves, fittings, thrust restraints, pumps, reservoirs, and, of course, associated pipe features. Source for municipal water supplies consists of wells, rivers, lakes, aquifers and reservoirs. It is estimated that about two thirds of the water available for public supplies around the world comes from surface water sources. An example of the structure for water supply system from water treatment plant to a distribution system is shown as Figure 1-1.
Figure 1-1: Example of the structure for water supply system [3].
The whole water system can sometimes be divided into two parts [3]: the transmission lines and the distribution system. The transmission system is that part of the system which conveys a large amount of water over great distance typically from the source to the
3 distribution system. It may consist of treatment facility and storage reservoir. On the other hand, transmission lines have few, if any, interconnections. Such lines can be built underground as well as aboveground with various lengths. In some areas, the water has to be distributed over distance of hundreds of kilometres. The main design consideration for a transmission line is that of internal pressure. Normally, individual customers are not served directly from these transmission pipelines.
The distribution piping system transport water to the residential area. In general, a distribution system has a complex topology and contains a large number of elements. It consists of a distribution main and a service connection. Distribution mains can be considered as an intermediate step towards delivering water to the end customers. It includes many connections, loops, and so forth. As shown in Figure 1-1 an urban distribution system is a combination of looped and branched topologies. The size of service pipes is smaller than distribution mains and connected from street to property.
Looped systems are preferable compared to branch system because, combination with sufficient valving, they can offer an extra level of reliability [5]. However, the installation cost for a looped system is more expensive than for a branched system. Figure 1-1 also displays closer view of the parts of the water distribution system at the street level. District meter areas (DMAs) have been installed to monitor the flow into supply zones. As we can see, a fire hydrant connector point is another common element in both transmission and distribution systems. Meanwhile, various types of valve have been installed for the purpose of isolation in case of failure remediation or maintenance work by the water companies. Distribution systems are made up of an interconnected pipe network. Tees, elbows, crosses and numerous other fittings are utilized to join and redirect section of pipes. The installation of these fittings and connections need great care to prevent longitudinal bending and differential settlement.
4
1.2
Pipe assets
A variety of materials and technologies have been utilized in the manufacture of water pipe supply for transmission, distribution and service lines. The material used depends on the year of installation and the diameter of the pipe. The most common materials of service connection pipes are steel, plastic and lead [6]. For larger diameters such as transmission pipelines (diameter over 300mm), steel, mild steel cement lined (MSCL) or prestressed concrete cylinder pipes (PCCPs) are usually used. Cast iron or asbestos cement is found in older distribution systems. This distribution of pipe materials in water pipeline systems is changing as a result of the current extensive use of plastic pipes[3].
The most extensive water distribution system in ancient times was built by Romans. The first aqueduct that built by Romans was in 312 B.C., which conveyed the water for long distance by means of gravity through a collection of open and closed conduits. The Romans also introduced lead pressure pipes. In the 13th century, a water supply system in Europe was built in London when a 5.5 km lead pipeline was installed to convey water from Tybourne Brook to London. Sanks [7] reported that in the mid 1700s water mains were constructed by the mixture of wood, cast iron and lead pipe. Some wooden pipes are still in service today. During the 1800s, cast iron pipe gradually replaced wooden pipes. For a long time, cast iron was used and had an excellent record of service but since the 1920s, due to introduction of better materials and pipe making technology many new pipes have been laid. For example, steel, ductile iron, asbestos cement and concrete pipes have been introduced in the water supply system around 50 years ago. Meanwhile, plastic materials have been popular and contribute a large proportion of current installations since its introduction in 1970. Overall, considering the contribution of pipe materials used in the water supply system, it is estimated that the average age of pipes in developed countries is about 50 years. Many cities experienced periods of urban expansion during late 1800s, around World War I, during the 1920s and post World War II brining them an enlargement of the water distribution systems. As a result, the use of old pipe networks for long periods of time has been affected by deterioration processes ever since the initial installation. As point out by Misuinas [3] pipe failure can be described as multistep process as shown in Figure 1-2.
5 Figure 1-2: Pipe failure development [3].
The process consists of installation, initiation of corrosion, crack before leak, partial failure and complete failure. The corrosion develops internally and externally after the pipe has been operated for some time. These processes can cause anomalies such as cracks, corrosion pits and graphitisation. In some cases, cracks can be initiated by mechanical stress. None of them are severe enough to induce leaks, but the residual strength of the pipe is reduced below the internal or external stresses and the pipe wall breaks. Therefore, depending on the size of the break the leak or burst will be initiated. Finally, the complete failure of the pipeline can be caused by a crack, corrosion pit, pre-existing leak burst or interference by third party. As a result, the water can appear on the ground surface.
A failure sequence as shown in Figure 1-2 is not necessarily applicable to all pipes. As reported by Wang and Aatrens [8] the stress corrosion cracks are likely developed with time, that is, active cracks. The materials of the pipe also influence the temporal development of the pipe failure [9]. For steel and ductile iron pipes leak normally occur before they break. It’s different with the cast iron and larger diameter prestressed concrete pipes where break come first before the leak. Meanwhile, PVC and plastic pipes can do either depending on the installation and operational conditions. Obviously, the failure development is more likely to be specific for a particular pipe and very difficult to predict. Involvement of third parties and other external forces make the situation become more complex and challenging. Failure of early leak detection of the water pipe supply can cause big disasters such as flooding, water pressure drop and costly waste from the water distribution system.
6
1.3
Effect of corrosions on leakage and pipe failure mechanism
The characteristics of deteriorating water distribution systems include the increased frequency of leaks and main breaks due to internal or external pipe corrosion. Continuous water movement on the inside can cause corrosion, which may contaminate the water supply. It also leads to the unwanted change in water quality as the water is being transported through the distribution system. Severe internal corrosion may deteriorate the pipe and exposes them to higher risk of bursting and leaking at those locations, hence shortening their useful life. There are several types of external corrosion as stated by Environmental Protection Agency (EPA) [10] such as pitting corrosion, bacteriological corrosion, soil corrosion and graphitic corrosion. Corrosion pitting is the prime deterioration mechanism on the exterior of cast and iron pipe [11]. It occurs when the protective films covering a metal breakdown. Graphitic corrosion potentially occurred in cast iron pipes compare to in ductile iron pipes in any metallic pipe; a result of iron being leached away by corrosion, leaving behind porous graphite mass [10]. Corrosion will grow with time and ultimately lead to a pipe breaking or leaking. On the other hand, plastic pipe materials also may suffer from chemical degradation [3].
Soil content such as in clays and often highly organic soils, which are particularly corrosive require special measures to be taken to protect the pipe from corrosion. As the pipes are buried infrastructure, in any soil, one must always consider the ways to reduce corrosion. For instance, selection of appropriate pipe materials and usage of protective coating and lining during installation. Cathodic protection is widely used to control the effect of external corrosion in the water distribution system. This process basically involves attaching sacrificial anodes (e.g. magnesium) to the water main. The anode will then corrode instead of the water main it is connected to. Figure 1-3 shows a typical installation of an anode.
7 Figure 1-3: Typical installation of cathodic protection [12].
The pipe failure type describes the actual manner in which pipe breaks [11]. According to Makkar [11] pipe failure type can be classified into six main categories: blow out holes, bell shearing, bell splitting, circumferential cracking, longitudinal cracking and spiral cracking. Figure 1-4 depicts these different types of pipe failure.
Figure 1-4: Different types of pipe failure[11] (a) Circumferential cracking; (b) Longitudinal cracking; (c) Bell splitting; (d) Bell shearing; (e) Blow out holes; (f) Spiral
cracking.
The diameter of the pipe influences these modes of failure. For pipes with smaller diameters, it has lower water pressure and also smaller moments of inertia, producing a
8 tendency to longitudinal bending failures. Whereas, for the pipe with larger diameters, it can have higher water pressure and as well higher moments of inertia, which makes them more liable to longitudinal cracking and shearing at the bell [11]. Bell refers to pipe joint which the pipe ending is a bell-like shape.
1.4
Water Losses in a network
The water companies face growing challenges to maintain reliable supply while meeting growing demand. While the need for greater financial efficacy, the research is naturally inspired to be towards water loss evaluation and quantification. Water loss occurs in all distribution systems; only the volume of loss varies. In the recent decades, water loss evaluation has been concentrated on the issues of effective customer metering, categorizing the different elements of water loss and understanding how leakage reacts to different operating modes [13]. International Water Association (IWA) [14] in their guidelines, they reported that real losses in water distribution systems can be divided into background leakage, reported bursts and unreported bursts. In general, the rate of water loss below a certain threshold value can be categorised as background leakage such as all leaks from air valves, hydrants, taps, etc. If the flow rate exceeds the threshold value, it is classified as a burst. Quantification of background leakage normally involves for whole (or part) of a network collectively. Although leakage is usually the key component of water loss in water distribution system, other factors, for example, illegal connections, meter error or accounting errors also significantly contribute to the cost of water loss. According to Farley [15] in water distribution systems total water loss is the difference between the amount of water produced with the amount of water billed or consumed. The volume of water loss varies from country to country and between regions of each country and even from network to network. Other elements of water loss and their relative significance also differ between countries. In order to circumvent for broad usage of formats and definitions used for water balance calculation, the International Water Association through their task force group developed a standard approach for water balance calculations with definitions of all terms involved as shown in Figure 1-5.
9 Figure 1-5: IWA standard international water balance and terminology [15].
The abbreviated terminologies of principal components shown in Figure 1-5 are defined as follows;
System input volume (SIV) refer to the annual input to that part of the water supply system. It can be divided into two components, either authorised consumption or water losses. Authorised consumption is the annual volume of metered and/or non-metered water taken by registered customers, water suppliers and others authorised to do so. It comprises of water exported, leaks and overflow after the point of customer metering. Authorised consumption is either billed or unbilled. Water loss may be classified as either apparent losses or real losses. Real losses are annual volumes lost corresponds to all types of leaks, bursts and overflows on mains, infrastructure age, construction processes, service reservoir and service connection, up to the point of customer metering. Whereas, apparent losses associated with illegal customer consumption and all types of metering inaccuracies. The term non revenue water (NRW) refers to the difference between system input volume and bill authorised consumption. NRW includes unbilled authorised consumption (normally a minor component of the water balanced) and water losses. The expressions ‘water loss’ and ‘non revenue water’(NRW) is recommended to be used by the IWA task forces [14] and have replaced expressions such as ‘uncounted for water’ (UFW) because of less consistent and widely varying interpretations of the term worldwide. Detail explanation of the IWA
10 water balance components and audit methodology can be found in several IWA publications such as Algere [16] and Farley [15].
Furthermore, leakage can be considered as water that is lost continuously from water distribution pipes, joints and fittings. It can be severe and may go undetected for months or even years. It also can be small or big depending on the size of the leakage. Larger leaks are easier to detect than to small one due to the pressure drop in system and often the visible presence of water above the ground where the pipe is buried. The volume of loss depends largely on the characteristics of the pipe network and is also affected by the leak detection and repair policy practiced by the water company [17].
In the most water distribution systems, a large portion of water is lost during transportation from treatment plant to consumers. As reported by international water supply association (IWSA) in 1991, the amount of water loss is typically in the range of 20-30% of production. The major contribution to this water loss is due to leakage; however, there have been a couple of exceptions where a meter under registration exceeded leakage in magnitude [18]. According to Lambert, [19] service connections can be a great source of leakage, often outweighing that from mains. An early study by Wolfe [20] offers a discussion of the contribution to leakage by service connections. The percentage of faults in any component of the network will differ; for example, most damage occurs in pipes (54%) followed by problems in other devices and fitting such as valves and pipe junctions [21]. Leaks in pipe networks are inevitable, and it is common for cities that to suffer from hundreds and even more than a thousand water main breaks each year. A large water utility may experience 300 or more water mains breaks a year or 30 breaks per 100 miles per year [11]. . As a comparison, the American Water Works Association (AWWA) reported that a reasonable goal for water systems in North America is 25 to 30 breaks per 100 miles of pipes per year [22].
1.5
Leak and public health risk
Water leakage is a pricey problem, not only in terms of wasting valuable natural resources but also in economics terms. The main economical loss caused by leakage is the cost of raw water, transportation and its treatment. In addition to environmental and economical losses due to leakage, leaky pipes also contribute to a public health risk as leaks are possible
11 access points for contaminants if a pressure drop occurs in the pipeline system [18]. Generally, the main goal of water provider is the provision of clean and safe water to taps of all customers; therefore, leaks in a water distribution system can increase the contamination of water that leaves the source or treatment facility before reaching the customer. Consequently, pipe leaks created a pathway for pathogen intrusion into the drinking water.
Sudden valve closures can create rapid changes in water velocity that result in transient pressure conditions. For long transmission mains, large pressure transients may occur. A pressure transient wave can create a very high pressure followed by a low (or even negative pressure), that can travel throughout the distribution pipeline and cause sub atmospheric pressures. In conjunction of submerged leaks and a low pressure wave passes through the pipeline; the contamination may take place [23]. Regular water distribution system operations can sometimes initiate pressure transients. Thus, pressure transients may happen frequently in certain water distribution systems.
The phenomenon of the pressure transient is illustrated in Figure 1-6. In this figure, it can be seen that change of flow in a cycle which starts from steady state to transient and again in a steady state. Moreover, the transient pressure wave oscillates between high and low pressure extremes. There are a number of adverse effects on the hydraulic system caused by the pressure transient [24].
12 In the hydraulic system, if the transient pressure is very high, the rate of the pressure rise can initiate failure through pipe or joint rupture, or bend and elbow. Excessive negative pressures can cause the pipeline to collapse or groundwater to be drawn into the distribution system. As a result, any pathogen that is present in the soil or outside water may enter in the pipeline system through the leak. Figure 1-7 shows possibly how the bacteria or virus outside the pipe may enter in the water supplies if the leaky water pipe laid next to a sewer pipe. Chemical contaminants such as pesticides, fertilizers, solvents, detergents and other compounds also could be introduced into the distribution system through the leak [25]. It will be badly affected if chemical compounds intrude in adequate concentration or volume. The details of potential for health risks from intrusion of contaminants into a water distribution system from pressure transients can be found in this report by the USA Environmental Protection Agency (EPA) [26].
Figure 1-7: Leaky water pipe lay next to a sewer pipe [25].
1.6
Consequence of leakage and water loss
There is about 340,000km including many of the underground pipes that have been laid for water distribution in England and Wales [27]. More than 1.8 billion litres or 12% per day of the water that companies put into a distribution network is lost due to leakage [27]. As a result, this figure will reflect a major, detrimental financial effect on water companies. Reduction in water loss not only allows water companies to provide reliable supply capacity while maintaining existing infrastructure. It also helps water company to decrease
13 their level of operation and maintenance costs, including energy cost, chemical cost, chemical treatment costs and other cost, which are a consequence of the water lost due to leaks. In addition to these, a pipe failure may also contribute to a county’s social costs, such as degradation of water quality due to contaminant intrusion caused by de-pressurising and disruption of water supplies to special facilities such as hospitals, schools and others [28]. Furthermore, if the failure is not identified and located shortly after it occurs, the harm to the surrounding infrastructure or property are prone to be the main contributors to overall cost of the pipe failure.
It has long been recognized that leakage in the water distribution systems requires the input of additional energy to maintain high service levels [29]. As recognised by CIWEM, [30] that a substantial amount of energy is employed to abstract, treat and pump potable water and consequently, leakage contributes to the carbon footprint of the water supply industry. The impact of leaks on energy use can be found from the energy grade line (EGL) as shown in Figure 1-9. As we can see from the figure, if there is no leak, the slope of EGL is consistent with the length of pipe as depicted by the solid sloping line. Consequently, when a concentrated leak presents the EGL line follows the broken line as shown in Figure 1-8. Pressure head must be modified when the leak is occurred in order to keep an appropriate pressure at the stream end of the pipe. This necessitates an increase in energy consumption and operating cost as the pumps must work harder [29].
14
1.7
Leakage solutions and control
Generally, leakage control may consist of several approaches and can be carried out using a variety of specific techniques to support a leakage management strategy. It can be directly influenced by infrastructure and pressure management and a programmed of active leakage control [31]. Active leakage control (ALC) refers to set of efforts and steps taken by the water utilities with special teams of dedicated staff to monitor the leakage level and repair and replace pipes as a routine activity. This includes regular survey and leakage monitoring in zones or sectors such as a district meter areas (DMA) monitoring and management [31]. The advantage of DMA monitoring permits the operational team to operate the system in a smaller area and therefore, obtain more precise demand prediction, leakage management and control to take place. On the other hand, repairing and replacing pipes only as a reaction to reported burst, leaks or a drop in pressure (usually reported by customers or noted by company staff during patrolling) can be referred to as passive leakage control (PLC). The adoption of PLC policy can minimize the day to day operating costs of leakage identification, but increases the risk of water being wasted. Meanwhile, in terms of up front cost, ALC could be an expensive approach; however high operating costs over time must unavoidably justify some amount of active control in most systems. It also helps water companies to reduce the capital expenditure requirement on treatment works, reservoirs and mains.
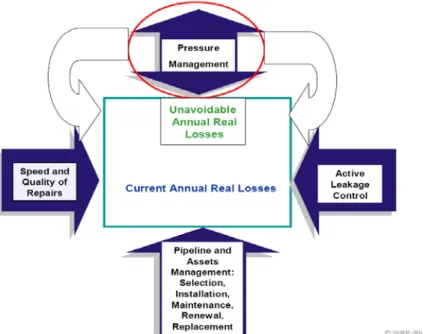
Pressure management is one of the primary elements of well organizing of hydraulic system and more recently has been very successfully introduced in many countries as an operational tool for leakage management strategy. Any excessive change in operating pressure may create a leak in the pipeline network. The international water association (IWA) through its water loss task force promotes the use of a four components diagram for managing real losses as shown in Figure 1-9.
15 Figure 1-9: The four basic components of managing real losses, with secondary influence
of pressure management [32].
Figure 1-9 shows that pressure management has a major influence on the other component, as the reduction of excess pressures and surges to usually reduce the number of new leaks. In this figure, the current annual real losses (CARL) are illustrated by large square which is proportional with increasing the age of pipe and new leaks. The difference between unavoidable annual real losses (UARL) in the small rectangle and CARL is the potentially recoverable real losses [31]. Pressure management is best undertaken along with leak detection programs and ALC. Good pressure management not only assures higher level of service and reduces the occurrence of leaks in pipeline networks, but will also result in more stable pressures, causing less strain on the pipe network and fewer prospects of fatigue damage at joints.
In general, it is vital that maximum operating pressure for a pipe network is clearly specified because drastically increase in pressure contributes to increase leakage and may lead to damage equipment used in the system. It should be compatible with the nominal maximum pressure of conduits and other devices while the minimum limit established with the purpose of preventing any contamination of drinking water caused by the occurrence of sub atmospheric pressures in the system [21]. Many pressure management programs focus on the smaller mains, thus allowing a reduction of losses in a selected area while allowing normal system pressure in the larger trunk or transmission lines. Reservoirs are usually connected with the larger pipes, so there should not in many cases be a problem. It is found
16 that most non visible leakage tends to occur on the smaller pipes and service connections; therefore, the efficacy of a prospective pressure management program should not be reduced drastically by the exclusion of larger pipes in the control area [18]. As reported by Thorthon and Lambert [32], pressure management programs frequently have positive impacts on revenue recovery and apparent loss reduction, especially in relation to theft and authorized unbilled consumption.
1.8
Leakage Detection
As discussed above, leak detection is an essential tool for the management of water distribution systems around the globe. Accurate pinpointing of the location of leaks in water pipes within a supply system and subsequent repair serves to prevent water loss and to conserve energy. Water that is lost after treatment and pressurization, but before delivery to customers, is money and energy wasted [33]. For large size of leakage, highly evident leaks are frequently reported by the public. While for the smaller sizes of leak, fewer evident causes, such as at a meter or valve, may go unreported. In general, for the non visible leaks, various techniques exist for the use of leak determination and location. Different methods for leak detection with different applicability and limitation have been proposed in some form presumably for as long as the interest in limiting water loss and public health risk.
1.9
Summary
This first chapter focused on the various issues related to the status of water and different factors, which are affected the loss of water in a distribution system. The leakage is unavoidable in water distribution systems as many pipelines were laid a long time ago with some of them existing since ancient times and are now in poor condition. The past few years have witnessed a heightened special concern by water authority with emphasis on the conservation of natural resources regarding the water loss resulting from leaks and burst. They have implemented several techniques to support leakage management strategy. The occurrence of leaks in all piping systems happens for many different reasons; it could be extreme pressure, pipe's material, age of pipes, third party involvement, etc. Water loss due to leak is a major financial cost to water companies. It also contributes to public health
17 risks. Many water companies utilize different methods to determine and locate the leaks. A review of leak detection techniques is presented in the Chapter 2.
1.10
Research scope and objectives
Water distribution systems are made of a very big array of pipes and boundary devices. They have been many techniques available for leaks detection and location in pipeline systems. Interestingly, the fundamentals of leak detection have changed very little and most of the established methods are still in use today. Research and improvements in technology, however, have rendered several of these methods more effective. One of them is the use of information regarding transient phenomena in pipelines and signal processing techniques to detect the occurrence of leaks and determine the location of leaks. Generally, there are many components in the pipeline system, and a transient within a network may be reflected by several sources, making the problem very difficult to characterize. A large degree of noise also associated with measurement appears to make the signal more complicated to analyse. Therefore, the solution of these problems must be robust with respect to noisy systems and be able to remove them without losing the original signal. In addition the method proposed must not require the closure of the pipeline operation during testing. The aim of this project is to utilise advanced signal processing techniques to identify the location of the features in the pipeline network, particularly leaks, through the analysis of the corresponding pressure time response signal obtained through a single sensing device. The level of success of this method is closely related to the accuracy of the position of the leak in the laboratory experimental works and real position in a pipe for real water distribution systems.
1.11
Thesis organization
The thesis is organized in eight chapters. Chapter 2 reviewed the different methods of leak detection and location as well as their advantageous and disadvantageous. Chapter 3 contains the description of wave propagation in pipeline and the effect of some features such as leakage on the pressure wave. The effect of noise in the pipeline system also discussed. Chapter 4 focuses on description of the signal decomposition methodologies based on Fourier transform, Short Time Fourier Transform (STFT), Wavelet transform, Hilbert and Hilbert Huang transform as well advantageous and disadvantageous of them. In
18 this chapter, different methods of calculating instantaneous frequency together with cepstrum analysis with a related example are presented in order to find some feature in the signal. In Chapter 5 is given a numerical analysis based on transmission line modeling (TLM) technique of a simple pipeline and identify the leak location in this model. In this chapter, the effect of leak and outlet of pipe on the pressure wave by their instantaneous characteristics is presented. Chapter 6 presents an experiment work to detect a leak point in a big PVC pipeline which was installed in Civil engineering Lab. The results are compared with the simulation analysis. Chapter 7 presents a different test on a real system area for Yorkshire water. The three different locations are studied herein with the principal focus on the analysed and compared different method of calculating instantaneous frequency. Chapter 8 contains the main conclusions of this research work and recommendation for further research.
19
Chapter 2
Review of Leak Detection Techniques
2.1 Introduction
In modern society, pipeline networks are an essential mode of transporting fluid from one place to another. The large quantities of water transported means that a small percentage loss can give rise to events with considerable economic impact, the environmental burden associated with wasted energy, and potential risks to public health. The leak may occur due to aging pipelines, corrosion, excessive pressure resulting from operational error and closing or opening valves rapidly. In some countries like Germany and Australia, their water distribution system pipeline networks are more than 50 years old. As pipe ages, the failure levels increase and consequently, the level of unaccounted for water (UFW) and the associated lost revenue can also increase due to water leakage. In 1991, a survey of global water loss conducted by the International Water Supply Association (IWSA) revealed that losses from water distribution networks in most countries typically range from 20% to 30% [34]. Whereas, in a well maintained system such as in the Netherlands, the average water loss in the public water network is about 3-7% [35]. Meanwhile, the percentage of loss could be as high as 50% in some developed country and less well maintained system [36]. Eliminating leakage altogether would be virtually impossible and enormously expensive. Therefore, the development and implementation of an organized leakage control policy are one of the possible ways to reduce the leakage rates. In order to prevent further loss and public risk many techniques with different applicability have been proposed. Systematic leakage control programs have two main components, which are water audits and leak detection surveys. Water audits are concerned with measuring water in and out of the water distribution system and this helps to identify which segment and portion of pipe the network has leaks. However, it does not provide any information about the exact location
20 of the leak in the pipeline. So to identify the correct location of the leak, a leak detection survey must be undertaken.
Ofwat, the UK water services regulation authority, set a target based on the level of leakage at which it could cost more to make further reductions than to produce the water from another source [37]. Generally, costs associated with the leakage include:
• Pumping, treating and transporting clean water, which can inevitably result in significant economic loss.
• Reduction of pressure in a distribution system due to leakage, with associated energy costs and poor service delivery.
• Fines for companies with high levels of leakage, subject to action from the industry regulators.
In the recent decades, as reported by Ofwat [38] it is estimated that the water companies in the UK may lose about a million of cubic meter a day due to leaks. In water distribution systems in the UK, the levels of the leak rose between 1992-93 and 1994-95, but since then have fallen. These changes can be seen as shown in Figure 2-1.
Figure 2-1: Estimated total leak by water companies [38].
Moreover, reduction in leakage helps the water companies to reduce the amount of water that they need to put into their distribution system to meet customer demands. Consequently, reduction in leakage also improved the water companies ability to meet
21 customer demands during dry years without implement any restrictions on water use such as hosepipe bans. The water companies with high levels of leakage may also suffer from a poor public image which has consequences when encouraging customers to save water or pay for it at a high rate in order to fund necessary investment. In the longer term, a water company will face further pressure in order to reduce the quantity of water lost due to leakage because of the impact of climate change, population growth and increasingly tight regulation. Leak reduction can be efficiently implemented by fixing specific leaks. However, the position of leakage from pipes is unpredictable since most pipeline systems are buried underground.
2.2 Leakage detection techniques
A described above, with increasing demand for fresh water from the public and industry; the water companies need to increase the efficiency of their distribution systems. As a result, over the past centuries, engineers and researchers have developed a large number of leak detection techniques in order to solve the leakage problem. The historical appearance of leakage methodologies adapted from [39] is given in Figure 2-2:
Figure 2-2: Several leak detection methods by historical appearance [39].
Historically, leak detection was based on listening, which has been use since the 1850s. This method involved using a wooden listening rod which was placed on all the accessible
22 contact points with distribution system and fittings such as main valves or hydrants. Such listening rods are simple sound transmitters, which detect the sound induced by water leaking from pressurized pipes, similar to a doctor listening to a heartbeat through a stethoscope. On the detection of a noise, suspected leaks are pinpointed by listening on the surface of the ground directly above the pipe at small intervals along it. The using of traditional methods such as listening device is usually straightforward and low cost. However, it is time consuming process and its effectiveness is questionable, as often leakage inspectors wasted time looking for leaks in the wrong place. Furthermore, it was also inappropriate to use for non metallic pipes such as asbestos cement, as sound does not travel along them.
In the late 1970s, leak location improved with the development of the leak noise correlator. Its concept is similar to the previous method which relied upon the noise generated by the leak in the buried pipes. The fundamental difference, however, is that with a correlator, the noise of the leak is picked up by sensors, which are installed in two different locations such as hydrants in the pipeline either side of the leak. The time delay of the noise made by the leak between the two sensors, coupled with the knowledge of the pipe material, diameter and length enable one to identify the leak location precisely. In the following 20 years, the size and efficiency of correlator system have been improved. Previously, the equipment took about two men half a day to locate the leak; now a modern device can do the same work in minutes.
Meanwhile, in the 1980s the monitoring of leak detection was introduced [39]. In the leakage monitoring system, a network is divided into discrete sector or districts each known as a District Meter Area (DMA) which covers between 1500 and 3000 connections. A DMA requires the installation of the flow meters at important points throughout the distribution system to record the flow into each district sector. So that, the night flows into each district can be regularly or continuously monitored. This data can be compared with the legitimate usage flow to give an amount of the leak flow. If the difference between the night flow and the legitimate usage flow is close to zero this means that the leakage is negligible. Therefore, unusual changes in flow can be detected. For the operator experienced with the water system, the flow decrease can then be used to determine whether this is due to new leaks or not.
23 Generally, any practical leak detection technique should work with minimal interference during the normal operation processes and be inexpensive to deploy [40]. As a result, leak detection and location methods play a key role in the overall integrity management of a pipeline system. Methods of leak detection can be classified from very simple methods to complex systems using sensitive measuring equipment and trained personnel.
Leak detection and location in the water distribution system based on pressure change and/or discharge has been as a vital research topic both for academics and industry. The current methods can generally be divided into two large groups- internal and external. In addition to these two groups, the transient-based analysis methods are also reviewed here. Despite the existence of a large number of available leak detection techniques, none of them has been totally successful and reliable in all leak detection cases and most are poor. Because they can be imprecise and time consuming or are just suitable for limited segment of pipeline [41]. Ideally, pipeline operators and owners seek a simple, robust and highly accurate method to locate leaks in pipeline systems [42].
2.2.1 Leak detection based on external methods.
The external methods for leak detection and location detects the present of leaks from outside the pipeline by visual observation or by using appropriate equipment. Typically, most of these methods have been used to detect and locate the leaks, and not properly to quantify the leak. Examples of this method are visual observation, acoustic leak detection, tracer gas method, video inspection, infra-red thermography and ground penetrating radar (GPR).
2.2.1.1 Visual observation
Visual observation is a traditional and also the simplest method to detect leaks. This can be done by experienced personnel who detect and locate the leaks either by flying, driving or walking along the pipeline, searching for abnormal patterns near the pipeline or listening to the noises generated by product escaping from a hole. The effectiveness of this technique depends on experience of the operator, size of the leak and the inspection frequency. For
24 some products, this technique can also involve the use of trained dogs, which are sensitive to the smell substances which could be released from the pipeline [43].
2.2.1.2 Tracer injection
The principle of this technique is that a non-toxic, water insoluble and lighter than air gas such as helium or hydrogen is injected into the pipe system [44]. In case of a leak, highly sensitive gas detectors can be used to identify the location of the gas escape through the leak opening which will penetrate the ground surface. The detection of the leakage using this technique gives high accuracy. In addition, it can be used in any containment pipe networks (water, gas, etc.), and also it can be used to detect leaks at any stage in the life of the landfill. On the other hand, tracer gas methodology is widely used for the machinery testing [45], but the high time consumption and high cost, prevent this method to be used for everyday leak inspections in the pipeline. Furthermore, this method does not usually find the location of the leak and also the size of the leak cannot be estimated.
2.2.1.3 Thermography
The infrared thermography method based on detecting the temperature differences between the surroundings and piping systems. This method can be carried out using either an aircraft or a helicopter over flying the area or by using a specially equipped vehicle. Using special imaging equipment such as infra red cameras, a thermal signature of the pipes can be observed. This method is used for analyzing underground pipes. The thermal characteristics of soil adjacent to the pipe with a leak have larger heat sink compared with a pipe without a leak. Infra red scanners are used to identify thermal anomalies above the pipes [44]. Computer analyses of these images improve the accuracy and speed testing. One of the advantages of this technique is that it can cover large areas without excavation. The limitation of the method is that it can be used only with pipe systems with liquid or gas that has a higher temperature than its surroundings, for example, pipeline systems of hot water or steam. A number of factors may affect the capability of this method, for instance: ambient temperature, solar radiation, cloud cover and surface conditions of the test area [18].
![Figure 1-1: Example of the structure for water supply system [3].](https://thumb-us.123doks.com/thumbv2/123dok_us/9036258.2801437/23.918.188.829.586.834/figure-example-structure-water-supply.webp)
![Figure 1-4: Different types of pipe failure[11] (a) Circumferential cracking; (b) Longitudinal cracking; (c) Bell splitting; (d) Bell shearing; (e) Blow out holes; (f) Spiral](https://thumb-us.123doks.com/thumbv2/123dok_us/9036258.2801437/28.918.263.741.85.450/figure-different-circumferential-cracking-longitudinal-cracking-splitting-shearing.webp)