• No results found

Archimer

N/A
N/A
Protected

Academic year: 2021

Share "Archimer"

Copied!
67
0
0

Loading.... (view fulltext now)

Full text

(1)

Please note that this is an author

-produced PDF of an article accepted for publication following peer review. The definitive publis

her

-authenticated version

is available on the publisher Web site

1

Science

December 2011, vol. 334 (6063), pp. 1703-1706

http://dx.doi.org/10.1126/science.1212928

© 2012 American Association for the Advancement of

Science. All Rights Reserved.

Archimer

http://archimer.ifremer.fr

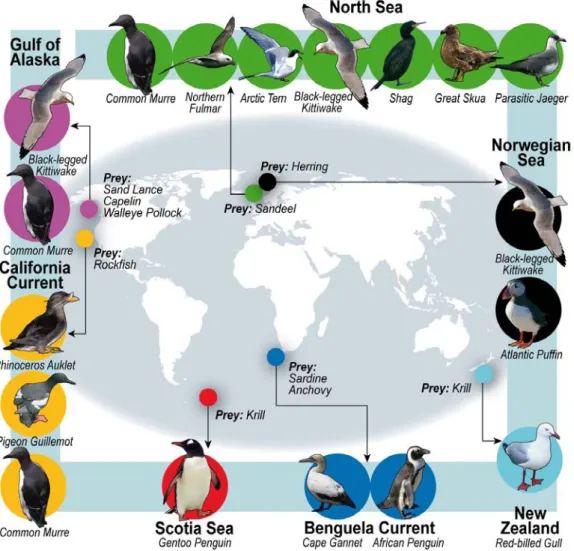
Global Seabird Response to Forage Fish Depletion—One-Third for the

Birds

Philippe M. Cury

1,*

, Ian L. Boyd

2,*

, Sylvain Bonhommeau

3

, Tycho Anker-Nilssen

4

,

Robert J. M. Crawford

5

, Robert W. Furness

6

, James A. Mills

7

, Eugene J. Murphy

8

, Henrik Österblom

9

,

Michelle Paleczny

10

, John F. Piatt

11

, Jean-Paul Roux

12,13

, Lynne Shannon

14

, William J. Sydeman

15

1

Institut de Recherche pour le Développement, UMR EME-212, Centre de Recherche Halieutique

Méditerranéenne et Tropicale, Avenue Jean Monnet, BP 171, 34203 Sète Cedex, France.

2

Scottish Oceans Institute, University of St Andrews, St Andrews KY16 8LB, UK.

3

Ifremer, UMR EME 212, Centre de Recherche Halieutique Méditerranéenne et Tropicale, Avenue Jean Monnet,

BP 171, 34203 Sète Cedex, France.

4

Norwegian Institute for Nature Research, Post Office Box 5685 Sluppen, NO-7485 Trondheim, Norway.

5

Branch Oceans and Coasts, Department of Environmental Affairs, Private Bag X2, Rogge Bay 8012, South

Africa.

6

College of Medical, Veterinary and Life Sciences, University of Glasgow, Glasgow G12 8QQ, UK.

7

10527 A Skyline Drive, Corning, NY 14830, USA.

8

British Antarctic Survey, High Cross, Madingley Road, Cambridge CB3 0ET, UK.

9

Baltic Nest Institute, Stockholm Resilience Centre, Stockholm University, SE-106 91 Stockholm, Sweden.

10

Fisheries Centre, Aquatic Ecosystems Research Laboratory (AERL), 2202 Main Mall, The University of British

Columbia, Vancouver, BC, Canada V6T 1Z4.

11

U.S. Geological Survey, Alaska Science Center, 4210 University Drive, Anchorage, AK 99508, USA.

12

Ecosystem Analysis Section, Ministry of Fisheries and Marine Resources, Lüderitz Marine Research, Post

Office Box 394, Lüderitz, Namibia.

13

Animal Demography Unit, Zoology Department, University of Cape Town, Private Bag X3, Rondebosch, Cape

Town 7701, South Africa.

14

Marine Research Institute and Zoology Department, University of Cape Town, Private Bag X3, Rondebosch,

Cape Town 7701, South Africa.

15

Farallon Institute for Advanced Ecosystem Research, Post Office Box 750756 Petaluma, CA 94952, USA.

*: Corresponding authors : Philippe M. Cury, email address :

[email protected]

; Ian L. Boyd, email address :

[email protected]

Abstract :

Determining the form of key predator-prey relationships is critical for understanding marine ecosystem

dynamics. Using a comprehensive global database, we quantified the effect of fluctuations in food

abundance on seabird breeding success. We identified a threshold in prey (fish and krill, termed

“forage fish”) abundance below which seabirds experience consistently reduced and more variable

productivity. This response was common to all seven ecosystems and 14 bird species examined within

the Atlantic, Pacific, and Southern Oceans. The threshold approximated one-third of the maximum

prey biomass observed in long-term studies. This provides an indicator of the minimal forage fish

biomass needed to sustain seabird productivity over the long term.

(2)

Please note that this is an author

-produced PDF of an article accepted for publication following peer review. The definitive publis

her

-authenticated version

is available on the publisher Web site

2

Introduction

Public and scientific appreciation for the role of top predators in marine ecosystems has

grown considerably, yet many upper trophic level (UTL) species, including seabirds, marine

mammals and large predatory fish, remain depleted owing to human activities (

1-4

).

Fisheries impacts include direct mortality of exploited species and the more subtle effects of

altering trophic pathways and the functioning of marine ecosystem (

5

). Specifically, fisheries

for lower trophic level (LTL) species, primarily small coastal pelagic fish (e.g. anchovies and

sardines), euphausiid crustaceans (krill) and squid (hereafter referred to as

“forage fish”),

threaten the future sustainability of UTL predators in marine ecosystems (

6, 7

). An increasing

global demand for protein and marine oils contributes pressure to catch more LTL species

(

8

). Thus, fisheries for LTL species are likely to increase while the consequences of such

activity remain largely unknown at ecosystem scale. It remains challenging, however, to

assess fishing impacts on food webs because numerical relationships between predators

and prey are often unknown, even for commercially valuable fish (

9, 10

). Ecosystem models

and ecosystem-based fisheries management, for which maintaining predator populations is

an objective (

2,

11, 12

), will remain controversial until these relationships are more fully

quantified.

To improve our understanding of the effects of LTL fisheries on marine ecosystems, more

information on predator-prey relationships across a range of species and ecosystems is

required (

6

). Seabirds are conspicuous members of global marine ecosystems. Many

aspects of seabird ecology have been measured consistently for decades, encompassing

ecosystem change at multiple scales (

13

). Though substantial long-term datasets on seabird

breeding success have been compiled for many taxa in several marine

(3)

ecosystems around the world (

14-16

), for relatively few has independent

information on prey availability been concurrently obtained. For those where

prey data are available, temporal covariance in predator and prey parameters

suggests that seabirds can be used as indicators of forage fish population

fluctuations (

7

,

16

,

17

). In the present study we use data collected

contemporaneously over multiple decades from seabirds and forage fish to

test the hypothesis that the form of the numerical response between seabird

breeding success and forage fish abundance is consistent across species and

ecosystems. Data were selected based on the duration of the time series for

both seabirds and forage fish, and high spatial and temporal congruence

between the seabird data and the fish population data. Seabirds with strong

dependencies on the monitored forage fish population were selected. We

compiled data from 19 time-series covering 7 marine ecosystems, 9 sites and

14 seabird species and their major prey (Fig. 1, Table S1). The dataset

included 438 data points spanning 15-47 colony-years per breeding site (Table

S1). The abundance of principal prey for each seabird species was estimated

independently of the data collected for the birds, usually as part of population

assessments conducted in support of fisheries management (Table S1).

(4)

Fig. 1.

Map of the distribution of seabird and prey species considered in our

analysis.

To examine empirical relationships between seabird breeding success and

prey abundance, we used non-parametric statistical methods that facilitate

non-linear modeling by making no

a priori

assumptions about the form of the

relationships (Generalized Additive Models or GAMs). Initially, each

time-series (seabird breeding success and prey abundance) was normalized by

expressing the measurements as the number of standard deviations from the

mean; this enables robust comparisons across species and ecosystems. Once

the numerical relationship was established, we used a change-point analysis

(sequential t-tests that find the most likely point at which the slope of breeding

success changes in relation to prey abundance) to identify thresholds within

non-linear relationships (

18

, Fig. 2A). A bootstrap analysis was used to

calculate confidence intervals of the threshold and the variance in seabird

(5)

breeding success was calculated for each prey abundance class. Last, a

selection of

a priori

parametric models ranging from linear, sigmoid,

asymptotic to hierarchical (Table S2) was fitted to the general relationship. The

most parsimonious model was then used to fit the relationship between

seabird breeding success and forage fish population size for each ecosystem

(pooling all species) and each seabird species (pooling all ecosystems).

Across ecosystems, seabird breeding success showed a non-linear response

to changes in prey abundance (Fig. 2A). The threshold at which breeding

success began to decline from the asymptote was not significantly different

from the long-term mean of prey abundance (range -0.30 and +0.13 standard

deviation of the mean, Fig. 2A). The threshold was 34.6% (95% confidence

interval 31% to 39%), or approximately one-third of the maximum observed

prey abundance. The coefficient of variation between the different thresholds

among species and ecosystems was 28% (Table S1). All time series were of

sufficient duration to identify the threshold (detection is possible after 13 years

of observation, Fig. S1) and the maximum biomass (detection is possible after

11 years, Fig. S2). Variance in breeding success increased significantly

(F-test, p<10

-4

) below the threshold of prey abundance (Fig. 2B). Fitting

parametric models to individual responses showed that there was a similar

inflection point and asymptotic values across ecosystems and species (Fig.

2C, Fig. 2D, Fig. 3), indicating that the functional form was a general feature of

the seabird–forage fish relationship.

(6)

Fig. 2.

(A) Relationship between normalized annual breeding success of

seabirds and normalized prey abundance. Each data point from all the time

series was plotted with the predictions of a Generalized Additive Model (GAM)

(solid line). The grey area represents the 95% confidence interval of the fitted

GAM. The threshold in the non-linear relationship (black solid vertical line) and

its 95% confidence interval (black dashed vertical lines) were detected from a

change-point analysis. (B) Change in variance across the range of normalized

food abundance ranging from -1.5 to 2 standard deviations in 8 classes.

(7)

Variance below the threshold was 1.8 times higher than above it. (C) Similar

relationships were present when data were pooled for species within

ecosystems and (D) for species pooled among ecosystems using the

best-fitting asymptotic model (Table S2). The Arctic Tern (not shown) model fit was

not significant (Table S1). Note that the colors in (A) and (C) represent the

dataset for each ecosystem and in (D) for each seabird species.

Fig. 3.

Relationship between normalized annual breeding success of pooled

seabird species and normalized prey abundance for the seven different

ecosystems using the most parsimonious asymptotic model (Table S2).

The asymptotic form of the relationship between seabird breeding success

and forage fish abundance has been reported previously (

15, 16, 19-24

), but

(8)

the common scaling across species and ecosystems and the consistency of

threshold values are new observations. The global pattern shows a threshold

below which the numerical response declines strongly as food abundance

decreases and above which it reaches a plateau and does not change even as

food abundance increases. This pattern is apparently robust to the varying life

history strategies, habitat preferences, and population sizes of the seabird

species considered. Nonetheless, we acknowledge that a range of factors may

interact to weaken or possibly accentuate the relationship between seabird

breeding performance and prey species abundance. Alternative drivers of

change in breeding success include changes in habitat characteristics or

predation pressures, or complex inter-colony dynamics. Predators may also

show more or less capacity to switch to alternative prey items, which may

buffer productivity or other parameters against declines in any single prey

species (

25

)

.

Periods of consistently high or low breeding success, or occasional complete

breeding failures, are normal in seabirds and most species are adapted to

fleeting anomalous environmental conditions. However, chronic food scarcity,

as potentially defined by prey abundance below the threshold described here

for seabirds, could compromise long-term breeding success, and eventually

affect recruitment with population consequences. Thus food scarcity that could

result from chronic over-exploitation reduces adult survival in seabirds

(26),

with immediate population-level impacts. Whether caused by persistent

overfishing, or directional or stochastic environmental change that reduces

ecosystem carrying capacity, recruitment and survival will probably have

thresholds of prey abundance shifted to the left of that for breeding success

(

15, 16

). Consequently, the threshold for breeding success is likely to provide

a precautionary guideline to what level of food reduction might seriously

impact seabird populations.

The threshold defined by our study suggests that if management objectives

include balancing predator-prey interactions to sustain healthy UTL predator

populations and ecosystem functions (

2

), a practical indicator would be to

(9)

maintain forage fish biomass above one-third of the maximum observed

long-term biomass. The application of such a management guideline will depend

upon local circumstances, such as the need to implement spatial management

around breeding colonies or the conservation status of species (

27

). Although

we cannot assume similarity between all taxa in the value of the predator-prey

threshold, our study demonstrates consistency among a broad range of

seabirds. There exists also evidence that some marine mammals and

predatory fish share the general form of the relationship (

17, 19, 25, 28

).

Tuning management goals to ensure sufficient biomass of forage fish for

seabird reproduction may be a useful step towards ensuring sustainability of

predator-prey interactions for other, less well-studied predators in marine

ecosystems. Even for predators not showing high dependency on exploited

species, this is likely to provide a precautionary step. The "one-third for the

birds" guiding principle could be applied widely to help manage forage

fisheries to benefit ecosystem resilience. Indeed, predator responses of this

type are already included in some specific management systems (

29

). While

such a guideline might be difficult for new fisheries, where there are few data

to determine the maximum biomass, most of the economically important

coastal pelagic fish populations have sufficient data to define the threshold in

many ecosystems (e.g. in the Benguela, California and Humboldt Currents)

(Fig. S1, Fig. S2).

The generality of the asymptotic form of the predator-prey relationship

suggests that it is rooted in fundamental life history and ecological theory (e.g.

demographic trade-offs and functional responses). In a practical context,

“one-third for the birds” is a simple, empirically-derived guiding principle that

embraces the ecosystem approach to management aimed at sustaining the

integrity of predator-prey interactions and marine food webs for the benefit of

both natural predators and humans.

References and Notes

(10)

2.

E. K. Pikitch

et al.,

Science

305

, 346 (2004).

3.

H. K. Lotze, B. Worm,

Trends Ecol. Evol.

24,

254 (2009).

4.

M. Hoffmann

et al.,

Science

330

, 1503 (2010).

5.

M. Coll

et al., PLoS One

3 (12),

e3881 (2008).

6.

A. D. M. Smith

et al., Science

333

, 1147 (2011)

7.

P. Cury

et al.,

ICES J. Mar. Sci.

57

, 603 (2000).

8.

R. L. Naylor

et al.

,

PNAS

106

, 1510 (2009).

9.

P. A. Abrams, L. R. Ginzburg,

Trends Ecol. Evol.

15

, 337 (2000).

10.

L. C. Stige

et al.,

Proc. R. Soc. London

277

, 3411 (2010).

11.

H. M. Pereira

et al.,

Science

330

, 1496 (2010).

12.

T. P. Dawson,

et al

.,

Science

332

, 53 (2011).

13.

R. D. Wooller et al.,

Trends Ecol. Evol.

7

, 111 (1992).

14.

R. W. Furness, K. Camphuysen,

ICES J. Mar. Sci

.

54

, 726 (1997).

15.

D. K. Cairns.

Biol. Oceanogr.

5

, 261 (1987).

16.

J. F. Piatt

et al.

,

Mar. Ecol. Prog. Ser.

352,

221 (2007).

17.

I. L. Boyd,

Aquat. Conser.

12

, 119 (2002).

18.

T. Andersen

et al

.,

Trends Ecol. Evol.

24

, 49 (2008).

19.

I. L. Boyd, A. W. A. Murray,

J. Anim. Ecol.

70

, 747 (2001).

20.

J. M. Durant

et al., Proc. R. Soc. Lond. B

270

, 1461 (2003).

21.

K. Reid

et al.

ICES J. Mar. Sci.

62

, 366 (2005).

22.

R.W. Furness,

J. Ornithol.

148

, S247 (2007).

23.

J. A. Mills

et al

.,

J. Anim. Ecol

.

77

, 1129 (2008).

24.

J. C. Field

et al

.,

Current. Ecol. Appl.

20

, 2223 (2010).

25.

M. E. Hunsicker,

et al.

,

Ecol. Lett.

doi:10.1111/j.1461-0248.2011.01696.x (2011

).

26.

A.S. Kitaysky

et al

.,

Ecology

,

24

625 (2010).

27.

L. Pichegru

et al

.,

Biol. Lett.

6

, 498 (2010).

28.

J. F. Piatt, D.A. Methven,

Mar. Ecol. Prog. Ser

.

84

, 205 (1992).

29.

D.J. Agnew.

Antarct, Sci.

9

, 235 (1997).

Acknowledgments: This work was partly funded by Eur-Oceans Consortium,

the Institut de Recherche pour le Développement, the Lenfest Forage Fish

Task Force, the Swedish Environmental Protection Agency, the Sea Around

us Project and by the South African Research Chair Initiative. All supporting

(11)

institutions and collaborators are acknowledged in the SOM. Data and

methods that are used can be accessed through a web site referenced in the

SOM.

(12)

Supporting Online Material for

Global seabird response to forage fish depletion – one-third for the birds

Philippe M. Cury, Ian L. Boyd, Sylvain Bonhommeau, Tycho Anker-Nilssen,

Robert J.M. Crawford, Robert W. Furness, James A. Mills, Eugene J. Murphy,

Henrik Österblom, Michelle Paleczny, John F. Piatt, Jean-Paul Roux, Lynne

Shannon and William J. Sydeman

(13)

Supporting Online Material

Contents

Materials and Methods

1. Data set: times series used and narrative description of seabirds and

their prey in the different marine ecosystems (table S1)

2. Statistical methods, threshold determination and model fitting

a. Empirical analyses of the dataset: tests of normality and pooling

data across ecosystems

b. Testing alternative forms of the global (asymptotic) model using

parametric models (table S2)

Figures S1-S4

Figure S1: Number of years of observation required for estimating the

threshold.

Figure S2: Number of years of observation required to evaluate the maximum

observed biomass.

Figure S3: Generalized Additive Mixed Model (GAMM) analysis to account for

the ‘ecosystem effect’ in the relationship between breeding success and prey

abundance.

Figure S4: Quantile GAM analysis to account for extreme values of the

relationship between breeding success and prey abundance.

Tables S1-S2

Table S1 – Time-series used in the meta-analysis

Table S2 – Parametric models considered for the predator-prey relationship

References and Notes

(14)

1. Data set: narrative description of seabirds and their prey in the

different marine ecosystems (table S1)

A total of 19 time series from 7 ecosystems and 14 seabird species was used

in the present analysis (table S1). Data are available at the end of the SOM.

Time series were selected based upon the following procedure and criteria

during a first workshop held in Sète (France):

1. The time-series was of sufficient duration (> 10 years or “bird years”).

2. The time-series was representative of an ecosystem.

3. The variables were collected using comparable methods resulting in

comparable metrics (i.e. breeding success expressed as the number of

fledglings per pair and prey abundance estimated using biomass or

density)

4. There were reliable data about the populations of the main prey species of

the predator concerned and these were collected, independently from

seabird data, but at similar spatial and temporal scales.

5. The seabird species involved were known, either directly or indirectly, to

depend upon the abundance of low-trophic level species during

reproduction. The case of indirect dependence included kleptoparasitic

species (such as skuas) and species that feed substantially on discarded

fish. In most studies, predation impacted fledging success to some extent.

However, in the case of Western Gull (

Larus

occidentalis)

studied in the

Californian Current, excessive predation was the main factor determining

breeding success rather than food, so we excluded this population from the

analysis in order to avoid misinterpretation about causal links.

During the second and final workshop held in Cape Town (South Africa) the

selected database was analyzed using the different statistical methods

presented below.

The following are descriptions of the data sets classified by region:

Gulf of Alaska – Cook Inlet

Alaska’s marine waters support more than 100 million seabirds (

30

). In the

Gulf of Alaska, seabird colony populations have fluctuated widely in recent

decades and declined markedly at a few sites (

31

). The

Exxon Valdez

oil spill

(EVOS) of 1989 had an immediate and lingering impact on some species of

seabirds (

32, 33

), adding to other anthropogenic factors influencing

populations (e.g., gill-net by-catch, fisheries removals, introduced predators)

(

30

). Variability in the marine environment, however, had an even greater

impact on seabird populations in the Gulf of Alaska during the same period.

Most notably, a major regime shift occurred in the late 1970s, causing marked

changes in oceanography, plankton production, marine fish communities and

diets of marine birds and mammals, leading to reproductive failures and

population declines at some colonies (

33

,

34

). In particular, populations of

small forage fish species, with high energy density, such as capelin (

Mallotus

(15)

villosus

) declined precipitously, while populations of forage fish species having

lower energy density (0-age class), such as walleye pollock (

Theragra

chalcogramma

) and cod (

Gadus macrocephalus

), increased and this change

was reflected in the diets of seabirds (

33

,

35

). These population fluctuations of

forage fish populations could not be explained by direct effects of fisheries,

because most declining forage species such as capelin were never harvested

in Alaska, and a few species such as pollock increased for environmental

reasons (

34

,

35

).

Ecosystem studies were initiated a few years after the EVOS to assess

whether environmental conditions that persisted after the climate-induced

regime shift could delay the recovery of seabirds from impacts of the EVOS.

In particular, a hypothesis was advanced that food stress brought on by

climate change might limit seabird reproductive success. In lower Cook Inlet,

Alaska, a natural experiment was devised to examine the response of

seabirds to fluctuations in prey density around three neighboring colonies (

36

)

and determine the prey density threshold for breeding success. Historical

studies had shown that food supplies and breeding success of common

murres (CM,

Uria aalge

) and Black-legged Kittiwakes (BK,

Rissa tridactyla

)

were poor at Chisik Island, excellent at Gull Island, and average at the Barren

Islands (

16

). Oceanography, plankton, forage fish ecology and seabird

distribution at sea were studied in waters around each colony (e.g.,

16, 37–

39

). Absolute forage fish abundance was measured by echo-integration of the

hydroacoustic biomass, after adjusting for catch composition and target

strengths of forage species in mid-water trawl catches (

16, 40

). Seabird

foraging behavior, diets, time-budgets, chick growth rates, physiological

condition, reproductive success, population trends and adult survival rates

were measured concurrently at each of the three colonies (e.g.,

16, 37, 41,

42

).

These studies revealed that diets of murres and kittiwakes were broadly

similar within and among colonies, and reflected the relative abundance of

forage species in marine waters around each colony (

26, 36, 38–42

). Diets of

adults were composed largely of oily schooling fishes such as Pacific sand

lance (

Ammodytes hexapterus

; CM 47%, BK 51%) and osmerids such as

capelin (CM 24%, BK 18%), and to a lesser extent of gadids such as pollock

(CM 20%, BK 14%). In contrast to some of the other studies reported below,

there were no major changes between years in diet composition or in relative

fish community composition around each colony. However, as expected,

forage fishes were consistently 1–2 orders of magnitude less abundant

around Chisik, and most abundant around Gull Island during each year of

study. Seabirds at all colonies responded to variation in prey abundance

among years not by switching to alternate prey, but by reducing rates of food

delivery to chicks, thereby reducing breeding success (

16, 26, 41–42

). In

general, the response in seabird foraging behaviors and reproductive success

to spatio-temporal variability in food supplies was non-linear (

16

).

(16)

Norwegian Sea – Røst

Røst (67°30’N 12°00’E) is an offshore archipelago situated at the

south-western tip of the Lofoten Islands in North Norway. Its population of Atlantic

puffins (

Fratercula arctica

) is still one of the largest in the world, but decreased

from about 1.44 million to 410,000 breeding pairs over the 31-year period

1979–2010 (

43–46)

. As the survival of adult puffins at Røst is not different

from that at other European colonies, which have not shown equivalent

declines (

47

), the decrease at Røst (72%) is attributed to the extraordinarily

poor breeding success of this colony, which includes 18 years of virtually

complete breeding failures since 1975 (

20, 44–46

). The breeding success has

been closely linked to the abundance, quality and timing of first-year herring

(

Clupea harengus

) from the Norwegian spring-spawning (NSS) stock, which

drift past Røst in summer on their way to their Barents Sea nursery areas (

20

,

48–50

). This herring stock collapsed in the late 1960s due to an extensive and

increasing fishery during a period of poor recruitment (

51

). The stock

remained at an extremely low level for two decades before it gradually rebuilt

its numbers. The recovery happened as a result of both strict regulations of

herring fishing and an improved ocean climate that increased the production

of strong year classes and later recruitment to the breeding stock (

52

). In the

only 11 seasons since 1975 with high breeding success (71%–96% of chicks

fledged) for the Røst puffins, first-year herring contributed an average of 56%

by mass of the chick diet, while non-schooling fish (mainly first-year Gadidae)

contributed 25%. In the seasons when breeding failed almost completely (0–

8% of chicks fledged), these proportions (when measurable) were reversed

(to 27% and 53% of first-year herring and mainly first-year Gadidae,

respectively, n = 12 years) (

44, 46)

. The availability of first-year herring also

explains much of the inter-annual variation in survival of breeding birds (

53–

55).

The 1.5 million pairs of puffins breeding in the western parts of North

Norway, where this herring is available in the breeding season, are able to

consume 5–15% of a reasonably good herring year-class (

56

). When

converted to newly metamorphosed fish in June–July, this corresponds to 15–

45 million metric tons of herring fry. The breeding success of puffins in Røst is

a good predictor of NSS herring year-class strength at the age 0 stage (

57

).

More than 90% of the black-legged kittiwakes (

Rissa tridactyla

) in Røst, the

second-most numerous seabird in the archipelago, breed in a colony that

decreased from about 25,000 pairs to 7,500 pairs over the same 31-year

period (

44

,

46

). Since 2007, based on regurgitations collected annually from

black-legged kittiwake chicks and adults, first-year herring was a regular but

small component of the kittiwake diet (

45

). In all these years kittiwake

breeding success was very poor, although the data are insufficient to indicate

the normal diet composition. Until the mid 1990s, however, breeding success

of the Røst kittiwakes correlated well with the abundance of young herring

(

58

), but this relationship was later affected by extensive harassment and

predation of kittiwake chicks from a booming population of non-breeding

white-tailed eagles (

Haliaeetus albicilla

) summering in the area (

59

).

Breeding numbers and reproductive success of kittiwakes and puffins were

monitored annually in study plots, and food loads of adult puffins were

(17)

collected regularly throughout the chick period using mist nets (

43, 60

).

Annual estimates of first-year abundance and spawning stock biomass of

NSS herring were provided by ICES (

61

). No sufficiently long-term data exists

on the breeding success of other seabirds feeding on this food source.

North Sea – Shetland

Shetland is an archipelago in the northwest corner of the North Sea, strongly

influenced by inflowing North Atlantic water. Most islands are bounded by sea

cliffs and provide ideal nesting habitat for many seabird species (

62

). Seas

around Shetland hold stocks of lesser sandeels

Ammodytes marinus

and

adult herring

Clupea harengus

(but no juveniles), and are visited seasonally

by adult mackerel

Scomber scombrus

(

63

). Since only northern gannets

Morus bassanus

, great black-backed gulls

Larus marinus

and great skuas

Stercorarius skua

are large enough to swallow adult herring and mackerel

(

64

), most seabirds in Shetland feed predominantly on sandeels while

breeding (

22

,

65

).

Larus

gulls, great skuas, gannets and fulmars

Fulmarus

glacialis

, also scavenge on trawl fishery offal and discards (

64

,

66

,

67

), but

even in those species, sandeels represent most of the diet in years when

standeel abundance is high (

66, 68

70

). Due to the lack of alternative small

pelagic fish species at Shetland, most small seabirds (including Arctic skuas

Stercorarius parasiticus

and kittiwakes

Rissa tridactyla

) have little opportunity

for prey switching when sandeels are scarce, but either increase effort

searching for sandeels (

71

-

73

) or abandon breeding (

62, 74

).

Seabird consumption and diet composition data (

75

) refer to the period when

the Shetland sandeel stock was large (ca. 120,000 tonnes) in the late 1970s

and early 1980s. When the sandeel stock collapsed in the late 1980s, some

seabirds switched diet (sandeels almost disappeared from diet of northern

fulmars, northern gannets, great black-backed gulls, great skuas and herring

gulls), and all except northern gannet declined in breeding numbers.

The Shetland stock of sandeels is considered to be quite distinct from others

in the North Sea, with independent dynamics (

76-78

). Shetland sandeel stock

biomass was assessed by Virtual Population Analysis (VPA) during the period

when there was a sandeel fishery at Shetland and by research trawl surveys

after the fishery closed (

22,

78

). Seabird breeding success at Foula was

monitored by RWF and colleagues from the early 1970s, under contract to

Shetland Oil Terminal Environmental Advisory Group (SOTEAG), following

standard methods used for UK seabirds, as established by Walsh et al. (

79

).

Seabird breeding success at many other Shetland colonies was monitored

since 1986 by the national seabird monitoring program coordinated by the

Joint Nature Conservation Committee (JNCC) as reported in their annual

reports (

80

). We therefore included in the analysis all seabird species from

Foula for which there was a time series of breeding success data matching

that of the Shetland sandeel stock. This included species that feed by

scavenging on fishery discards as well as on sandeels, since in years of

sandeel abundance these birds feed predominantly on sandeels, and mainly

switch to discards when preferred small pelagic fish are scarce (

66, 68-70

).

(18)

Shetland sandeel stock biomass was high in the 1970s when a fishery on

sandeels began for the first time, and declined rapidly during the 1980s as

large catches of sandeels were taken (

22

). The fishery was closed in 1990

due to low stock biomass and associated concerns about seabird breeding

failures, and although sandeel recruitment was good in 1991 immediately

following closure, the stock biomass showed only partial recovery. Stock

biomass fell again very rapidly after 2000. Causes of stock decline are not

fully understood (

22, 75-78

), but may relate to a combination of sequential

fishery exploitation of stocks on local sandbanks, effects of increasing sea

temperatures, changes in currents, and (especially since 2000) impacts of

predation by an increasing stock of adult herring (

81

).

California Current – Southeast Farallon Island

The California Current Ecosystem (CCE) is one of 4 highly productive eastern

boundary current systems in the world. Exceptional, yet variable productivity

of forage fish arises from transport of sub-arctic water from the north via the

California Current, transport of sub-tropical waters from the south relative to El

Niño/La Niña events and regional wind-driven coastal upwelling (vertical

transport) currents that supply nutrients to the light-penetrating upper ocean,

thereby stimulating photosynthesis and food web development (

82

).

Inter-annual and inter-decadal variability in forage fish have been related to water

temperature, upwelling indices, and large-scale climatic factors such as the

Southern Oscillation Index (SOI) and the Pacific Decadal Oscillation Index

(PDO). Generally speaking, when upwelling and southward transport are

strong, waters are colder and primary productivity is higher, with

corresponding effects at higher trophic levels.

In the CCE, the upper trophic level predator community includes ~2–7M

individuals of ~100 seabird species (

83

), though recent population declines of

dominant species (e.g., shearwaters) have been documented (

84, 85

).

Seabird prey in this ecosystem consists largely of forage fish, including age-0

predatory fish, such as hake (

Merluccius productus

) and rockfishes (

Sebastes

spp.)

,

and coastal pelagic species such as northern anchovy (

Engraulis

mordax

) and Pacific sardine (

Sardinops sagax

). Market squid (

Loligo

opalescens

) and mesozooplankton, primarily euphausiid crustaceans, also

are important diet items (

86, 87

). Roth et al. (

88

) provide estimates of

consumption (MT) of various prey species by common murres (

Uria aalge

) in

the central-northern portion of the CCE.

To study the reproductive success of seabirds, focal breeding pairs were

sampled throughout each nesting season by PRBO Conservation Science at

Southeast Farallon Island, Farallon National Wildlife Refuge (37°42’N, 123°W)

(

89, 90

). The species monitored were western gull (

Larus occidentalis

),

Brandt’s cormorant (

Phalacrocorax penicillatus

), common murre, pigeon

guillemot (

Cepphus columba

), pelagic cormorant (

Phalacrocorax pelagicus

),

Cassin’s auklet (

Ptychoramphus aleuticus

), ashy storm-petrel (

Oceanodroma

homochroa

) and rhinoceros auklet (

Cerorhinca monocerata

). For each

species, individual nest sites were monitored (n=15–500 nests per species

per year) at 1–7 day intervals for breeding activity. Reproductive performance

(19)

was defined as the number of offspring departing the colony per breeding pair

per year (or “jumping” for murres) (

90

). As Cassin’s auklet and ashy

storm-petrel are planktivorous (

91, 92

), and limited spatially and temporally

congruent data about plankton (krill) population abundance was available

(2002-2008), they have not been included in this analysis. Western gull

breeding success has largely been determined by predation (

93

), so similarly

they have not been included in the analysis. The breeding success of Brandt’s

cormorant is now largely determined by the abundance of northern anchovy

(

Engraulis mordax

) for which we did not have a time series on prey

abundance. The breeding success of Pelagic cormorant is driven largely by

the abundance of benthic, neritic prey, another prey group for which there was

no data. Thus, we selected for our analysis Common murre, Rhinoceros

Auklet and Pigeon Guillemot, 3 species for which we had appropriately

sampled prey data.

The availability of juvenile rockfish is the single most important determinant of

seabird breeding success at Southeast Farallon Island, at least through the

period in which we have overlapping time series of seabird breeding success

and independent measures of prey availability, 1983–2007. There is

substantial inter-annual variability in the consumption of juvenile rockfish. For

the period 1975–2007, juvenile rockfish comprised from 1% to 94%

(mean=43%) of the offspring diet of murres. For the period 1989–2006,

juvenile rockfish comprised 1% to 56% (mean=20%) of the chick diet for

guillemots, and for the period 1987–2007, juvenile rockfish comprised 0% to

59% (mean=16%) of the diet for rhinoceros auklet young.

Juvenile rockfish relative abundance was estimated from annual trawl surveys

conducted by the National Marine Fisheries Service (NMFS) in May and early

June from 1983 to 2007 (

94

), in the region of central California that closely

approximates the foraging range of the seabird species studied (

24

). Pelagic

juvenile rockfish experience high mortality from predation so abundance was

calculated after the raw catch had been adjusted to a standard age of 100

days (

95

). To develop an annual index of age-0 abundance, we used

tow-specific catch rate and a delta-general linear model (GLM) approach (

24

).

The relationship between juvenile rockfish in the offspring diet of murres,

guillemots and rhinoceros auklets relative to the estimated abundance of

these forage fish in the environment based on the NMFS surveys (

87, 93,

96

)

is asymptotic (

87

). There was substantial inter-annual variation in the

co-variance of rockfish abundance and seabird consumption (

96

). Amongst

murres, 81% of the variation in juvenile rockfish in the diet was explained by

juvenile rockfish relative abundance in the environment (

96

). Declines in

predation of juvenile rockfish by the birds as well as abundance in the

environment (

87, 90

) were related to upwelling and other oceanographic

factors as well as fishing (

24

). Rockfish fisheries in the region targeted adults,

so the link to the abundance of juveniles (age-0) which constitutes the

seabird’s diet is difficult to assess. However, across this assemblage, there

have been substantial declines in rockfish populations (

24

). One of the

primary species predated by seabirds, the shortbelly rockfish (

Sebastes

jordanii

), is not fished directly, although it may be by-caught in other fisheries.

(20)

Benguela Current – Lambert’s Bay, Malgas Island, Robben Island

The Benguela ecosystem off south-western Africa is one of the world’s four

major eastern-boundary-current upwelling ecosystems. It supports high

biomasses of anchovy

Engraulis encrasicolus

and sardine

Sardinops sagax

,

which are the main prey of a wide spectrum of predators and are also

exploited by purse-seine fisheries (

97

). Amongst the predators that feed

mainly on anchovy and sardine are four seabirds: African penguin

Spheniscus

demersus

, Cape gannet

Morus capensis

, Cape cormorant

Phalacrocorax

capensis

and swift (or crested) tern

Thalasseus bergii

(

98, 99

). The first three

of these seabirds are endemic to southern Africa, as also is the nominate race

of swift tern (

100

). The other main eastern-boundary-current upwelling

ecosystem of the southern hemisphere is the Humboldt system off western

South America (

101

). In that system, anchovy

Engraulis ringens

and sardine

again are the dominant forage fishes and it also has an endemic penguin,

sulid, cormorant and tern that subsist mainly on these two prey species (

100

).

In the Benguela ecosystem, there have been large fluctuations in the

abundances of both anchovy and sardine (

102

), as well as shifts in their

distributions (

103

,

104

), which provide opportunity to investigate relationships

between the population sizes and demographic parameters of predators, or

their diet, and the abundance or availability of their prey. For example,

numbers of African penguins and Cape gannets breeding in Namibia were

significantly correlated with the biomass of small epipelagic fish, mostly

sardine, off that country (

99

). Off South Africa, in the 2000s, a large increase

in the number of swift terns breeding coincided with an increased abundance

of anchovy and sardine (

105

). At Robben Island, South Africa, the breeding

success of African penguins was significantly correlated with the combined

biomass of anchovy and sardine (

106

). Off South Africa’s Western Cape, from

1984–1993 the contribution of anchovy to the diet of Cape gannets was

significantly related to the biomass of anchovy (

107

). The causes of the large

fluctuations in the abundance and distribution of anchovy and sardine in the

Benguela ecosystem are not fully understood but are thought to have been

influenced by both environmental factors and fishing, with some major

collapses of stocks attributed to over-exploitation (

108

).

For African penguins at Robben Island we used information on breeding

success (chicks fledged per pair) and prey abundance for 1989–2004

published by Crawford et al. (

106

). For Cape gannets at Lambert’s Bay and

Malgas Islands, we used information on breeding success from Adams et al.

(

107

), and unpublished records of Department of Environmental Affairs, South

Africa and annual estimates of the spawner biomass of anchovy and sardine

(combined) found west of Cape Agulhas (kindly provided by J Coetzee of

Department of Agriculture, Fisheries and Forestry, see also

102

). Most Cape

gannets breeding at Lambert’s Bay and Malgas Island feed west of Cape

Agulhas. When breeding, African penguins and Cape gannets at these

localities feed mainly on anchovy and sardine; outside the breeding season

Cape gannets may scavenge substantial quantities of hakes

Merluccius

spp.

that have been discarded by trawlers (

108

).

(21)

New Zealand – Kaikoura Peninsula

The coastal water off Kaikoura on the east coast of New Zealand is a highly

productive system (

109

) that supports a variety of sea birds and marine

mammals (

110

). The hydrology is relatively complex as it is a region of

interaction of warm northern water from the East Cape Current and cooler

southern water of the Southland Current (

111

,

112

). The continental shelf off

the coast is relatively narrow and incursions of warm or cold water have a

major impact on the productivity of the region (

109

).

The Kaikoura Peninsula is home to the third largest breeding population of

red-billed gulls (

Larus novaehollandiae scopulinus

). Adults can often sustain

themselves on alternative foods such as earthworms, small fish, garbage and

kelp flies (

23

), but they are dependent upon an abundant and regular supply

of

Nyctiphanes australis

(krill), their preferred food for successful breeding.

The availability of krill varies annually in response to changes in climate and

oceanography. Prior to the gulls' breeding season, the critical period for

growth and productivity of krill is winter-early spring when egg formation

occurs. Nitrogen enrichment in the coastal water at this time is greatest when

there is no influx of warm offshore water (

23, 106

). During the breeding

season the relative availability of krill was correlated positively with the

Southern Oscillation Index and the frequency of occurrence of NE winds

which induce upwelling (

23

). Incursions of warm oceanic water, often induced

by westerly winds, which are characteristic of El Niño years, were associated

with reduced euphausiid availability and reduced breeding success. Strong

incursions sometimes displaced the coastal water column with lower nutrient

water, and less dramatic incursions resulted in warm water overlying the

colder water, preventing the migration of euphausiids to the surface (

23,

109

,

112

).

The reproductive success of the red-billed gull has been monitored at

Kaikoura for the past 47 years and the abundance of euphausiids available to

the birds was determined for 35 years during the period (1975–2010).

Between 1993 and 2003, the population declined by 51% (

85

). The availability

of

N. australis

to the red-billed gull was assessed by calculating the proportion

of breeders and non-breeders which regurgitated the euphausiid when

captured (

23

). Between 1975 and 2010, 62% of 7215 adult red-billed gulls

regurgitated

N. australis

during the breeding season. The contribution of

N.

australis

to the diet reached up to 84% (

23

). The relationships between food

availability and the number of pairs that bred, laying date, clutch size, fledging

success and age of first breeding were different before and after the

population decline (

23

). The underlying cause appears to have been a

compensatory density-dependent mechanism that reduced interspecific

competition for food

.

The index of availability measures the frequency the bird

obtained euphausiids. When the population declined by 51% after 1993 from

19,000 to 9,000 individuals, competition for food at the irregular surface

forming swarms lessened and consequently the food index changed and was

(22)

not comparable to the index when the population was stable at the higher

level. The data set therefore needed to be partitioned into pre- and

post-decline phases

(23).

The analysis of the impact of food on breeding success

in the present paper was restricted to the pre-period from1975 to 1994 when

the population was stable. The prey availability index was calculated from

different red-billed gulls than the individually colour-marked birds that were

studied to ascertain the reproductive performance; so these can be

considered as two independent data sets.

Scotia Sea – Bird Island

The Scotia Sea is part of the Southern Ocean and is bounded in the west by

Drake Passage, while to the south, east and north, it is surrounded by the

Scotia Arc. The oceanographic regime is dominated by the easterly flow

through Drake Passage of the Antarctic Circumpolar Current (ACC) and by

northerly outflows from the Weddell Sea. To the east of Drake Passage the

ACC is deflected northwards by the Scotia Arc, which brings high nutrient

waters north and eastwards into areas of high natural iron concentration,

making it one of the more productive regions of the Southern Ocean (

113

).

The northward flowing currents also transport Antarctic krill (

Euphausia

superba

) from ice dominated areas in the south into the region around the

Island of South Georgia, in a process that is considered to be crucial in

maintaining the local krill population

(114–116)

. The high production and

northward dispersal generate a high biomass of krill around the island, where

it is the prey for many upper-trophic level predators. Climate related

fluctuations in oceanic and sea ice conditions across the Scotia Sea affect krill

recruitment and dispersal generating large inter-annual variations in krill

biomass around South Georgia (

113

,

116

,

117

-

119

). A series of acoustic

estimates of krill biomass was maintained at South Georgia for over 20 years

and provided an annual index of krill availability (

113

,

119

).

Seabirds and seals that breed at South Georgia are important predators of

krill and their responses to changes in prey abundance have been used to

monitor the ecosystem (

29,

118

,

120

). Two or three times in a decade krill

abundance has been very low and the foraging and breeding performance of

a range of predators has been affected (

113

,

117, 118

,

121

). The response of

particular species to variations in food availability has depended on the

magnitude of the variation and the flexibility of their feeding, foraging and

breeding strategies (

121

). The quantitative responses of predators to changes

in krill abundance depend upon the characteristics of the variable being

measured. Those involving population changes had greatest buffering and

lowest variance compared with those associated with breeding behaviour

(

122

). Those with highest variance were most sensitive to inter-annual

variation in indices of krill abundance, and breeding behaviour and diet during

the breeding season showed non-linear functional relationships between

independently-collected krill density estimates (

19

). Behavioural and short

term responses can, therefore, allow buffering of life history responses to

variation, which can mask population responses to change in food availability

(

123

,

124

). In years of low krill availability the fish component in particular

tends to increase, but this is set against a decrease in overall breeding

(23)

success (

125

). The gentoo penguin (

Pygoscelis papua

) is one of the species

monitored at South Georgia and its breeding success was significantly

reduced in periods of low krill availability (

118

,

121

). The measured responses

to inter-annual changes in food availability at South Georgia occurred within a

context of significant decadal change in the Scotia Sea ecosystem and in the

dynamics of predator populations across the Southern Ocean (

126

).

The major fluctuations in krill abundance around South Georgia have been

related to Southern Hemisphere scale atmospheric fluctuations that affected

Scotia Sea oceanic and sea ice conditions, which in turn directly impact the

krill population dynamics. The fishery for krill in the Southern Ocean is

currently operating at a lower level than during the 1980s and 1990s and even

peak catches were far below the current maximum allowable catch levels

(

127

). The fishery around South Georgia operated mainly during winter

months, outside the main breeding season for most predators. There has

been a rapid increase over the last few years in overall krill catch levels from

the fishery, which reflects changes in gear and the development of new

krill-based products. This rapid expansion is causing concern, although current

catches are still well below the peak catches previously recorded. In addition

to Gentoo penguins, a range of other species at South Georgia depends on

krill as a major component of the diet (

121

) including Macaroni penguins, fur

seals and black-browed and grey-headed albatrosses. These species show

different levels of dependence on krill in their diets and in their responses to

changes in availability (

21, 121, 128

), and may be affected differently by a

future intensification of the krill fishery.

2.

Statistical methods, threshold determination and model fitting

The data analysis was designed to optimize across the constraints presented

by the data. We made no

a priori

assumptions about the distribution of the

data or about the form of any functional relationships between seabird

breeding success and prey availability. We used generalized additive models

(GAMs) to explore the shape (also described as “form” in the main text) of the

functional relationships. GAMs are the similar to generalized linear models in

that they relate a single dependent variable to one or more independent

variables but they also have the property of exploring non-linearity in the

relationships using smoothers with no

a priori

assumption on the shape of the

relationship. We then applied a parametric approach using model selection

criteria (AIC) across a range of deterministic models to verify and reinforce the

results revealed by the GAM. All the statistical methods were assessed using

a hierarchical modeling framework to account for the repetition of the same

relationship in each ecosystem.

All the R-codes that were used are available

at the end of the SOM.

(24)

a) Empirical analyses of the dataset: tests of normality and

pooling data across ecosystems

To enable comparison of the data between ecosystems and species groups,

we first normalized each time series by subtracting the mean and dividing by

the standard deviation for each time series. The Shapiro test for normality was

applied to each time-series of prey abundance and seabird breeding success

to investigate if the data were normally distributed Sixteen of 19 (table S1),

prey abundance time-series and 12 seabird series were normally distributed.

We also ensured that the normalization did not affect the shape of the

relationship between breeding success and prey abundance, especially for

non-normally distributed data. Consequently, we used a non-parametric

approach, generalized additive models (GAM) fitted to the pooled normalized

data to explore the functional form of the relationship between seabird

breeding success and the abundance of forage fish (Fig. 2A).

R

package

“gam” was used (

129

).

Identification of a threshold from non-parametric GAM analysis

To identify and quantify a threshold in the functional relationship between prey

abundance and breeding success of predators, a change-point analysis was

performed (

130

). We used the function “cpt.reg” of the

R

package

“changepoint” (

131

). This function enabled calculation of the optimal

positioning of a change-point. This analysis was performed on the predicted

values based on the GAM.

To test the validity and robustness of the calculated threshold we estimated

potential bias in threshold estimates with respect to the sample size (number

of years analyzed). The aim was also to estimate the number of years

required to estimate the threshold. From the pooled dataset, we randomly

drew “X” consecutive years from the breeding success and prey time-series,

where “X” is comprised between 5 and 42 years. From this subset we

calculated the threshold and compare it to its value as estimated from the

global dataset. We repeated this operation 1000 times to test a wide range of

subsets and calculated a confidence interval for the estimated threshold from

the subset of “X” consecutive years. The minimum number of years required

to estimate the threshold was determined using the significance of the mean

value of the threshold, given the confidence intervals for both the subset and

global dataset, i.e. the minimum number of consecutive years where the

threshold value estimated from the subset dataset was within the confidence

interval of the threshold estimated from the global dataset (fig. S1). To

evaluate the number of years of observations needed to determine the

maximum observed biomass in prey time series, we calculated the number of

years between the beginning of the data collection and the year when the

maximum biomass was observed (fig. S2).

(25)

Estimation of the threshold confidence interval

We used a bootstrap procedure to estimate the confidence interval of the

threshold estimate. We sampled the global

dataset 1000 times to estimate the

value of the threshold. The values of the 2.5% and 97.5% quantiles of the

1000 estimates of the threshold were considered as the 95% confidence

interval (CI) for the threshold.

Accounting for “ecosystem” variation using a general additive mixed

model

To test the hypothesis that systematic ecosystem by ecosystem variation may

have resulted in the apparent asymptotic (saturation) relationship between

predators and prey based on the pooled global dataset, we added a random

effect to the GAM formulation, i.e. a general additive mixed model (GAMM);

this accounted for the potential ‘ecosystem effect’. This approach corresponds

to generalized linear mixed model (GLMM), in which the linear predictor

depends linearly on unknown smooth functions of some of the covariates. We

used the

R

package “gamm4” (

132

).

Using the GAMM, the asymptotic form of the pooled data was validated.

Moreover, the threshold value (-0.12) obtained using this method was not

different from the result obtained using the simple GAM analysis (-0.092; fig.

S3). Uncertainties for the extreme values were larger, but not unreasonably

so. We followed the GAMM with the bootstrap analysis to verify the CI. This

analysis provided a larger confidence interval than the simple GAM, but CIs

were remarkably similar. We think that these minor differences stemmed from

the fact that inclusion of “ecosystem” in the model created another source of

variability around the main pattern. The similar results in terms of threshold

identification and uncertainty illustrate the robustness of our analyses (Fig.

2A).

Accounting for stochasticity in the identified globally-coherent pattern

of the predator-prey relationship

The GAM analysis revealed an average asymptotic relationship between

seabird breeding success and prey abundance. We investigated whether the

form of this relationship was influenced by extreme values (very high/low

breeding success) using quantile GAMs. Our aim here was to examine

whether the variability driving the “average” asymptotic relationship could be

replicated using just extreme values from our data distribution. We used the

R

package “

vgam

” for this test (

133, 134

), with quantile values at 10% and 90%.

The quantile GAM performs as a GAM model which is fitted on the quantiles

of the response variable (here the 10% and 90% of the seabird breeding

success). This analysis reveals that a very similar pattern is obtained using

the extreme values. In other words, for an analysis using only low/high

breeding success, there still exists a threshold value (fig. S4). This analysis

demonstrated that our results are robust while accounting for the stochasticity

over the average relationship. This shows robustness of the threshold to the

accuracy of measurement of breeding success. The identified threshold using

Figure

Fig. 1. Map of the distribution of seabird and prey species considered in our  analysis.
Fig.   2.  (A)   Relationship   between   normalized   annual   breeding   success   of  seabirds and normalized prey abundance
Fig. 3.  Relationship between normalized annual breeding success of pooled  seabird   species   and   normalized   prey   abundance   for   the   seven   different  ecosystems using the most parsimonious asymptotic model (Table S2)
Fig. S1: Minimum number of years required for estimating the threshold. The  horizontal grey line represents the threshold estimated from the global dataset  while the solid black line is the threshold estimated from a subset of the global  dataset
+6

References

Related documents

Radio c/s: Budapest Radar / Budapest Control Frequency: 133.200 MHz Login name LHCC_CTR or LHCC_W_CTR ERGOM ERLOS KEROP WEST SECTOR LHCC_CTR / LHCC_W_CTR 133.200MHz EAST

Maximum SUVs, MATV, number of lesions and TLG per patient did not differ when stratifying between BRAF V600 or RAS mutational status or PD-L1 expression status, but were higher in

ARFID: Avoidant/Restrictive Food Intake Disorder; BB: Big Birthas; BFHCE: Breastfeeding Health Care Experiences; BOBAB: Breastfeeding Older Babies and Beyond; DGBBB: Dumfries

Last year the Association initiated a num- ben of study groups in both university and nonuniversity settings “to critically assess research in accidents related to children.” In

Transmission system operators are indeed responsible for the security of supply and have generally a central role in the implementation of the mechanisms which give an incentive

The present work was designed and implemented an electronic temperature measurement with an infrared sensor, a thermocouple and type sensor zener for magnetic fluids

While expanding the scope of who is covered by HIPAA is a step in the right direction, further steps are needed to adequately protect the intersection of PHI with the technology