SFB 649 Discussion Paper 2007-065
Integrating latent variables in
discrete choice models – How
higher-order values and
attitudes determine consumer
choice
Dirk Temme*
Marcel Paulssen*
Till Dannewald**
* Humboldt-Universität zu Berlin, Germany **Infas TTR Frankfurt, Germany
This research was supported by the Deutsche
Forschungsgemeinschaft through the SFB 649 "Economic Risk". http://sfb649.wiwi.hu-berlin.de ISSN 1860-5664
S
FB
6
49
E
C
O
N
O
M
I
CR
I
SK
B
ER
L
I
N
Integrating latent variables in discrete choice models – How
higher-order values and attitudes determine consumer
choice
Dirk Temme
1,∗, Marcel Paulssen
1, and Till Dannewald
21
Institute of Marketing, Humboldt University Berlin, 10099 Berlin, Germany
2
Infas TTR, 60594, Frankfurt, Germany
Abstract: Integrated choice and latent variable (ICLV) models represent a promising new class of models which merge classic choice models with the structural equation approach (SEM) for latent variables. Despite their conceptual appeal, to date applications of ICLV models in marketing are still rare. The present study on travel mode choice clearly demonstrates the value of ICLV models to enhance understanding of choice processes. In addition to the usually studied directly observable variables such as travel time, we show how abstract motivations such as power and hedonisms as well as attitudes such as a desire for flexibility impact on travel mode choice. Further, we can show that it is possible to estimate ICLV models with the widely available structural equation modeling package Mplus. This finding is likely to encourage wider usage of this appealing model class in the marketing field.
Keywords: Hybrid choice models; Mode choice; Values; Value-attitude hierarchy; Mplus
JEL-Codes: C25, C51, C87, M31, R41
Acknowledgement: This research was supported by Deutsche Forschungsgemeinschaft through the Collaborative Research Center on “Economic Risk” (SFB 649).
∗
Corresponding Author: Dirk Temme, Institute of Marketing, Humboldt University Berlin, 10099 Berlin, Germany, Email: [email protected], Phone: +49 (0) 30 2093 5751, Fax: +49 (0) 30 2093 5675.
1. Introduction
In 2002 the Deutsche Bahn, former national railway and now by far the biggest railroad company in Germany, introduced a new pricing system. Key feature of the pricing system was to abolish a customer card that gave a 50% price discount for travel in Germany for one year. The new customer card only allowed for a general 25% price discount. A full 55% discount would only be offered, if the passenger reserved his train seat seven days in advance. Since reserving seats well in advance is common for flights, the management of Deutsche Bahn did not anticipate any problems, when the new pricing system was introduced. Even though the total discount that a customer could attain increased by 5% to 55% the new pricing system was not accepted at all. Especially customers that choose the train for daily commutes were switching to other transport modes resulting in an estimated loss in revenues of about 130 Mio. Euros in the first quarter of 2003 (Schmid, 2003). After several marketing managers had to leave the company, the “old” customer card was re-introduced though at a considerably higher fee. This example underscores two points relevant for the paper at hand. First obviously the customers of the Deutsche Bahn highly valued a soft criteria implicitly offered as part of the old customer card, the flexibility to freely choose trains on short notice. Customers were not willing to sacrifice flexibility even though they could possibly realize a higher discount. Second understanding travel mode choice and specifically the so-called soft criteria such as attitudes towards flexibility and safety usually not investigated in travel mode choice is also of high relevance for marketing managers (Vredin Johansson, Heldt, & Johansson, 2006).
Recent advances in modeling discrete choice allow us to incorporate unobservable psychological factors such as a desire for flexibility in addition to directly observable
variables such as time and cost in choice models (e.g. Ben-Akiva et al., 1994; Morikawa, Ben-Akiva, & McFadden, 2002). Extending choice models with latent variables like values or attitudes can lead to a more realistic representation of the choice process taking place in the consumer’s “black box” and should thus provide greater explanatory power (Ben-Akiva et al., 2002a; Walker & Ben-Akiva, 2002). These so called integrated choice and latent variable
(ICLV) models1 represent a promising new class of models which merge classic choice
modeling with the structural equation approach (SEM) for latent variables. Although conceptually appealing, there are only few applications of ICLV models in marketing and related fields. The major reason for their lack of popularity is most likely the fact that full information estimation of these models is rather involved and hitherto required that the researchers developed their own programs (Ben-Akiva et al., 2002a). To the best of our knowledge the rare current applications are restricted to binary choice and with the noticeable exception of the paper by Dellaert and Stremersch (2005) only include latent variables as direct determinants of choice but neglect causal relationships between latent variables commonly investigated in structural equation modeling (e.g. Ben-Akiva et al., 2002b; Ashok, Dillon, & Yuan, 2002). Following Ben-Akiva et al.’s (2002b) recommendation we develop a behavioral framework that includes hierarchical relationships between latent variables and generalizes the binomial choice model to the multinomial case. Furthermore, by applying the program Mplus (Muthén & Muthén, 1998-2007), one of the most comprehensive software packages for SEM, we present a powerful and very flexible option for estimating ICLV models which has not been considered so far.
To sum up, the contribution of this paper is two-fold. As laid out in above our paper has a methodological contribution. We extend previous ICLV models by first estimating a multinomial choice model and second by estimating hierarchical relations between latent
variables and not only include latent variables as an additional set of predictors in the ICLV model (e.g. Ben-Akiva et al., 2002b; Ashok et al., 2002). Second our paper extends the transportation choice literature and follows Vredin Johansson et al.’s call (2006, p. 507) to increase the “understanding of the hierarchy of preferences that drive an individuals’ choice of transportation” by estimating the impact of a respondent’s values on choice criteria and on subsequent choice. Thereby we are able to truly shed light on the processes that happen in the “black box” of the consumers’ mind.
The remaining part of the paper is structured as follows. First, we introduce the general structure of ICLV models. Then, we develop a hierarchical behavioral model of choice in which we include values and attitudes as well as traditional alternative-specific and socio-demographic variables. In an empirical study on travel mode choice we test the proposed model and further also illustrate the applicability of Mplus to estimate such a complex ICLV model. We conclude by discussing the main findings and marketing implications of our study and by providing avenues for further research.
2. The integrated choice and latent variable model
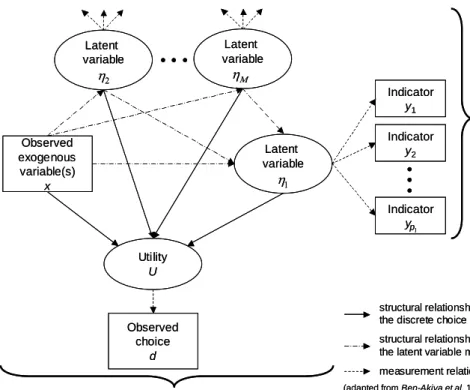
In the general formulation of the ICLV model two components are to be distinguished: a multinomial discrete choice model and a latent variable model including structural as well as measurement relations (see Fig. 1). The structure and full information estimation of both components will now be discussed in more detail. For alternative treatments of the ICLV model refer, for example, to Ashok et al. (2002), Walker and Ben-Akiva (2002) and Bolduc, Ben-Akiva, Walker and Michaud (2005).
Discrete Choice Model: The random utility component is based on the assumption that a
decision-maker n (n = 1,…, N), faced with a finite set Cn of mutually exclusive alternatives i
(i = 1,…, In), chooses the option i which provides the greatest utility Uin. Each alternative’s
utility is described as a function of explanatory variables forming the representative part of
the utility, V(·), and random disturbances, νin:
(
, ;)
,in in in in
U =V x η β +ν (1)
where xin is a (K × 1) vector of observed variables and ηin is a (M × 1) vector of latent
variables. These variables represent either (latent) characteristics of the decision-maker (xsin,
ηsin) or (latent) attributes of the alternatives (xzin, ηzin). The importance of the explanatory
variables on the utility of the options is reflected in the (1 × (K+M)) vector β. By assuming,
for example, that each νin is independently, identically distributed (i.i.d.) extreme value, the
widely used multinomial logit model results (e.g. Ben-Akiva & Lerman, 1985):
(
)
e ( (, ,; ); ) 1| , ; , e in in jn jn n V in in in V j C P u ∈ = =∑
x x x η β η βη β
(2)as is common practice in choice modeling, the representative utility V(⋅) is specified to be
linear in parameters:
,
in x in in
V =
β
x +β η
η (3)where βx and βη is a (1 ×K) and a (1×M) vector, respectively.
Latent Variable Model: Model identification typically requires that the unobserved ηs are
operationalized by multiple manifest variables, y.2 In the simplest case, a linear factor model
is appropriate to describe the mapping of the indicators onto the latent variables, leading to the following measurement equation:
, = +
y Λη ε (4)
where y is a (P × 1) vector, Λ is a (P×M) matrix of factor loadings and ε is a (P× 1) vector
of measurement errors which are i.i.d. multivariate normal.3
Our structural model for the latent variables integrates alternative formulations by Ashok et al. (2002) and Walker and Ben-Akiva (2002) by allowing for interrelationships among the
latent variables as well as for the influence of observed explanatory variables z on the latent
variables:4
, =Β +Γz+
η η ζ (5)
where z is a (L × 1) vector, and the (M × M) matrix B and the (M × L) matrix Γ contain
unknown regression parameters. The (M × 1) vector ζ represents random disturbances
assumed to be i.i.d. multivariate normal.
Likelihood Function: Since all information about the latent variables is contained in the multiple observed indicators, the joint probability of the choice and latent variable indicators
conditioned on the exogenous variables is considered. Assuming that the random errors ν, ε,
and ζ are independent, integrating over the joint distribution of the latent variables leads to the
following multidimensional integral:
(
i 1, | ,)
u(
i 1| , ; ,) (
y | ; ,)
(
| ; , ,)
, R P u P u f f d η ν ε η ζη
= = y xθ
∫
= xη β
Σ yη
Λ Ση
z B Γ Σ (6)3 Alternatively, for ordinal indicators a factor model with latent response variables might be specified (Muthén, 1983; 1984).
where Pu denotes the probability function of observing the choice of a specific alternative (2),
the density function fy for the latent variable indicators relates to the measurement model (4),
and the density function fη of the latent variables corresponds to the structural model (5). Rη
denotes that integration is over the range space of the vector of latent variables that have a direct impact on the choice decision.
If maximum likelihood techniques are applied to estimate the parameter vector θ in (6), for
any particular individual we obtain the following likelihood function:
(
)
(
) (
)
(
)
, 1, | , 1| , ; , | ; , | ; , , i n i n u i i C u i y i C R L P P u u f f d η ν ε η ζη
∈ ∈ = = = =∏
∏
∫
y x x y Λ Σ z B Γ Σθ
η β
Ση
η
(7)where ui=1 if the decision maker chooses i and zero otherwise.
Estimation: Limited information estimation of simple ICLV models with only one layer of latent variables is straightforward with standard software for both multinomial logit models (e.g. SAS, LIMDEP or STATA) and SEM (e.g. LISREL, AMOS, or EQS) at hand. However, this two-step approach is deficient in the sense that (1) it leads to inconsistent and biased estimators for the random utility part (e.g. Walker & Ben-Akiva, 2002) and (2) does not allow to test behavioral theories including more complex relationships between the latent predictors of revealed choice as proposed in Eq. (5). Full information estimation on the other hand is rather involved due to the multidimensional integral in Eq. (6). For a restricted number of latent variables (typically three or fewer cases) entering the utility function, numerical integration methods like Gaussian-quadrature are feasible (e.g. Ashok et al., 2002). With an increasing number of latent variables, the computational complexity rises exponentially. Hence, in the case of more than three latent variables other techniques like Monte Carlo integration are found to be more appropriate (see Judd, 1998 for a discussion).
So far researchers performing full information estimation of an ICLV model developed their own routines in flexible statistic software like, for example, GAUSS (e.g. Ashok et al., 2002). A more convenient way proposed here is to use the SEM software package Mplus (Muthén & Muthén, 1998-2007), whose capabilities make it suitable for a broad range of applications of the ICLV approach. Besides offering the full flexibility of a SEM program to specify complex structures of latent variables both numerical and Monte Carlo integration are available for
simultaneously estimating a multinomial logit model with latent predictors.5 In addition, to
account for unobserved heterogeneity and for segmentation purposes Mplus is able to estimate a further extended ICLV model with latent classes (for such models see, for example,
Ashok et al., 2002;Walker & Ben-Akiva, 2002).
Ben-Akiva et al. (2002b, p. 465) cautioned users of ICLV models to “first think clearly about the behavioral hypotheses behind the choice, then develop the framework, and then design a survey to support the model”. We follow their recommendation and develop the behavioral hypotheses underlying our ICLV model in the following section and carefully design our survey based on this model in the section thereafter.
3. A hierarchical model of (travel mode) choice
We develop our ICLV model enriched by a hierarchical latent variable structure to explain choice behavior in the area of travel mode choice because conventional discrete choice models have a long tradition and have been extensively applied in this area (e.g. Ben-Akiva & Lerman, 1985). In traditional choice models individual travel mode choice is modeled both as a function of individual characteristics of the decider such as income, employment status, gender, number of children etc. and of attributes of the travel mode choice alternatives such as
travel time, travel cost, availability, etc. Travel mode choice is conceptualized as a function of these solely directly measurable variables. However in the last 10 years many researchers have criticized this approach and called for the inclusion of unobservable or latent variables such as preferences for convenience, flexibility or safety into models of mode choice (e.g. McFadden, 1986; Ashok et al., 2002; Morikawa et al., 2002). The overall idea is that the inclusion of latent variables, mirroring an individual’s preference or attitudes is a more adequate representation of behavior and helps to gain valuable insight into the decision making process of the individual (Vredin Johansson et al., 2006). In the following we develop an extended choice model of travel mode choice based on an individual’s values, attitudes and demographics as well as typical characteristics of the traffic mode alternatives such as time and availability.
Recent research indicates that more abstract constructs such as values, lifestyle orientation and personality traits might also impact travel mode choice (Choo & Mokhtarian, 2004; Nordlund & Gavill, 2003; Collins & Chambers, 2005). Across disciplines there is agreement that values are motivational constructs and that values can be conceptualized as desirable goals people strive to attain. Unlike attitudes or preferences that usually refer to specific objects or actions values are abstract goals and thereby transcend specific actions and situations (Schwartz & Bilsky, 1990). Less agreement between value researchers exists regarding the role of values in guiding behavior (Bardi & Schwartz, 2003). This is partially caused by the fact that results for the direct value-behavior relationships are disappointing (e.g. Kassarjian & Sheffet, 1991; Kristiansen & Hotte, 1996). Simply examining the relation between values and behaviors will likely lead to an underestimation of the importance of values and does further not say much about the mechanism of how such distal constructs influence behavior (McCarthy & Shrum, 1994). Therefore researchers have proposed that
values impact specific behaviors through intervening constructs. This proposition can be traced back to Howard’s (1977) model of value-attitude systems. Empirical validations of a mediated impact on behavior (intentions, preferences) through the so-called value-attitude hierarchy have been conducted by, among others, McCarthy and Shrum (1994) and Thøgersen and Grunert-Beckmann (1997).
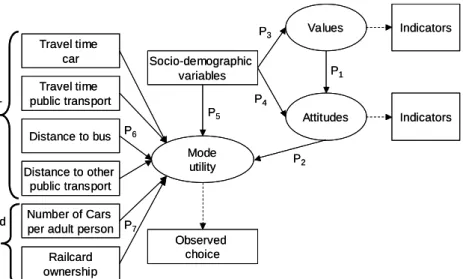
In the context of mode choice behavior several studies have indicated that values might also play a role in travel mode choice (Bamberg, 1996; Bamberg & Kühnel, 1998; Choo & Mokhtarian, 2004; Lanzendorf, 2002). None of those studies have, however, developed and tested a model on how values impact actual transport mode choice. Building and extending on this research we propose that values determine the classic attitudes towards mode choice, such as preferences for comfort/convenience, flexibility and safety:
P1: Respondents’ value orientations determine their attitudes towards mode choice.
As stated above recent research has shown that the inclusion of attitudes in models of transport choice lead to substantial improvements in terms of model fit as well as explanation and further provide a more satisfying representation of behavior (Choo & Moktarian, 2004; Ben-Akiva et al., 2002b; Vredin Johansson et al., 2006). We build on recent research by Vredin Johansson et al. (2006) and include attitudes towards mode choice such as convenience and flexibility in our model. Following the results of the cited studies these attitudes are proposed to determine mode choice.
What are the sources of value orientation? Life circumstances impact how rewarding and how costly the pursuit of values is for people. A woman in a social environment with strong gender stereotypes is likely to be rewarded for pursuing benevolence values and sanctioned for pursuing power values. This example demonstrates how life circumstances affect people’s value priorities. With the exception of values that concern material well-being such as power and security people attribute higher importance to values that are easily to attain but downgrade the importance of values whose pursuit is restrained. Power and security values in contrast rise in importance the more difficult they are to attain (Schwartz, 2003). People’s demographic characteristics such as age, gender and income largely determine people’s life circumstances in terms of their socialization, their social roles, their life stage and their expectations. Differences in these demographic variables represent differences in life circumstances that affect the salience of values. Examples for age and gender might illustrate this point. With increasing age the ability to cope with change is waning and security values become more relevant. Socialization leads boys and girls to adopt different social roles with different life goals and orientations. Women being more relational and communal than men tend to attribute more importance to benevolence values and less importance to power values (Prince-Gibson & Schwartz, 1998; Schwartz & Rubel, 2005). We accordingly propose:
P3: Socio-demographic characteristics (age, income, gender) determine values.
In their behavioral framework for choice models with latent variables Ben-Akiva et al. (2002b) proposed that socioeconomic characteristics of an individual affect his/her attitudes (e.g. the relevance of flexibility of a transport mode depends on having children or not). In a recent paper Vredin Johansson et al. (2006) tested that proposition and demonstrated that
demographic variables impacted attitudes of flexibility and comfort. We accept these results and propose:
P4: Socio-demographic characteristics determine attitudes towards mode choice.
Most empirical models on travel mode choice use modal attributes such as travel time and travel cost, individual household characteristics such as railcard and car ownership and further individual socio-demographic characteristics such as age, education as explanatory variables for mode choice behavior (e.g. Vredin Johansson et al., 2006). We expect similar effects in our study and propose:
P5: Socio-demographic characteristics (e.g. age, income, gender) determine mode choice.
P6: Traffic mode attributes (e.g. travel time) determine mode choice.
P7: Household characteristics (e.g. number of cars owned) determine mode choice.
In summary the current study was designed to specifically investigate the influence of psychological factors (individual values, attitudes) in concert with known factors (access, time, age, gender) on commuter-mode choice. Seven propositions were derived from the literature review and will be tested in the following empirical study on commuter-mode choice.
4. Data and methods
Data for our analysis of travel mode choice came from a representative sample of German consumers between 14 and 75 years of age. Following a survey pretest with 20 subjects, 907
respondents were drawn from a consumer panel of a major international market research company. The survey was administered in a computer-aided telephone interview. Panelists were recruited following a demographic quota sampling approach based on age, profession as a proxy for status, gender, household size, and size of residence. The sample distribution of these demographic variables does not significantly deviate from their population distribution.
The questionnaire consists of five major parts. In the first section respondents were asked demographic questions needed for quota sampling. The second section included questions about personal mobility. Respondents were asked about the possession of a driver’s license, of seasonal tickets for public transport alternatives (bus, streetcar, integrated public transport system, railroad) and about possession of cars. Further the distance to the next stations of various public transport alternatives (if available) and the time needed for daily trips to work with public transport as well as with the car had to be estimated. Note here that we refrained from asking respondents about the estimated cost of the different transport modes because we anticipated a large proportion of missing values on these variables. This decision was informed by high non-response during the survey pretest and by previous research from Bamberg and Schmidt (1994) who showed that many car drivers neither know the cost per driven kilometer nor do they possess adequate knowledge about prices of public transportation alternatives. In the third section we asked about attitudes towards transport modes for daily trips to work. This section was modeled after a recent paper of Vredin Johansson et al. (2006) and a previously published working paper (Vredin Johansson, Heldt, & Johansson, 2005). In their study respondents had to rate attitudinal questions relating to modal comfort, convenience and flexibility on five point scales from not important at all to very important. Unfortunately their study lacked tests of discriminant validity as well as a detailed assessment of item reliability and construct reliability for their three identified dimensions comfort, convenience and flexibility (Vredin Johansson et al., 2005; 2006). We
therefore conducted repertory grid interviews with 30 respondents. 12 respondents were pure car users, 12 respondents used both cars and public transport and 6 respondents only used public transport for their daily trips. Based on the grid interviews we developed 9 items to measure three dimensions: flexibility, comfort/convenience and safety using the same response format as Vredin Johansson et al. (2006). In the fourth section we asked respondents about their revealed preferences of trip mode choice for their daily trips to work or education. Respondents had to indicate whether they predominantly used car, public transport or a combination of both for their daily trips. The survey closes with a section, where we measure respondents’ value orientations with the Portraits-Value-Questionnaire (PVQ) from Schwartz et al. (2001). Respondents had to indicate their similarity to 40 person descriptions (portraits); gender-matched with the respondent on six-point rating scales ranging from very unalike to very much alike (Schwartz et al., 2001).
For 43% of the respondents in our sample daily trips to work/education did not apply (e.g. they were housewife/househusband, unemployed or retired) or alternative travel modes did not exist (e.g. they did not possess a drivers licence or had no car in the household). After deletion of these cases (see Vredin Johannson et al., 2006 for a similar approach) our analytic sample thus consists of n=519 respondents.
5. Results
5.1 Construct validity of latent model variables
We followed the two-step approach in structural equation modeling (e.g. Anderson & Gerbing, 1988), and first tested the reliability and validity of the measurement models used in the study. Item formulations for both the attitude and value constructs are reported in Table 1.
Since the rating scales for the attitudes towards mode choice show substantial deviations from the normality assumption (especially negative skewness), indicators for the corresponding constructs are supposed to be ordered-categorical. For the personal value constructs, where we employed previously validated scales (Schwartz et al., 2001), the departure from normality is only marginal. We therefore stick with the assumption of a continuous scale for the personal value constructs. As stated in the methods section building on Vredin Johansson et al. (2006) and the repertory grid interviews we developed items for the three dimensions flexibility, comfort/convenience and safety. Unfortunately, the measurement model for safety did not work as expected. The reason for this result may stem from the fact that the three original items were a mixture of personal safety and traffic safety attitudes in mode choice. In our repertory grid interviews many respondents mentioned that in public transport they felt threatened or uneasy due to the presence of unwanted others. For cars in contrast possession allowed them to be on their own or to select persons to drive with. Since also Vredin Johansson et al. (2006) reported that the differences of different modes with respect to traffic safety are negligible, we decided to keep the possession item (see Table 1) as an admittedly suboptimal measure of attitude towards personal safety in mode choice. Reliability for this item has been fixed to a value of .80. Although Schwartz’ Portraits Questionnaire provides well established and validated scales, results of separate confirmatory factor analyses (CFA) for the focal value constructs prompted us to eliminate two further items, one for power and one for security.
Our final confirmatory factor model for attitudes towards mode choice and values has been estimated with the robust WLSMV estimator implemented in the Mplus software (Muthén & Muthén, 1998-2007). Goodness-of-fit statistics for this model indicate an acceptable overall
fit to the data (χ2=131.28, df=57, NFI=.91, CFI=.90, RMSEA=.05, weighted RMSR=.90)6.
Convergent validity is established by statistically significant factor loadings with t-statistics
ranging from 5.07 to 10.14. Completely standardized factor loadings range from .47 to .70 for the attitude and from .50 to .79 for the value measures. Except for the factor convenience/comfort all construct reliabilities (see Table 2) are above a recommended threshold of .60 (Bagozzi & Yi, 1988). With respect to the average variance extracted (AVE, Fornell & Larcker, 1981), results are mixed (see Table 2). Again, convenience/comfort exhibits the lowest score on this measure of internal consistency. For the factors flexibility, hedonism, and security the AVE levels almost reach the benchmark of .45 (Netemeyer, Bearden, & Sharma, 2003, p. 153), whereas for power the score is well above that threshold. Since the squared correlation between the two attitude constructs flexibility and convenience/comfort is larger than the AVE for both factors (thus indicating a possible violation of discriminant validity, Fornell & Larcker, 1981), we estimated a modified factor model where (1) the correlation between both factors has been fixed to unity and (2) the correlations of both constructs with like factors have been constrained to be equal (van der
Sluis, Dolan, & Stoel, 2005). The highly significant chi-square difference (∆χ2=54.31, df=5,
p=.000) provides support for the discriminant validity of both constructs.
To sum up, despite a good overall fitting CFA model some measures of reliability and validity indicate a moderate fit. However, it should be kept in mind that due to the commercial nature of the survey scales for the choice criteria were rather short and did not show much “item wording redundancy” (Netemeyer et al., 2003, p. 149). This might explain the somewhat lower internal consistency. With respect to the items borrowed from Schwartz’ Portraits
6 Degrees of freedom for WLSMV are estimated according to a formula given in the Technical Appendices of Mplus (Muthén, 1998-2007,
Questionnaire we decided to restrict item elimination to a minimum in order to preserve the constructs’ content domain.
5.2 Integrated choice and latent variable model of travel mode choice
In order to test our ICLV model of travel mode choice and to assess to what extent the latent value-attitude hierarchy provides additional explanatory power and enhances understanding over and above a traditional model on travel mode choice, we first estimate a classic MNL model. This classic model of travel mode choice only contains directly observed variables describing the choice alternatives (e.g. travel time) and the decision makers (e.g. age).
McFadden’s pseudo R2 for this model is .16 (see Table 3). Given the fact that in contrast to
many other studies our analysis does not focus on commutes in a specific area (e.g. Train, 1978) or between specific cities (e.g. Vredin Johansson et al., 2006) this result can be considered as reasonable. Our sample was drawn across Germany thus commuters’ mode choices occur under very different circumstances (e.g. concerning the quality and safety of public transport systems). This substantial heterogeneity is likely to reduce the explanatory power of our model.
Results for the traditional MNL model are in line with published research on travel mode choice. Except for distance to the next bus station, all parameter estimates for attributes
characterizing the choice options are significantly different from zero at p<.05 and also show
the expected negative signs (see Table 3). Time needed to commute to work with a travel mode significantly reduces the utility and thereby also the choice probability of the respective travel mode (e.g. Vredin Johansson et al., 2006). Likewise distance to the nearest point of access to the public transport system (other than bus) strongly contributes to avoiding this mode either alone or in combination with car driving. Thus in line with other research our
results support the proposition that an increase in distance to a transfer location (i.e. metro, tram or train station) significantly reduces the propensity to use public transport (Keijer & Rietveld, 2000; Loutzenheiser, 1997; O’Sullivan & Morrall, 1996). Obviously the distance to transfer locations other than bus are relevant for mode choice in our study. With respect to mode-related individual-specific attributes both the number of cars available per adult living in the houshold as well as rail-card ownership exhibit strong effects on travel mode choice (e.g. Bresson, Dargay, Madre, & Pirotte, 2004). As expected, the number of cars per adults in a household increases the propensity to use a car for daily trips to work either exclusively or in combination with, for example, train or bus. On the other hand, holding a railcard reduces the utility of using a car. Both variables can be conceived as availability indicators for the two respective transport modes and thereby reduces the likelihood of choosing other modes (e.g. Thøgersen, 2006). In contrast, none of the socio-demographic variables age, gender, and monthly household income significantly impacted mode choice. At least for household income this result was unexpected since previous research has identified income as a robust explanatory variable for mode choice (e.g. McFadden, 1974; Train, 1980; Kitamura, 1989). We explored this issue in more depth and eventually found out that the number of cars per adult in a household captures much of the income effect: excluding the former variable from the analysis leads to a highly significant income effect consistent with results from the above cited studies. Overall the results of the traditional logit model are largely consistent with published research on travel mode choice.
Next we present the empirical findings of our proposed ICLV model that includes latent attitudes towards travel modes as well as selected value types as additional explanatory
variables. The model consists of a MNL part, where following proposition P1 attitudes
towards mode choice have been included as additional explanatory latent variables, and a latent variable model that captures the effects of values on attitudes as well as the effects of
socio-demographic variables on both types of latent variables. Both model parts have been estimated simultaneously using again Mplus. Comparing the traditional and the ICLV model in terms of overall fit shows that the latter indeed provides greater explanatory power
although in a statistical sense improvement is moderate (see Table 3). McFadden’s pseudo R2
as well as the information criteria have improved. Likewise the significant chi-square
difference (∆χ2=20.66, df=6, p=.0021) supports the assumption that including attitudes toward
mode choice in the MNL part of the model leads to a better explanation. In addition, all
attitudes significantly impact mode choice thus corroborating our proposition P2. Note also
that consistent with our model the inclusion of values in the MNL part of the model did neither increase model fit nor was any effect on mode choice significant. Further results concerning the effects of the variables describing the choice alternatives and the decision makers are identical to the discussed results of the traditional MNL model. Thus our
proposition P5, P6 and P7 were also supported in our extended model.
Concerning the effect of attitudes on mode choice we find that the desire for flexibility significantly increases the propensity to exclusively use the car for daily work trips. In turn, flexibility does not seem to discriminate between the two remaining choice options even though cars are involved in the bimodal option 2. Importance of a convenient and comfortable commute decreases the probability of choosing a car for daily trips. However, this effect is
only significant at p<.10. If a commuter finds it important to own the transport mean – our
proxy variable for personal safety –, this increases the probability of using the car for daily trips. Obviously, if commuters value the possibility to choose their fellow passengers they are more likely to use a car. Our results concerning flexibility and convenience/comfort attitudes are in line with those of Vredin Johansson et al. (2006). Note again that Vredin Johansson et al. (2006) employed the deficient two-step (limited information) approach to estimate their model.
Results of our latent variable model clearly confirm that personal values indeed impact attitudes towards mode choice (see Table 4) and thereby provide strong empirical support for
our proposition P1. As expected, hedonism has its strongest positive impact on
convenience/comfort but to a lesser extent also drives our measure for personal security. The central motivational goal of hedonism is pleasure and sensuous gratification for oneself (Schwartz & Bilsky, 1990). Thus respondents for whom hedonism is a salient motivation would highly value convenience/comfort in mode choice. The explanation of the effect on personal safety is somewhat more difficult. Here it could be possible that those who put a high relevance on owning the transport mode also associate other, more pleasure-related aspects and activities with it (e.g. enjoy driving the vehicle they own, being undisturbed by unwanted others etc.). The main motivational concern expressed through security is safety, stability and harmony of the self, of society, and of relationships. Security orientation
significantly positively impacts all three attitudes towards transport mode choice at p<.05.
This result makes sense since all three attitudes safety, convenience/comfort and flexibility prevent the individual from making unexpected, potentially undesirable experiences in transport mode choice. Respondents for whom power is a particularly salient value put a higher relevance on both flexibility and convenience/comfort. Again this result has face validity since power values express a desire for social status, prestige as well as control or dominance over people and resources (Schwartz & Bilsky, 1990). Thus the salience of the power value should be related to flexibility since flexibility increases control over resources (time, cost). Interestingly, the effect on security is not significant. On the other hand safety concerns are less relevant for those with a strong inclination to control and dominate. Except for the one-indicator construct safety the explained variance in attitudes is with values of 22% and 45% substantial in an absolute sense. Summarizing our results concerning the
As proposed in P3 socio-demographic variables possess some interesting effects on personal
values. Power is clearly more salient for men than for women, a result that is consistent with research in psychology (Schwartz & Rubel, 2005). Both age and income are negatively related to hedonism as a guiding personal value. Again this result is consistent with published research (Schwartz & Rubel, 2005). Furthermore the strong positive effect of age on security support the contention that age is positively related to conservation values. This hypothesis derives from the fact that older people are more likely to be embedded in social networks, to have developed habitual behaviors that they adhere to and are less likely to seek exciting changes and challenges (Schwartz, 2003). Our results concerning sources of value priorities
support proposition P3 and are consistent with previously confirmed or hypothesized effects in
the psychological literature.
In our model the relation between attitudes and socio-demographic variables is rather weak. We only find one significant effect from income on flexibility. Further even though only
significant at p<.10 gender impacts the relevance of safety. For woman personal safety of a
transport mode is of higher importance than for men (see e.g. Vredin Johansson et al. (2006) for a similar result). The fact that socio-demographic variables are sources of value priorities and thereby impact attitudes towards mode choice via values might explain our somewhat
weaker results for the direct effects put forth in proposition P4.
6. Discussion and implications
The goal of this research project was to make both a theoretical and a methodological contribution. With respect to the theoretical contribution we set out to develop a more comprehensive model of choice that also maps the impact of such abstract motivational constructs as values on consumers’ real choices. The general structure of our integrated
choice and latent variable (ICLV) model consists of a discrete choice part where latent variables, in our example attitudes, enter a multinomial logit model in addition to observed attributes of the different choice options as well as attributes of the decision maker. The latent variable part of the model allows for relations between the latent variables and observed variables, as well as causal relationships between the latent variables. Additionally socio-demographics are included as explanatory variables both in the discrete choice and latent variable model in order to control for observed heterogeneity and to aid in forecasting the latent variables. In our empirical example a hierarchical model, where personal values determine attitudes that in turn impact on actual behavior, was proposed and validated. Note here that the notion of hierarchical goal structures and their impact on consumer behavior is a current topic in the marketing field (e.g. Paulssen & Bagozzi, 2006; Yang et al., 2002). However existing research in marketing has not investigated the impact of the value-attitude hierarchy on actual choice but only on intentions (McCarthy & Shrum, 1994; Thøgersen & Grunert-Beckmann, 1997). Only the recent methodological advances in choice modeling made the inclusion of these latent variables in a choice model possible.
Our empirical study took place in the context of travel mode choice, not a typical marketing subject, but as laid out in the beginning of the paper nevertheless of relevance for practicing marketers. In contrast to the previous applications of the ICLV model in marketing which relied on experimental settings (Ashok et al., 2002; Delleart & Stremersch, 2005), real-life decisions on either using the car, some kind of public transport, or a combination of both for daily trips to work or education have been analyzed. Survey data was used (1) to test the significance of three individual-specific attitudes postulated to be important for mode choice: flexibility, safety, and comfort/convenience, and (2) to assess the influence of three personal values on these attitudes: power, hedonism, and security.
Our extended choice model clearly outperforms a traditional MNL model on several accounts and provides valuable insights into the motivational processes that determine mode choice. Results confirm previous research in that modal time, distance to the public transport system, numbers of cars available per adult as well as railcard ownership are significant predictors of mode choice. Additionally our results show how preferences for flexibility, safety, and convenience/comfort impact mode choice and how these preferences are in turn determined by higher order motivations such as hedonism or power. Interestingly the inclusion of latent variables did not change any effect of the observed variables substantially and in that sense delivered true additional insight. Confirming results and propositions from recent research in social psychology on the sources of value priorities (Schwartz & Rubel, 2005) we could show that socio-demographic variables affect values and thereby also attitudes and choice. Although attitudes and personality traits such as values cannot be easily forecasted, the relation of these constructs to socio-demographic variables may aid in forecasting such variables (Vredin Johansson et al., 2006), e.g. in an ageing society the salience of the security value increases and thereby also the relevance of safety for mode choice.
The introductory example of the failed new pricing system of the Deutsche Bahn underscores the managerial relevance of our findings. Obviously desire for flexibility is an important determinant of commuters’ mode choice in Germany. Even though objective total travel costs were reduced for railways the substantial decline in flexibility caused by the new pricing scheme lead to a massive loss of passengers – as would have been predicted by our model. Further understanding the motivational determinants of attitudes can help in designing communication that addresses these higher order motives. The desire for convenience/comfort positively impacts commuter choice for public transport. Hedonistic value orientations in turn determine the desire for convenience/comfort. Thus public transport companies might position themselves as comparatively stress-free and comfortable travel alternatives and
emphasis pleasure and enjoyment e.g. contrast a relaxing rail passenger calmly enjoying a newspaper or book with a stressed rush hour driver surrounded by honking cars in an advertisement. To sum up, our results support the contention that attitudes and also values as more remote causes are important determinants in mode choice. The general theoretical conclusion of this study is that future models of choice can be made more powerful by including attitudes and personality variables of the decision maker.
Concerning our methodological contribution we have extended existing research in two major ways. First our model extends previous accounts of ICLV models by providing a general framework that allows any interrelationship between latent variables to be specified. Further latent variables can also be predicted by observed explanatory variables. Both selected latent and observed variables can enter the multinomial logit model as direct determinants of choice. Further to the best of our knowledge this is the first application of an ICLV model to multinomial choice both in transportation research and marketing. Previous studies in marketing have only analyzed binary choice situations where respondents were asked to indicate their behavioral intentions after certain experimental manipulations (Ashok et al., 2002; Dellaert & Stremersch, 2006).
Our paper makes a further contribution by suggesting a convenient alternative for estimating ICLV models with the program Mplus (Muthén & Muthén, 2007), one of the most comprehensive software packages for SEM. Ben Akiva et al. (2002b) concluded that a major lesson learned from their research endeavor is that latent variable extended choice models require both customized programs and fast computers for estimation. From a substantial point of view, ICLV models can be considered one of the most interesting advances in discrete choice modeling during the last decade. Still applications in marketing and related fields are scarce. The major reason for this lack of popularity is most likely the fact that these models so
far required researchers to develop customized programs. We have shown and validated (Temme, 2007) that ICLV models can be estimated with Mplus and hope that this finding will further increase applications of this interesting approach in the marketing community and beyond.
7. Limitations and further research
Our research endeavor is not without limitations. One limitation concerns the measurement models for the attitudes toward mode choice. Even though we applied state of the art estimation techniques and followed Ben-Akiva et al.’s (2002b) advice that developing a behavioral framework that guides questionnaire design and data collection is crucial for the successful application of ICLV models, our scales for attitudes are only acceptable and definitely offer room for improvement. We like to point out that we developed these scales based on published research (Vredin Johansson et al., 2006) and own prior qualitative studies. Further our attitude scales still compare favorably with those published recently in the transport mode choice literature (e.g. Vredin Johansson et al., 2006; Ben-Akiva et al., 2002b). Still, the internal validity of the estimated attitude effects on mode utilities might be adversely affected (e.g. attenuated effects).
Although we tried to control for heterogeneity by including socio-demographic variables, there is of course some risk that unobserved heterogeneity has considerably biased our results. In principle, Mplus would have offered us the opportunity to use a finite-mixture approach in the estimation of the ICLV model. According to recent simulation evidence (Temme, 2007), however, the number of observations seems to be just large enough for a single-sample analysis. Additionally, mode choices exhibit a strong asymmetry in favour of cars which
further amplifies the sample size issue. Thus we see the combination of a finite mixture approach with a latent variable extended choice model as an opportunity for future research.
References
Anderson, J. C., & Gerbing, D. W. (1988). Structural equation modeling in practice: A review
and recommended two-step approach. Psychological Bulletin, 103(3), 411–423.
Ashok, K., Dillon, W. R., & Yuan, S. (2002). Extending discrete choice models to incorporate
attitudinal and other latent variables. Journal of Marketing Research, 39(1), 31–46.
Temme (2007). Estimating integrated choice and latent variable models with Mplus – A Monte Carlo study, Working Paper.
Bagozzi, R. P. (1980). Causal models in marketing. New York: John Wiley & Sons.
Bagozzi R. P., & Yi Y. (1988). On the evaluation of structural equation models. Journal of
the Academy of Marketing Science, 16(1), 74–94.
Bamberg, S. (1996). Allgemeine oder spezifische Einstellungen bei der Erklärung umweltschonenden Verhaltens? [General or specific attitudes as predictors of
environmentally friendly behavior?]. Zeitschrift für Sozialpsychologie, 27(1), 47–60. (in
German)
Bamberg, S., & Schmidt, P. (1994). Auto oder Fahrrad? Empirischer Test einer Handlungstheorie zur Erklärung der Verkehrsmittelwahl [Car or bicycle? An empirical test of
a behavioral theory on travel mode choice]. Kölner Zeitschrift für Soziologie und
Sozialforschung, 46(1), 80–102. (in German)
Bamberg, S., & Kühnel, S. (1998). Überzeugungssysteme in einem zweistufigen Modell rationaler Handlungen [Systems of conviction in a two-stage model of rational behavior].
Zeitschrift für Soziologie, 27(4), 256–270. (in German)
Bardi, A., & Schwartz, S. H. (2003). Values and behaviour: Strength and structure of
relations. Personality and Social Psychology Bulletin, 29(10), 1207–1220.
Ben-Akiva, M., & Lerman, S. R. (1985). Discrete choice analysis, theory and application to
travel demand. Cambridge: MIT Press.
Ben-Akiva, M., Bradley, M., Morikawa, T., Benjamin, J., Novak, T., Oppewal, H., & Rao, V.
(1994). Combining revealed and stated preferences data. Marketing Letters, 5(4), 335–349.
Ben-Akiva, M., McFadden, D., Gärling, T., Gopinath, D., Walker, J., Bolduc, D., Boersch-Supan, A., Delquié, P., Larichev, O., Morikawa, T., Polydoropoulou, A., & Rao, V. (1999).
Extended framework for modeling choice behavior. Marketing Letters, 10(3), 187–203.
Ben-Akiva, M., McFadden, D., Train, K., Walker, J., Bhat, C., Bierlaire, M., Bolduc, D., Boersch-Supan, A., Brownstone, D., Bunch, D. S., Daly, A., De Palma, A., Gopinath, D., Karlstrom, A., & Munizaga, M. A. (2002a). Hybrid choice models: Progress and challenges.
Marketing Letters, 13(3), 163–175.
Ben-Akiva, M., Walker, J., Bernardino, A., Gopinath, D., Morikawa, T., Polydoropoulou, T.
(2002b). Integration of choice and latent variable models. In H. Mahmassani (Ed.), In
perpetual motion: travel behaviour research opportunities and application challenges (pp. 431–470). Amsterdam: Elsevier.
Bolduc, D., Ben-Akiva, M., Walker, J., & Michaud, A. (2005). Hybrid choice models with logit kernel: Applicability to large scale models. In M. Lee-Gosselin, & S. Doherty (Eds.),
Integrated land–use and transportation models (pp. 275–302). Amsterdam: Elsevier.
determinants of the demand for public transport: An analysis on a panel of French urban areas
using shrinkage estimators. Transportation Research Part A: Policy and Practice, 38(4), 269–
285.
Choo, S., & Mokhtarian, P. L. (2004). What type of vehicle do people drive? The role of
attitude and lifestyle in influencing vehicle type choice. Transportation Research Part A:
Policy and Practice, 38(3), 201–222.
Collins, C. M., & Chambers, S. M. (2005). Psychological and situational influences on
commuter-transport-mode-choice. Environment and Behavior, 37(5), 640–661.
Dellaert, B. G. C., & Stremersch, S. (2005, May). Marketing mass-customized products:
Striking a balance between utility and complexity. Journal of Marketing Research, 42, 219–
227.
Elrod, T. (1991). Internal analysis of market structure: Recent developments and future
prospects. Marketing Letters, 2(3), 253–266.
Elrod, T., & Keane, M. P. (1995). A factor-analytic probit model for representing the market
structure in panel data. Journal of Marketing Research, 32(1), 1–16.
Fornell, C., & Larcker, D. (1981). Structural equation models with unobservable variables and
measurement error. Journal of Marketing Research, 18(1), 39-50.
Howard, J. A. (1977). Consumer behavior: Application of theory. New York: McGraw-Hill.
Judd, K. L. (1998). Numerical methods in economics. Cambridge: MIT Press.
Kassarjian, H. H., & Sheffet, M. J. (1991), Personality and consumer and consumer behavior:
An update. In: T. S. Robertson, & H. H. Kassarjian (Eds.), Handbook of Consumer Behavior
(pp. 281–301). New Jersey: Prentice–Hall.
Keijer, M. J. N., & Rietveld, P. (2000). How do people get to the railway station? The dutch
experience. Transportation Planning and Technology, 23(3), 215 – 235.
Kitamura, R. (1989). A causal analysis of car ownership and transit use. Transportation,
16(2), 155–73.
Kristiansen, C. M., & Hotte, A. M. (1996). Morality and the self: Implications for when and how of value-attitude behavior relations. In G. Seligman, J. M. Olson, & M. P. Zanna (Eds.),
The Ontario Symposium: Vol. 8 - The psychology of values, (pp. 77–106). Hillsdale, NJ: Lawrence Erlbaum.
Lanzendorf, M. (2002). Mobility styles and behaviour – Application of a lifestyle approach to
leisure travel. Transportation Research Record, 1807, 163–173.
Loutzenheiser, D. R. (1997). Pedestrian access to transit: Model of walk trips and their design
and urban form determinants around bay area rapid transit stations. Transportation Research
Record, 1604, 40–49.
McCarthy, J. A., & Shrum, L. J. (1994). The recycling of solid wastes: Personal value
orientation, and attitudes about recycling as antecedents of recycling behavior. Journal of
Business Research, 30(1), 53–62.
McFadden, D. (1974). The measurement of urban travel demand. Journal of Public
Economics, 3(4), 303–28.
McFadden, D. L. (1986). The choice theory approach to marketing research. Marketing
Morikawa, T., Ben-Akiva, M., & McFadden, D. L. (2002). Discrete choice models incorporating revealed preferences and psychometric data. In P. Franses & A. Montgomery
(Eds.), Econometric Models in Marketing (Vol. 16, pp. 29–55). Amsterdam: Elsevier.
Muthén, B. O. (1983). Latent variable structural equation modeling with categorical data.
Journal of Econometrics, 22(1–2), 48–65.
Muthén, B. O. (1984). A general structural equation model with dichotomous, ordered
categorical, and continuous latent variable indicators. Psychometrica, 49(1), 115–132.
Muthén, L. K., & Muthén, B.O. (1998–2007). Mplus User’s Guide. 5th ed., Los Angeles:
Muthén & Muthén.
Netemeyer, R. G, Bearden, W. O, & Sharma, S. (2003). Scaling procedures: Issues and
applications. Thousand Oaks: Sage Publications.
Nordlund, A. M., & Garwill, J. (2003). Effects of values, problem awareness, and personal
norm on willingness to reduce personal car use. Journal of Environmental Psychology, 23(4),
339–347.
O'Sullivan, S., & Morrall, J. (1996). Walking distances to and from light-rail transit stations.
Transportation Research Record, 1538, 19–26.
Paulssen, M., & Bagozzi, R. P. (2006). Goal hierarchies as antecedents of market structure.
Psychology & Marketing, 23(8), 689–709.
Prince-Gibson, E., & Schwartz, S. H. (1998). Value priorities and gender. Social Psychology
Quarterly, 61(1), 49–67.
Schmid, K.-P. (2003, May 15). Begrenzt einsatzfähig [Limited fitness for use]. Die Zeit, 21.
(in German)
Schwartz, S. H. (2003). A proposal for measuring value orientations across nations. In
European Social Survey, The questionnaire development package of the European Social
Survey, (Chapter 7, pp. 259–319).
Schwartz, S. H., & Bilsky, W. (1990). Toward a theory of the universal content and structure
of values: Extensions and cross-cultural replications. Journal of Personality and Social
Psychology, 58(5), 878–891.
Schwartz, S. H., Melech, G., Lehmann, A., Burgess, S., & Harris, M. (2001). Extending the cross–cultural validity of the theory of basic human values with a different method of
measurement. Journal of Cross Cultural Psychology, 32(5), 519–542.
Schwartz, S. H., & Rubel, T. (2005). Sex differences in value priorities: Cross-cultural and
multi–method studies. Journal of Personality and Social Psychology, 89(6), 1010–1028.
Thøgersen, J. (2006). Understanding repetitive travel mode choices in a stable context: A
panel study approach. Transportation Research Part A: Policy & Practice, 40(8), 621–638.
Thøgersen, J., & Grunert-Beckmann, S. C. (1997). Values and attitude formation towards
emerging attitude objects: From recycling to general waste minimizing behavior. Advances in
Consumer Research, 24, 182–189.
Train, K. (1978). A validation test of a disaggregate mode choice model. Transportation
Research Part A: Policy and Practice, 12(2), 167–174.
Train, K. (1980). A structured logit model of auto ownership and mode choice. Review of
van der Sluis, S., Dolan, C. V., & Stoel, R. D. (2005). A note on testing perfect correlations in
SEM. Structural Equation Modeling, 12(4), 551–577.
Vredin Johansson, M., Heldt, T., & Johansson, P. (2005). Latent variables in a travel mode choice model: Attitudinal and behavioural indicator variables. Working Paper 2005:5, Uppsala University.
Vredin Johansson, M., Heldt, T., & Johansson, P. (2006). The effects of attitudes and
personality traits on mode choice. Transportation Research Part A: Policy and Practice,
40(6), 507–525.
Walker, J., & Ben-Akiva, M. (2002). Generalized random utility model. Mathematical Social
Sciences, 43(2), 303–343.
Yang, S., Allenby, G. M., & Fennell, G. (2002). Modeling variation in brand preference: The
roles of objective environment and motivating conditions. Marketing Science, 21(1), 14–31.
Yu, C.-Y. (2002). Evaluating cutoff criteria of model fit indices for latent variable models
Table 1
Measures used in the study
Attitudes (new scales based on Vredin Johansson et al. (2006)/repertory grid interviews)
Flexibility (3 measures)
- That a means of transport is available right away is… (N=519, M=4.3, SD=0.77, ρii=0.49)
- That a means of transport can be used spontaneously and without planning is… (N=519,
M=4.3, SD=0.82, ρii=0.42)
- That a means of transport reaches its final destination without a detour or change is…
(N=519, M=4.2, SD=0.86, ρii=0.32)
Convenience/Comfort (3 measures)
- That a means of transport is exceedingly convenient and comfortable is… (N=519, M=3.6,
SD=0.97, ρii=0.38)
- That using a means of transport is stress-free and relaxed is… (N=519, M=3.9, SD=0.86,
ρii=0.23)
- That you do not have to worry about anything while using the means of transport is…
(N=519, M=3.5, SD=1.07, ρii=0.22)
Security (1 measure)
- That you own the means of transport is…(N=519, M=3.6, SD=1.22, ρii=0.80fixed)
- That a means of transport is as secure as possible is… (eliminated)
- That a means of transport can be used allone or with friends is… (eliminated)
Notes: Five-point scale, not important at all to very important Personal values (based on Schwartz et al. (2001))
Power (2 measures)
- She/he always wants to be the one who makes the decisions. She/He likes to be the leader.
(N=516 , M=3.6, SD=1.33, ρii=0.63)
- It is important to her/him to be in charge and tell others what to do. She/He wants people to
do what she/he says. (N=516, M=3.3, SD=1.32, ρii=0.53)
- It is important to her/him to be rich. She/He wants to have a lot of money and expensive
things. (eliminated)
Hedonism (3 measures)
- She/He seeks every chance she/he can to have fun. It is important to her/him to do things
that give her/him pleasure. (N=515, M=4.6, SD=1.09, ρii=0.52)
- She/He really wants to enjoy life. Having a good time is very important to her/him.
(N=514, M=4.6 , SD=1.13, ρii = 0.46)
- Enjoying life’s pleasures is important to her/him. She/He likes to ‘spoil’ herself/himself.
(N=516, M =4.5, SD=1.25, ρii=0.37)
Security (4 measures)
- It is very important to her/him that her/his country be safe. She/He thinks the state must be
on watch against threats. (N=515, M=4.5, SD=1.24, ρii=0.39)
- It is important to her/him to live in secure surroundings. She/He avoids anything that might
endanger her/his safety. (N=515, M=4.3, SD=1.22, ρii=0.28)
- Having a stable government is important to her/him. She/He is concerned that the social
- It is important to her/him that things be organized and clean. She/He really does not like
things to be a mess. (N=515, M=4.5, SD=1.35, ρii=0.25)
- She/He tries hard to avoid getting sick. Staying healthy is very important to her/him.
(eliminated)
Notes: Six-point scale, very dissimilar to very similar
Table 2
Construct reliability and validity measures
Construct 1 2 3 4 5 6 1. Flexibility .67, .41 2. Ease-of-use .45 .53, .27 3. Possession .13 .09 .80, .80a 4. Power .06 .07 .01 .78, .58 5. Hedonism .02 .13 .02 .03 .70, .44 6. Security .05 .31 .08 .03 .03 .62, .42
Notes: Entries on the diagonal represent (1) Bagozzi’s (1980) construct reliability ρc and (2)
Fornell & Larcker’s (1981) average variance extracted ρave.
The off-diagonal elements are squared correlations among the constructs. All intercorrelations are significant at p < 0.05
a
Table 3
Robust ML parameter estimates for the traditional and ICLV model
Traditional MNL model ICVL model
Explanatory
variable/parameter Estimate t-statistic Estimate t-statistic
Flexibility1 ⎯ ⎯ 0.38** 2.41 Flexibility2 ⎯ ⎯ 0.02 0.08 Conv./Comf.1 ⎯ ⎯ –0.59* –1.88 Conv./Comf.2 ⎯ ⎯ –0.02 –0.04 Safety1 ⎯ ⎯ 0.55*** 2.67 Safety2 ⎯ ⎯ 0.39 1.63
Travel time car1,2 –1.64*** –2.79 –1.55** –2.32
Travel time PT2,3 –1.24*** –2.92 –1.32*** –2.76
Distance Bus2 –0.01 –0.35 –0.01 –0.25
Distance Bus3 –0.04 –0.42 –0.04 –0.45
Distance other PT2 –0.13** –2.05 –0.12** –2.22
Distance other PT3 –0.10** –2.06 –0.10** –2.02
Cars per person1 3.76*** 5.22 3.74*** 5.18
Cars per person2 2.46*** 3.01 2.40*** 2.98
Railcard owner1 –2.27*** 3.22 –2.34*** –2.99 Railcard owner2 –0.06 –0.08 –0.07 –0.10 Mode constant1 –0.29 –0.35 –0.05 –0.05 Mode constant2 –0.36 –0.39 –0.15 –0.16 LL –11,737 –11,726 McFadden’s R2 0.16 0.19 AIC 23,691 23,681 BICadj 23,807 23,804
Notes: Variable subscripts denote travel mode 1=car, 2=car + public transport, 3=public transport only. A constants-only model was used to determine McFadden’s pseudo R2.
***
Table 4
Robust ML parameter estimates for the effects of personal values and socio-demographic variables on attitudes toward mode choice
Explanatory variable Dependent variable Estimate t-statistic
Power Flexibility (R2=.22) .25*** 2.76 Hedonism .15* 1.92 Security .36*** 2.88 Age –0.16* –1.78 Gender 0.05 0.79 Income 0.23*** 3.57 Power Comf./Conv. (R2=.45) .22** 2.15 Hedonism .29** 2.53 Security .29*** 3.63 Age –0.08 –0.82 Gender 0.04 0.66 Income 0.01 0.20 Power Safety (R2=.12) .10 1.59 Hedonism .16** 2.34 Security .25*** 2.86 Age 0.10 1.41 Gender 0.10* 1.85 Income 0.05 1.03
Notes: Standardized parameter estimates; ***p<0.01, **p<0.05, * p<0.10
Table 5
Robust ML parameter estimates for the effects of socio-demographic variables on personal values
Explanatory variable Dependent variable Estimate t-statistic
Age Power (R2=.04) 0.08 1.46 Gender –0.15*** –2.98 Income 0.06 1.02 Age Hedonism (R2=.10) –0.25*** –4.45 Gender –0.09* –1.71 Income –0.14*** –2.89 Age Security (R2=.22) 0.47*** 5.82 Gender 0.04 0.66 Income –0.05 –0.92
Fig. 1. Framework for integrated choice and latent variable models Latent variable η1 Utility U Observed choice d Latent variable model
Discrete choice model
measurement relationships
(adapted from Ben-Akiva et al. 1999, p.195)
Indicator y1 Indicator y2 Indicator y • • • Observed exogenous variable(s) x Latent variable η2 Latent variable ηΜ • • • p1 structural relationships in the latent variable model structural relationships in the discrete choice model
Latent variable η1 Utility U Observed choice d Latent variable model
Discrete choice model
measurement relationships
(adapted from Ben-Akiva et al. 1999, p.195)
Indicator y1 Indicator y2 Indicator y • • • Observed exogenous variable(s) x Latent variable η2 Latent variable ηΜ • • • p1 structural relationships in the latent variable model structural relationships in the discrete choice model
Fig. 2. Structure of the integrated choice and hierarchical latent variable model on mode choice Travel time car Values Attitudes Indicators Indicators Travel time public transport Distance to bus Distance to other public transport Number of Cars per adult person
Mode utility Socio-demographic variables Railcard ownership Observed choice alternative-specific attributes mode-related individual-specific attributes P1 P2 P4
P1, P2, ... P7: Propositions guiding the study P3 P5 P6 P7 Travel time car Values Attitudes Indicators Indicators Travel time public transport Distance to bus Distance to other public transport Number of Cars per adult person
Mode utility Socio-demographic variables Railcard ownership Observed choice alternative-specific attributes mode-related individual-specific attributes P1 P2 P4
P1, P2, ... P7: Propositions guiding the study P3
P5 P6