Procedia Computer Science 70 ( 2015 ) 69 – 75
1877-0509 © 2015 The Authors. Published by Elsevier B.V. This is an open access article under the CC BY-NC-ND license (http://creativecommons.org/licenses/by-nc-nd/4.0/).
Peer-review under responsibility of the Organizing Committee of ICECCS 2015 doi: 10.1016/j.procs.2015.10.038
ScienceDirect
* Corresponding author. Tel: +918187826124 E-mail address: [email protected]
4
thInternational Conference on Eco-friendly Computing and Communication Systems
A modified BM3D algorithm for SAR image despeckling
*MuraliMohanBabu. Y
a, Subramanyam. M. V
b, GiriPrasad. M. N
ca
SVCET, RVS Nagar, Chittoor, 517127, Andhra Pradesh, India.
b
SREC, Nandyal, Kurnool, 518501, Andhra Pradesh, India.
c
JNTUA, Anantapur, 515002, Andhra Pradesh, India.
Abstract
In synthetic aperture radar (SAR) imaging, pulses of microwave energy are transmitted towards the ground surface (target). The backscattered signal energy is measured at the receiving end. In this process, a speckle noise is added because of the coherent imaging system and makes the study of images very difficult. For better SAR image processing, the speckle has to be removed in the initial stages of processing and maintain all texture features efficiently. The (Block Matching 3D algorithm) BM3D method is generally considered as state of art method in denoising of SAR images. Still some amount of speckle left with images. This is due to sampling conversion at transmitter and receiver. In this paper, it is proposed a technique to despeckle the speckle noise to the maximum extent while maintaining the edge characteristics. This technique uses un-sampling at both the ends. © 2014 The Authors. Published by Elsevier B.V.
Peer-review under responsibility of organizing committee of the International Conference on Eco-friendly Computing and Communication Systems (ICECCS 2015).
Keywords: BM3D; Image ; SAR; Speckle;Wavelet;
1. Introduction
Generally, optical remote sensing is being utilized in various applications associated to studies of earth resources, mapping, glacier monitoring and monitoring of the environment. Signal that is used in optical remote sensing cannot penetrate through clouds and fog. It is because of its low in wavelength1, 2. In that particular situations, SAR imaging plays a very important role to get data for a specified period of time as SAR sensors are capable of gathering information in all types of weather conditions3, 4. The utility of SAR images may be greatly improved by the removal of this speckle noise. Speckle noise is created in an image by both the properties of the illuminating radar beam and the objects being imaged. Because of the complexity of the image formation process in SAR systems and the © 2015 The Authors. Published by Elsevier B.V. This is an open access article under the CC BY-NC-ND license
(http://creativecommons.org/licenses/by-nc-nd/4.0/).
complexity of the scenes that are imaged, the process of removing the noise can be extremely difficult. Some people have taken simple assumptions about the properties of the image and developed simple methods for noise reduction.
2. Block matching 3D algorithm (BM3D)
Some amount of speckle is removed in the process of multilooking in preprocessing stage at the cost of spatial resolution. To eliminate the remaining speckle, a filter technique or a transform technique has to be applied. The BM3D procedure contains two steps5. First one is threshold based filtering and second one is wiener filter based filtering. In first step, a reference block has to be compared with other blocks of the total image6. The euclidean distance has to be calculated and if the distance is less than a threshold, it has to be given to hard thresholding of the discrete wavelets. Euclidean threshold and hard threshold plays an important role in this process7. The decision of choosing of these two thresholds is based on noise present in the image, size of the image, size of the block and the application that is going to be used. The output of hard thresholding has to be given to inverse discrete wavelets. Then the reference block has to be shifted to next block and same procedure has to be repeated. In the second step, the total process is same except the hard thresholding. In the place of hard thresholding, wiener filtering has to be applied8.
3. A modified Block matching 3D algorithm
The radar image has to be cropped according to user's applications size15. The necessary sized image will be given to non-decimated wavelet transform and extract the all possible coefficients from it. After separating the coefficients with some threshold, the required coefficients will be collected and they will be given to inverse non decimated wavelet transform9.
The output image of previous step will be divided into different blocks with a fixed size. Each block will be compared with other blocks and euclidean distance will be calculated. If the distance is below a threshold value, then the block will be given to discrete wavelet transform and the coefficients will be extracted10, 11. Manipulation of coefficients will be done based on some hard thresholding and an inverse discrete wavelet transform will be applied to reconstruct the image as shown in figure 1.
The last obtained image will be given to discrete wavelet transform once again and calculate all possible coefficients. A Wiener filter will be applied on specific set of coefficient values and an inverse discrete wavelet transform will be applied to get final despeckled image12. After completion of one set of block comparison, it has to be shifted to next block and same procedure has to be repeated until to cover total image13, 14.
The quality parameters like Equivalent Number Looks (ENL), Speckle Suppression Index (SSI), Correlation Coefficient (CC), Edge Saving or Preserving Index (ESI) and Peak Signal to Noise Ratio (PSNR) will be measured for all the output images of different despeckling methods along with proposed algorithm.
4. Results and discussions
The proposed algorithm and some existing algorithms have been applied and tested for SPOT-VV image data of TerraSAR-X satellite of 512*512 standard size. The noised image is obtained when the noise variance added to the original image is 0.1. It is shown in figure 2.
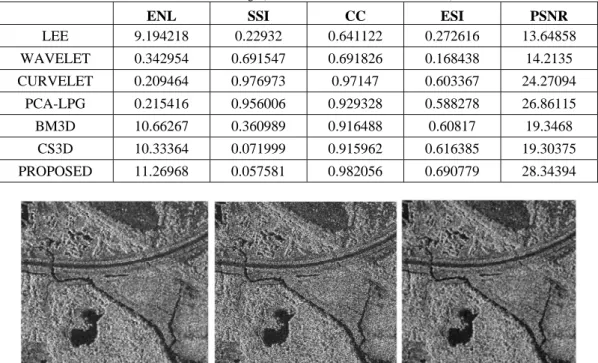
The value of equivalent number of looks obtained with proposed method is 11.269 which is best among all the values obtained through other techniques. It shows the quality of the despeckled image. If the ENL value is high it means that the quality of the denoised image is high and vice versa. The ENL value plays a decisive role in the microwave imagery. Table 1 contains the quality factors of different methods and corresponding images have been shown in figure 2.
Ļ
Ļ
Y
N
[
Fig.1: Flowchart of proposed despeckling technique
NDWT
EXTRACTING THE COEEFICIENTS
INDWT
CONSIDER A BLOCK - B
2CONSIDER A BLOCK - B
1DWT
HARD THRESHOLDING
IDWT
WIENER FILTER
DWT
IDWT
DESPECKLED IMAGE
IF DISTANCE
THRESHOLDING
IMAGE
The value of speckle suppression index obtained with proposed method is 0.057 which is best and least among all the values obtained with other techniques. The SSI value of proposed method is less than the BM3D method. It is because of un-sampling of the data at the both the ends. Where as in BM3D, down sampling at transmitting end and up sampling at receiving end has to be done. Because of this sampling changes, the quality of the images are not obtained up to the expectations.
The value of correlation coefficient obtained with proposed method is 0.982 which is best among all the values obtained with other techniques. The ideal value of CC is 1, which means that the denoised image is almost similar to original image. Among all despeckling methods, the proposed method has given reasonable edge saving index and when its value is 0.69. This value plays critical role in image processing. To have good clarity and quality in the image, this value should be maximum. The peak signal to noise ratio is a very important parameter in denoising of images. Maximum value says that the image is good quality. It shows the quality of denoised imagery and its value should be high. It's value has been measured as 28.34.
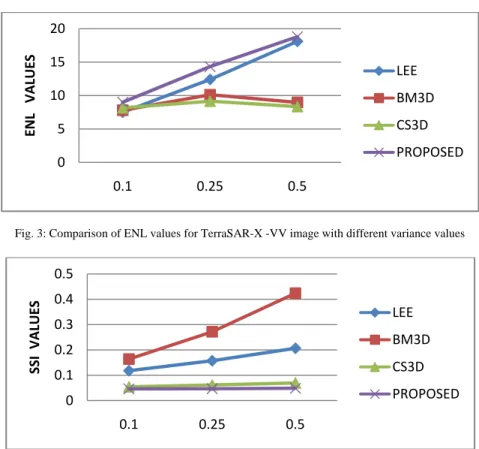
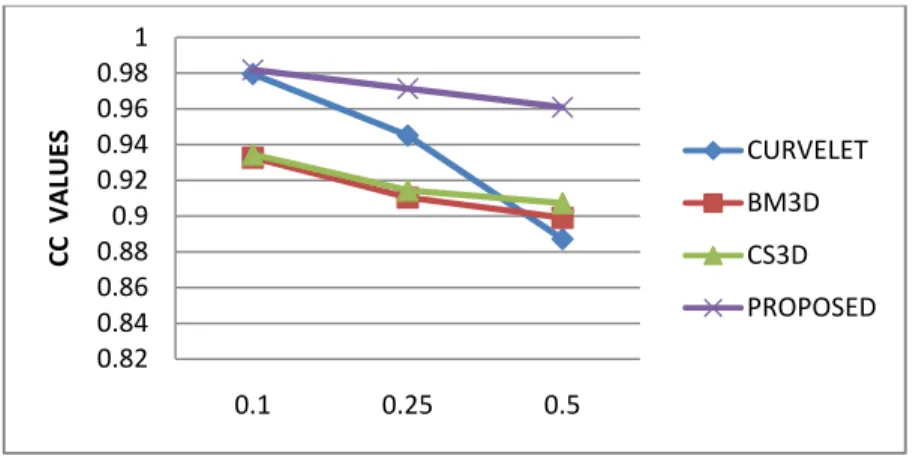
The proposed method and existing methods have been applied and tested with noise variance values of 0.25 and 0.5 for the same image. The quality parameters like ENL, CC, SSI, ESI and PSNR have been calculated with different variances for the same image. Figure 3 shows the comparison of different transform techniques to evaluate ENL value for different variance values like 0.1, 0.25 and 0.5.Our proposed method gave better ENL compared to other methods. But lee method is also giving good ENL. Because of this reason all the softwares are using lee filter for denoising of SAR images. Figure 4 shows the comparison of different transform techniques to evaluate SSI for different variance values like 0.1, 0.25 and 0.5. Figure 5 shows the comparison of different transform techniques to evaluate CC for different variance values like 0.1, 0.25 and 0.5. Figure 6 shows the comparison of different transform techniques to evaluate ESI for different variance values like 0.1, 0.25 and 0.5. But lee is failed to preserve the edges. Our method gave appreciable value of ESI. This happened because of non sampling of the data. Figure 7 shows the comparison of different transform techniques to evaluate PSNR for different variance values like 0.1, 0.25 and 0.5.
Table 1: Quantitative comparison of despeckling techniques for TerraSAR-X - VV image (Noise variance= 0.1 and size= 512*512)
ENL SSI CC ESI PSNR
LEE 9.194218 0.22932 0.641122 0.272616 13.64858 WAVELET 0.342954 0.691547 0.691826 0.168438 14.2135 CURVELET 0.209464 0.976973 0.97147 0.603367 24.27094 PCA-LPG 0.215416 0.956006 0.929328 0.588278 26.86115 BM3D 10.66267 0.360989 0.916488 0.60817 19.3468 CS3D 10.33364 0.071999 0.915962 0.616385 19.30375 PROPOSED 11.26968 0.057581 0.982056 0.690779 28.34394 (a) (b) (c)
(d) (e) (f)
(g) (h) (i)
Fig. 2: (a) Original SAR image (TerraSAR-X -VV), (b) Noisy image (V=0.1), (c) Lee denoised image, (d) Wavelet denoised image, (e) Curvelet denoised image, (f) PCA-LPG denoised image, (g) BM3D denoised image,
(h) CS3D denoised image and (i) Proposed denoised image.
Fig. 3: Comparison of ENL values for TerraSAR-X -VV image with different variance values
Fig. 4: Comparison of SSI values for TerraSAR-X -VV image with different variance values 0 5 10 15 20 0.1 0.25 0.5 ENL VALUES LEE BM3D CS3D PROPOSED 0 0.1 0.2 0.3 0.4 0.5 0.1 0.25 0.5 SSI VALUES LEE BM3D CS3D PROPOSED
Fig. 5: Comparison of CC values for TerraSAR-X -VV image with different variance values
Fig. 6: Comparison of ESI values for TerraSAR-X -VV image with different variance values
Fig. 7: Comparison of PSNR values for TerraSAR-X -VV image with different variance values
Acknowledgements
The authors would like to thank Indian Space Research Organization (ISRO) and German Aerospace Center for providing Synthetic Aperture Radar data.
0.82 0.84 0.86 0.88 0.9 0.92 0.94 0.96 0.98 1 0.1 0.25 0.5 CC VALUES CURVELET BM3D CS3D PROPOSED 0 0.1 0.2 0.3 0.4 0.5 0.6 0.7 0.8 0.1 0.25 0.5 ESI VALUES PCAͲLPG BM3D CS3D PROPOSED 0 5 10 15 20 25 30 35 0.1 0.25 0.5 PSNR CURVELET BM3D CS3D PROPOSED
References
1. Lee, J. S. and E. Pottier, Polarimetric Radar Imaging from Basics to Applications, CRC Press, 2009.
2. Iqbal, M.; Chen, J.; Yang, W.; Wang, P.; and Sun, B.; "SAR image despeckling by selective 3D filtering of multiple compressive reconstructed images," Progress In Electromagnetics Research, vol.134, issue 12, 209-226, 2013.
3. Frost, V. S., J. A. Stiles, K. S. Shanmugan, and J. C. Holtzman, A model for radar images and its application to adaptive digital filtering of multiplicative noise," IEEE Transactions on Pattern Analysis and Machine Intelligence, Vol. 4, No. 2, 157- 166, Mar. 1982.
4. Lopes.A, Nezry.E, Touzi.R, and Laur.H, “Maximum a posteriori speckle filtering and first order texture models in SAR images,” in Proc. IEEE Int. Geosci. Remote Sens. Symp., vol. 3, 2409-2412, 1990.
5. Gagnon.L and Jouan.A, “Speckle filtering of SAR images-A comparative study between complex-wavelet-based and standard filters,” in Proc.SPIE, 80-91,1997.
6. Argenti.F and Alparone.L, “Speckle removal from SAR images in the undecimated wavelet domain,” IEEE Trans. Geosci. Remote Sens., vol. 40, no. 11, 2363-2374, Nov. 2002.
7. Zhang.L, Dong.W, Zhang.D, and Shi.G, “Two-stage image denoising by principal component analysis with local pixel grouping,” Pattern Recog., vol. 43, no. 4, 1531-1549, Apr. 2010.
8. Coupé.P, Hellier.P, Kervrann.C, and Barillot.C, “Bayesian non local means-based speckle filtering,” in Proc. 5th IEEE Int. Symp. Biomed. Imaging, 1291-1294, May 2008.
9. Dabov.K, Foi.A, Katkovnik.V, and Egiazarian.K, “Image denoising by sparse 3D transform-domain collaborative filtering,” IEEE Trans. Image Process., vol. 16, no. 8, 2080-2095, Aug. 2007.
10. Parrilli, S., M. Poderico, C. V. Angelino, and L. Verdoliva, A nonlocal SAR image denoising algorithm based on llmmse wavelet shrinkage," IEEE Transactions on Geoscience and Remote Sensing, Vol. 50, No. 2, 606-616, Feb. 2012.
11. Goodman.J.W, “Some fundamental properties of speckle,” Journal of the Optical Society of America, vol. 66, no. 11, 1145-1150, 1976. 12. Y.MuraliMohanBabu, M.V.Subramanyam & M.N.Giriprasad “Bayesian Denoising of SAR Image” International Journal of Computer
Science & Technology, vol.2, no.1, 72-74, 2011,
13. J.-S. Lee, M. R. Grunes, D. L. Schuler, E. Pottier, and L. Ferro-Famil, “Scattering-model-based speckle filtering of Polarimetric SAR data,” IEEE Transactions on Geoscience and Remote Sensing, vol. 44, no. 1, 176- 187, 2006.
14. Chang.S.G, Yu.B, and Vetterli.M, “Spatially adaptive wavelet thresholding with context modeling for image denoising,” IEEE Trans. Image Processing, vol. 9, 1522–1531, Sept. 2000.
15. Y.Murali Mohan Babu, M.V. Subramanyam & M.N.Giriprasad “PCA based image denoising", Signal & Image Processing : An International Journal (SIPIJ) Vol.3, No.2, 236-244, April 2012.