S O F T W A R E
Open Access
Lighter: fast and memory-efficient sequencing
error correction without counting
Li Song
1, Liliana Florea
1,2and Ben Langmead
1,2*Abstract
Lighter is a fast, memory-efficient tool for correcting sequencing errors. Lighter avoids countingk-mers. Instead, it uses a pair of Bloom filters, one holding a sample of the inputk-mers and the other holdingk-mers likely to be correct. As long as the sampling fraction is adjusted in inverse proportion to the depth of sequencing, Bloom filter size can be held constant while maintaining near-constant accuracy. Lighter is parallelized, uses no secondary storage, and is both faster and more memory-efficient than competing approaches while achieving comparable accuracy.
Introduction
The cost and throughput of DNA sequencing have improved rapidly in the past several years [1], with recent advances reducing the cost of sequencing a single human genome at 30-fold coverage to around $1,000 [2]. With these advances has come an explosion of new software for analyzing large sequencing datasets. Sequencing error correction is a basic need for many of these tools. Remov-ing errors can also improve the accuracy, speed and memory-efficiency of downstream tools, particularly for
de novoassemblers based on De Bruijn graphs [3,4]. To be useful in practice, error correction software must make economical use of time and memory even when input datasets are large (many billions of reads) and when the genome under study is also large (billions of nucleotides). Several methods have been proposed, cov-ering a wide tradeoff space between accuracy, speed and memory- and storage-efficiency. SHREC [5] and HiTEC [6] build a suffix index of the input reads and locate errors by finding instances where a substring is followed by a character less often than expected. Coral [7] and ECHO [8] find overlaps among reads and use the resulting multi-ple alignments to detect and correct errors. Reptile [9] and Hammer [10] detect and correct errors by examining each
k-mer’s neighborhood in the dataset’s k-mer Hamming graph.
*Correspondence: [email protected]
1Department of Computer Science, Johns Hopkins University, 21218, Baltimore, USA
2McKusick-Nathans Institute of Genetic Medicine, Johns Hopkins University School of Medicine, 21205, Baltimore, USA
The most practical and widely used error correction methods descend from the spectral alignment approach introduced in the earliest De Bruijn graph based assem-blers [3,4]. These methods count the number of times each k-mer occurs (its multiplicity) in the input reads, then apply a threshold such that k-mers with multiplic-ity exceeding the threshold are considered solid. These
k-mers are unlikely to have been altered by sequencing errors. k-mers with low multiplicity (weak k-mers) are systematically edited into high-multiplicityk-mers using a dynamic-programming solution to the spectral alignment problem [3,4] or, more often, a fast heuristic approxima-tion. Quake [11], one of the most widely used error correc-tion tools, uses a hash-basedk-mer counter called Jellyfish [12] to determine which k-mers are correct. CUDA-EC [13] was the first to use a Bloom filter as a space-efficient alternative to hash tables for counting k-mers and for representing the set of solidk-mers. More recent tools, such as Musket [14] and BLESS [15], use a combination of Bloom filters and hash tables to count k-mers or to represent the set of solidk-mers.
Lighter (LIGHTweight ERror corrector) is also in the family of spectral alignment methods, but differs from previous approaches in that it avoids counting k-mers. Rather than countk-mers, Lighter samplesk-mers ran-domly, storing the sample in a Bloom filter. Lighter then uses a simple test applied to each position of each read to compile a set of solidk-mers, stored in a second Bloom filter. These two Bloom filters are the only sizable data structures used by Lighter.
A crucial advantage is that Lighter’s parameters can be set such that memory footprint and accuracy are near constant with respect to depth of sequencing. That is, no matter how deep the coverage, Lighter can allocate the same sized Bloom filters and achieve nearly the same: (a) Bloom filter occupancy, (b) Bloom filter false positive rate and (c) error correction accuracy. Lighter does this without using any disk space or other secondary memory. This is in contrast to BLESS and Quake/Jellyfish, which use secondary memory to store some or all of thek-mer counts.
Lighter’s accuracy is comparable to competing tools. We show this both in simulation experiments where false positives and false negatives can be measured, and in real-world experiments where read alignment scores and assembly statistics can be measured. Lighter is also very simple and fast, faster than all other tools tried in our experiments. These advantages make Lighter quite practi-cal compared to previous counting-based approaches, all of which require an amount of memory or secondary stor-age that increases with depth of coverstor-age. Lighter is free open-source software available from [16].
Method
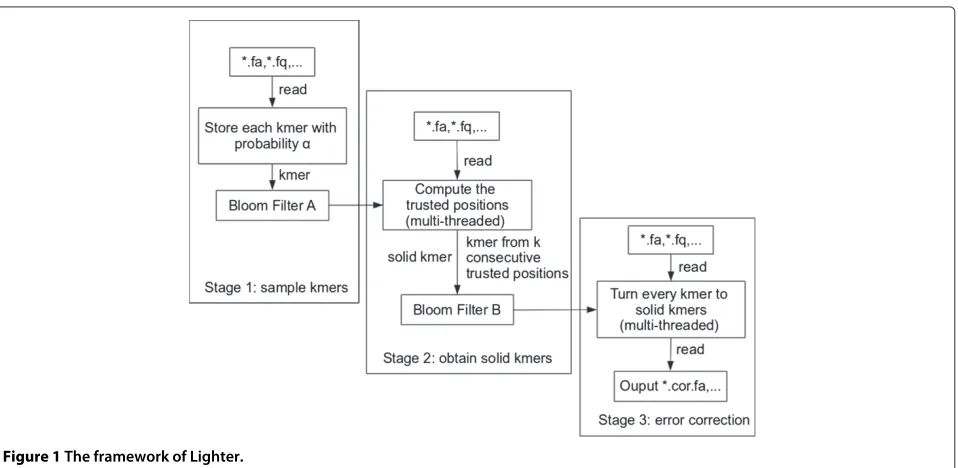
Lighter’s workflow is illustrated in Figure 1. Lighter makes three passes over the input reads. The first pass obtains a sample of thek-mers present in the input reads, storing the sample in Bloom filter A. The second pass uses Bloom filter A to identify solidk-mers, which it stores in Bloom filter B. The third pass uses Bloom filter B and a greedy procedure to correct errors in the input reads.
Bloom filter
A Bloom filter [17] is a compact probabilistic data struc-ture representing a set. It consists of an array ofmbits, each initialized to 0. To add an itemo,hindependent hash functions H0(o),H1(o),. . .,Hh−1(o) are calculated. Each mapso to an integer in [0,m) and the correspondingh
array bits are set to 1. To test if itemqis a member, the same hash functions are applied to q. q is a member if all corresponding bits are set to 1. A false positive occurs when the corresponding bits are set to 1 ‘by coincidence’, that is, because of items besidesq that were added pre-viously. Assuming the hash functions map items to bit array elements with equal probability, the Bloom filter’s
false positive rate is approximately1−e−hmn h
, where
n is the number of distinct items added, which we call the cardinality. Givenn, which is usually determined by the dataset,mandhcan be adjusted to achieve a desired false positive rate. Lower false positive rates can come at a cost, since greater values of mrequire more memory and greater values ofhrequire more hash function calcu-lations. Many variations on Bloom filters have been pro-posed that additionally permit compression of the filter, storage of count data, representation of maps in addition to sets, etc. [18]. Bloom filters and variants thereon have been applied in various bioinformatics settings, including assembly [19], compression [20],k-mer counting [21] and error correction [13].
[image:2.595.61.540.495.729.2]By way of contrast, another way to represent a set is with a hash table. Hash tables do not yield false positives, but Bloom filters are far smaller. Whereas a Bloom filter is an array of bits, a hash table is an array of buckets, each large
enough to store a pointer, key or both. If chaining is used, lists associated with buckets incur additional overhead. While the Bloom filter’s small size comes at the expense of false positives, these can be tolerated in many settings including in error correction.
Lighter’s efficiency depends on the efficiency of the Bloom filter implementation. Specifically Lighter uses a
pattern-blockedBloom filter to decrease overall the num-ber of cache misses and improve efficiency. This comes at the expense of needing a slightly larger filter to achieve a comparable false positive rate to a standard filter, as discussed in Additional file 1: Supplementary Note 1.
In our method, the items to be stored in the Bloom fil-ters arek-mers. Because we would like to treat genome strands equivalently for counting purposes, we will always
canonicalize a k-mer before adding it to or using it to query a Bloom filter. A canonicalized k-mer is either thek-mer itself or its reverse complement, whichever is lexicographically prior.
Sequencing model
We use a simple model to describe the sequencing pro-cess and Lighter’s subsampling. The model resembles one suggested previously [22]. LetK be the total number of
k-mers obtained by the sequencer. We say a k-mer is
incorrectif its sequence has been altered by one or more sequencing errors. Otherwise it iscorrect. Let be the fraction ofk-mers that are incorrect. We assume does not vary with the depth of sequencing. The sequencer obtains correct k-mers by sampling independently and uniformly fromk-mers in the genome. Let the number of
k-mers in the genome beG, and assume all are distinct. Ifκcis a random variable for the multiplicity of a correct k-mer in the input,κcis binomial with success probability 1/Gand number of trials(1−)K:
κc∼Binom((1−)K, 1/G).
Since the number of trials is large and the success prob-ability is small, the binomial is well approximated by a Poisson:
κc∼Pois(K(1−)/G).
A sequencedk-mer survives subsampling with probabil-ityα. Ifκcis a random variable for the number of times a correctk-mer appears in the subsample:
κc∼Binom((1−)K,α/G),
which is approximately Pois(αK(1−)/G).
We model incorrect k-mers similarly. The sequencer obtains incorrectk-mers by sampling independently and uniformly fromk-mers ‘close to’ ak-mer in the genome. We might define these as the set of allk-mers with low but non-zero Hamming distance from some genomick-mer.
Ifκeis a random variable for the multiplicity of an incor-rect k-mer, κe is binomial with success probability 1/H and number of trialsK:κe ∼ Binom(K, 1/H), which is approximately Pois(K/H). It is safe to assumeH G. κ
e∼Pois(αK/H)is a random variable for the number of times an incorrectk-mer appears in the subsample.
Others have noted that, given a dataset with deep and uniform coverage, incorrect k-mers occur rarely while correctk-mers occur many times, proportionally to cov-erage [3,4].
Stages of the method First pass
In the first pass, Lighter examines each k-mer of each read. With probability 1 − α, the k-mer is ignored. k -mers containing ambiguous nucleotides (e.g. ‘N’) are also ignored. Otherwise, thek-mer is canonicalized and added to Bloom filter A.
Say a distinctk-meraoccurs a total ofNatimes in the dataset. If none of the Na occurrences survive subsam-pling, thek-mer is never added to A and A’s cardinality is reduced by one. Thus, reducingα can in turn reduce A’s cardinality. Because correctk-mers are more numer-ous, incorrectk-mers tend to be discarded from A before correctk-mers asαdecreases.
The subsampling fraction α is set by the user. We suggest adjusting α in inverse proportion to depth of sequencing, for reasons discussed below. For experiments described here, we setα = 0.1 when the average cover-age is 70-fold. That is, we setα to 0.1(70/C), whereCis average coverage.
Second pass
A read position is overlapped by up tox k-mers, 1≤x≤ k, wherexdepends on how close the position is to either end of the read. For a position altered by sequencing error, the overlappingk-mers are all incorrect and are unlikely to appear in A. We apply a threshold such that if the num-ber ofk-mers overlapping the position and appearing in Bloom filter A is less than the threshold, we say the posi-tion is untrusted. Otherwise we say it is trusted. Each instance where the threshold is applied is called atest case. When one or more of thex k-mers involved in two test cases differ, we say the test cases are distinct.
LetP∗(α)be the probability an incorrectk-mer appears in A, taking the Bloom filter’s false positive rate into account. If random variableBe,x represents the number ofk-mers appearing in A for an untrusted position over-lapped byx k-mers:
Be,x ∼Binom(x,P∗(α)).
We define thresholds yx, for each xin [1,k]. yx is the minimum integer such that:
Ignoring false positives for now, we model the prob-ability of a sequenced k-mer having been added to A as:
P(α)=1−(1−α)f(α). We define:
f(α)=max{2, 0.2/α}.
That is, we assume the multiplicity of a weakk-mer is at mostf(α), which will often be a conservative assumption, especially for smallα. It is also possible to defineP(α)in terms of random variablesκeandκe, but we avoid this here for simplicity.
A property of this threshold is that whenαis small:
P(α/z)=1−(1−α/z)0.2z/α≈1−(1−α)0.2/α=P(α), wherezis a constant greater than 1 and we use the fact that:
(1−α/z)z≈1−α.
ForP∗(α), we additionally take A’s false positive rate into account. If the false positive rate isβ, then:
P∗(α)=P(α)+β−βP(α).
Once all positions in a read have been markedtrustedor
untrustedusing the threshold, we find all instances where
ktrusted positions appear consecutively. Thek-mer made up by those positions is added to Bloom filter B.
Third pass
In the third pass, Lighter applies a simple, greedy error correction procedure like that used in BLESS [15]. A read
rof length|r|, contains|r| −k+1k-mers.kidenotes the k-mer starting at read positioni, 1≤i≤ |r| −k+1. We first identify the longest stretch of consecutivek-mers in the read that appear in Bloom filter B. Let kbandkebe thek-mers at the left and right extremes of the stretch. If
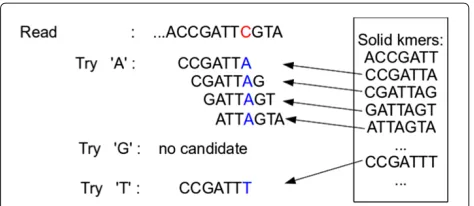
e<|r| −k+1, we examine successivek-mers to the right starting atke+1. For ak-merkithat does not appear in B, we assume the nucleotide at offseti+k−1 is incorrect. We consider all possible ways of substituting for the incor-rect nucleotide. For each substitution, we count how many consecutivek-mers starting withkiappear in Bloom filter B after making the substitution. We pick the substitution that creates the longest stretch of consecutivek-mers in B. The procedure is illustrated in Figure 2.
If more than one candidate substitution is equally good (i.e. results in the same number of consecutive k-mers from B), we call positioni+k−1 ambiguous and make no attempt to correct it. The procedure then resumes start-ing atki+k, or the procedure ends if the read is too short to containk-merki+k.
[image:4.595.304.541.86.189.2]When errors are located near to the end of a read, the stretches of consecutive k-mers used to prioritize substitutions are short. For example, if the error is at
Figure 2An example of the greedy error correction procedure. k-mer CCGATTC does not appear in Bloom filter B, so we attempt to substitute a different nucleotide for the C shown in red. We select A since it yields the longest stretch of consecutivek-mers that appear in Bloom filter B.
the very last position of the read, we must choose a substation on the basis of just one k-mer: the right-most k-mer. This very often results in a tie, and no correction. Lighter avoids many of these ties by con-sidering k-mers that extend beyond the end of the read, as discussed in Additional file 1: Supplementary Note 2.
For better precision, Lighter also limits the corrections that can be made in any window of size k in a read. The default limit is 4, and it is configurable. Corrections at positions with an ‘N’ contribute 0, and corrections at low-quality bases (defined in the Quality score section below) contribute 0.5 toward this limit. All other positions contribute 1.
Scaling with depth of sequencing
Lighter’s accuracy can be made near constant as the depth of sequencing K increases and its memory foot-print is held constant. This is accomplished by holding αK constant, i.e., by adjustingα in inverse proportion to
K. This is illustrated in Tables 1 and 2. We also argue this more formally in Additional file 1: Supplementary Note 3.
Quality score
A low base quality value at a certain position can force Lighter to treat that position as untrusted even if the over-lapping k-mers indicate it is trusted. First, Lighter scans the first 1 million reads in the input, recording the qual-ity value at the last position in each read. Lighter then chooses the fifth-percentile quality value; that is, the value such that 5% of the values are less than or equal to it, say
Table 1 Accuracy measures for datasets simulated with Mason with various sequencing depths and error rates
Coverage 35× 70× 140×
Error rate 1% 3% 1% 3% 1% 3%
αfor Lighter 0.2 0.2 0.1 0.1 0.05 0.05
Quake 89.68 48.77 89.64 48.82 89.59 48.78
SOAPec 57.71 38.00 57.57 37.71 57.09 36.76
Recall Musket 93.75 92.62 93.73 92.64 93.73 92.63
Bless 99.81 99.33 99.82 99.58 99.82 99.58
Lighter 99.87 98.53 99.84 98.72 99.86 98.78
Quake 99.99 99.99 99.99 99.99 99.99 99.99
SOAPec 99.99 100.00 99.99 99.99 99.99 99.99
Precision Musket 99.99 99.93 99.99 99.93 99.99 99.93
Bless 99.73 98.86 99.73 99.35 99.72 99.36
Lighter 99.98 99.96 99.98 99.96 99.98 99.96
Quake 94.55 65.56 94.54 65.61 94.51 65.57
SOAPec 73.18 55.07 73.07 54.77 72.68 53.75
Fscore Musket 96.77 96.14 96.76 96.15 96.76 96.15
Bless 99.77 99.09 99.77 99.47 99.77 99.47
Lighter 99.93 99.24 99.91 99.33 99.92 99.36
Quake 89.67 48.76 89.64 48.82 89.59 48.78
SOAPec 57.70 38.00 57.57 37.71 57.09 36.75
Gain Musket 93.74 92.56 93.72 92.58 93.72 92.57
Bless 99.54 98.19 99.54 98.93 99.54 98.94
Lighter 99.85 98.49 99.81 98.68 99.84 98.73
Quake 17 17 17 17 17 17
SOAPec 17 17 17 17 17 17
k Musket 23 19 23 19 23 19
Bless 31 23 31 23 31 23
Lighter 23 19 23 19 23 19
Rows labeledkshow thek-mer sizes selected for each tool and dataset.
Table 2 Occupancy (fraction of bits set) for Bloom filters A and B for various coverages
Coverage α Bloom A (%) Bloom B (%)
20× 0.35 53.082 34.037
35× 0.2 53.085 34.398
70× 0.1 53.082 34.429
140× 0.05 53.094 34.411
280× 0.025 53.088 34.419
Parallelization
[image:5.595.57.291.646.731.2]same correctk-mer to be added repeatedly to B, we can save synchronization effort by first checking whether the
k-mer is already present and adding it (synchronously) only if necessary. Pass 3 is parallelized by using concur-rent threads to handle subsets of the reads; since Bloom filter B is only being queried, we need not synchronize accesses.
Evaluation
Additional file 1: Supplementary Note 4 describes the computer all experiments were conducted on. Additional file 1: Supplementary Note 5 describes the exact com-mand lines used.
Simulated dataset
Accuracy on simulated data
We compared the performance of Lighter v1.0.2 with Quake v0.3 [11], Musket v1.1 [14], BLESS v0p17 [15] and SOAPec v2.0.1 [23]. We simulated a collection of reads from the reference genome for the K12 strain of
Escherichia coli(NC_000913.2) using Mason v0.1.2 [24]. We simulated six distinct datasets with 101-bp single-end reads, varying average coverage (35×, 75×and 140×) and average error rate (1% and 3%). For a given error rateewe specify Mason parameters-qmbe/2-qme3e, so that the average error rate isebut errors are more common toward the 3end, as in real datasets.
We then ran all four tools on all six datasets, with results presented in Table 1. BLESS was run with the-notrim
option to make the results more comparable. In these comparisons, a true positive (TP) is an instance where an error is successfully corrected, i.e. with the correct base substituted. A false positive (FP) is an instance where a spurious substitution is made at an error-free position. A false negative (FN) is an instance where we either fail to detect an error or an incorrect base is substituted. As done in previous studies [14], we report the following summaries:
recall=TP/(TP+NP), precision=TP/(TP+FP),
Fscore=2×recall×precision/(recall+precision)and gain=(TP−FP)/(TP+FN).
Since these tools are sensitive to the choice of k-mer size, we tried several values for this parameter (17, 19, 23, 27 and 31) and picked the value yielding the greatest gain in the accuracy evaluation. The k-mer sizes chosen are shown in the bottom rows of Table 1. Note that SOAPec’s maximumk-mer size is 27. We found that Quake crashed fork-mer sizes 23 and up.
Unlike the other tools, Quake both trims the untrusted tails of the reads and discards reads it cannot correct. BLESS also trims some reads (even in-notrimmode),
but only a small fraction (0.1%) of them, which has only a slight effect on results. For these simulation experiments, we measure precision and recall with respect to all the nucleotides (even the trimmed ones) in all the reads (even those discarded). This tends to lead to higher precision but lower recall for Quake relative to the other tools.
Apart from Quake, SOAPec, Musket and Lighter achieve the highest precision. Lighter achieves the highest recall, F score and gain in the experiments with 1% error, and is comparable to BLESS when the error rate is 3%.
To see how quality value information affects perfor-mance, we repeated these experiments with quality values omitted (Additional file 1: Table S1). Quake and BLESS accept only FASTQ input files (which include quality values), and so were not included in the experiment. Lighter achieves superior recall, gain andFscore.
To see how the choice of read simulator affects per-formance, we repeated these experiments using the Art [25] simulator to generate the reads instead of Mason (Additional file 1: Table S2). All tools perform quite similarly in this experiment, except SOAPec, which has poor recall compared to the others. There is less dif-ference between tools than in the Mason experiment, likely because Art simulates a relatively low (approxi-mately 0.25%) error rate. Lighter and Musket perform best overall.
For the Mason-simulated 1% error dataset, we found that Lighter’s gain was maximized by setting the k -mer size to 23. We therefore fix the k-mer size to 23 for subsequent experiments, except where otherwise noted.
Caenorhabditis elegans simulation
We performed a similar accuracy test as in the previous section, but using data simulated from the largerC. ele-gansgenome, WBcel235 (Additional file 1: Table S3). We used Mason to simulate a dataset of 101-bp single-end reads with a 1% error rate totaling 35×coverage. We again tried several values for thek-mer size parameter (19, 23, 27 and 31) and picked the value yielding the greatest gain in the accuracy evaluation. As for theE. coliexperiment, Lighter had the greatest recall,Fscore and gain.
Scaling with depth of simulated sequencing
Cardinality of Bloom filter B
We also measured the number of correctk-mers added to table B. We used the Mason dataset with 70×coverage and 1% error rate. TheE. coligenome has 4,564,614 distinct
k-mers, and 4,564,569 (99.999%) of them are in table B.
Effect of ploidy on Bloom filter B
We conducted an experiment like that in the previous section but with Mason configured to simulate reads from a diploid version of the E. coli genome. Specifically, we introduced heterozygous SNPs at 0.1% of the positions in the reference genome. Mason then sampled equal num-bers of reads from both genomes, making a dataset with 70×average coverage in total. Of the 214,567 simulatedk -mers that overlapped a position with a heterozygous SNP, table B held 214,545 (99.990%) of them at the end of the run. Thus, Lighter retained in table B almost the same fraction of thek-mers overlapping heterozygous positions (99.990%) as of thek-mers overall (99.999%).
Musket and BLESS both infer a threshold for the multi-plicity of solidk-mers. In this experiment, Musket inferred a threshold of 10 and BLESS inferred a threshold of 9. All three tools use ak-mer size of 23. By counting the multi-plicity of thek-mers overlapping heterozygous positions, we conclude that Musket would classify 214,458 (99.949%) as solid and BLESS would classify 214,557 (99.995%) as solid. So in the diploid case, it seems Lighter’s ability to identify correctk-mers overlapping heterozygous SNPs is comparable to that of error correctors that are based on counting.
Diploidy is one example of a phenomenon that tends to drive the count distribution for some correct k-mers (those overlapping heterozygous variants) closer to the count distribution for incorrectk-mers. In the Discussion section we elaborate on other such phenomena, such as copy number, sequencing bias and non-uniform coverage.
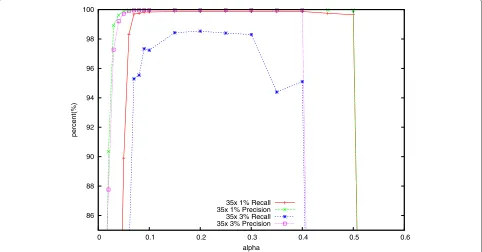
Effect of varyingα
In a series of experiments, we measured how different settings for the subsampling fractionαaffected Lighter’s accuracy as well as the occupancies of Bloom filters A and B. We still use the datasets simulated by Mason with 35×, 70×and 140×coverage.
As shown in Figures 3 and 4, only a fraction of the correctk-mers are added to A whenαis very small, caus-ing many correct read positions to fail the threshold test. Lighter attempts to ‘correct’ these error-free positions, decreasing accuracy. This also has the effect of reducing the number of consecutive stretches ofktrusted positions in the reads, leading to a smaller fraction of correct k -mers added to B, and ultimately to lower accuracy. When α grows too large, the yx thresholds grow to be greater thank, causing all positions to fail the threshold test, as seen in the right-hand side of Figure 4. This also leads to a dramatic drop in accuracy as seen in Figure 3. Between the two extremes, we find a fairly broad range of values forα (from about 0.15 to 0.3) that yield high accuracy when the error rate is 1% or 3%. The range is wider when the error rate is lower.
86 88 90 92 94 96 98 100
0 0.1 0.2 0.3 0.4 0.5 0.6
percent(%)
[image:7.595.58.540.462.714.2]alpha 35x 1% Recall 35x 1% Precision 35x 3% Recall 35x 3% Precision
0 20 40 60 80 100
0 0.1 0.2 0.3 0.4 0.5 0.6
occupancy(%)
alpha 35x Table A
[image:8.595.59.539.87.337.2]35x Table B 70x Table A 70x Table B 140x Table A 140x Table B
Figure 4The effect ofαon occupancy of Bloom filters A and B.The effect ofαon occupancy of Bloom filters A and B using simulated 35×, 70× and 140×datasets. The error rate is 1%.
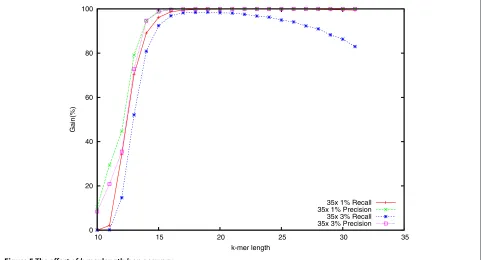
Effect of varying k
A key parameter of Lighter is thek-mer lengthk. Smaller
k yields a higher probability that ak-mer affected by a sequencing error also appears elsewhere in the genome. For larger k, the fraction of k-mers that are correct
decreases, which could lead to fewer correct k-mers in Bloom filter A. We measured how different settings for
k affect accuracy using the simulated data with 35× coverage and both 1% and 3% error rates. Results are shown in Figure 5. Accuracy is high for k-mer lengths
0 20 40 60 80 100
10 15 20 25 30 35
Gain(%)
k-mer length
35x 1% Recall 35x 1% Precision 35x 3% Recall 35x 3% Precision
[image:8.595.58.539.462.722.2]Table 3 Alignment statistics for the 75×Escherichia colidataset
Read level Base level
k Mapped reads Increase (%) Matches/aligned base (%) Increase (%)
Original – 3,464,137 – 99.038 –
Quake 19 3,373,498 −2.62 99.659 0.63
SOAPec 17 3,465,819 0.05 99.130 0.09
Musket 17 3,467,875 0.11 99.601 0.57
BLESS 19 3,468,677 0.13 99.666 0.63
Lighter 19 3,478,658 0.42 99.639 0.61
kcolumn showsk-mer size selected for each tool. First ‘Increase’ column shows percentage increase in reads aligned. Second ‘Increase’ column shows percentage increase in the fraction of aligned bases that match the reference genome. The original row is before error correction and the other rows are after error correction.
ranging from about 18 to 30 when the error rate is 1%. But the recall drops gradually when the error rate is 3%.
Real datasets Escherichia coli
Next we benchmarked the same error correction tools using a real sequencing dataset, [EMBL-SRA ERR022075]. This is a deep DNA sequencing dataset of the the K-12 strain of theE. coligenome. To obtain a level of coverage more reflective of other projects, we randomly subsam-pled the reads in the dataset to obtain roughly 75× cov-erage (approximately 3.5 million reads) of theE. coliK-12 reference genome. The reads are 100× 102 bp paired-end reads. Because BLESS cannot handle paired-paired-end reads where the ends have different lengths, we truncated the last two bases from the 102-bp end before running our experiments. We again ran BLESS with the -notrim
option.
These data are not simulated, so we cannot mea-sure accuracy directly. But we can meamea-sure it indirectly, as other studies have [15], by measuring read align-ment statistics before and after error correction. We use Bowtie2 [26] v2.2.2 with default parameters to align the original reads and the corrected reads to theE. coliK-12 reference genome. For each error corrector, we tested dif-ferentk-mer sizes (17, 19, 23, 27 and 31) and chose the size that yielded the greatest total number of matching aligned nucleotides. For Quake and BLESS, we use only the reads
(and partial reads) that remained after trimming and dis-carding for this evaluation. Results are shown in Table 3. Lighter yields the greatest improvement in fraction of reads aligned, whereas Quake and BLESS yield the great-est improvement in fraction of aligned bases that match the reference, with Lighter very close behind. As before, Quake is hard to compare to the other tools because it trims and discards many reads.
We repeated this experiment using a less sensitive set-ting for Bowtie 2 (Additional file 1: Table S4) and using BWA-MEM [27] v0.7.9a-r786 to align the reads instead of Bowtie 2 (Additional file 1: Table S5) and found that the error correction tools performed similarly relative to each other.
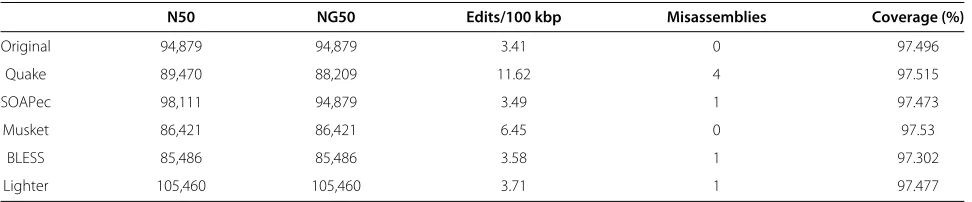
To assess accuracy further, we assembled the reads before and after error correction and measured relevant assembly statistics using Quast [28]. The corrected reads are those reported in Table 3. We used Velvet 1.2.10 [29] for assembly. Velvet is a De Bruijn graph-based assembler designed for second-generation sequencing reads. A key parameter of Velvet is the De Bruijn graph’sk-mer length. For each tool we tested differentk-mer sizes for Velvet (43, 47, 49, 51, 53, 55, 57, 63 and 67) and chose the one that yielded the greatest NG50. We set thek-mer sizes of the error correctors to match those selected in the alignment experiment of Table 3. As before, we used only the reads (and partial reads) that remained after trimming and dis-carding for Quake and BLESS. For each assembly, we then evaluated the assembly’s quality using Quast, which was
Table 4De novoassembly statistics for theEscherichia colidataset
N50 NG50 Edits/100 kbp Misassemblies Coverage (%)
Original 94,879 94,879 3.41 0 97.496
Quake 89,470 88,209 11.62 4 97.515
SOAPec 98,111 94,879 3.49 1 97.473
Musket 86,421 86,421 6.45 0 97.53
BLESS 85,486 85,486 3.58 1 97.302
[image:9.595.57.543.633.734.2]Table 5 Alignment statistics for the GAGE chromosome 14 dataset
Read level Base level
k Mapped reads Increase (%) Matches/aligned base (%) Increase (%)
Original – 35,993,147 – 98.507 –
Quake 19 32,547,091 −9.57 99.845 1.36
SOAPec 19 36,116,405 0.34 98.768 0.26
Musket 19 36,316,699 0.90 99.109 0.61
BLESS 27 36,301,816 0.86 99.411 0.92
Lighter 19 36,320,688 0.91 99.235 0.74
configured to discard contigs shorter than 100 bp before calculating statistics. Results are shown in Table 4.
N50 is the length such that the total length of the contigs no shorter than the N50 cover at least half the assem-bled genome. NG50 is similar, but with the requirement that contigs cover half the reference genome rather than half the assembled genome. Edits per 100 kbp is the num-ber of mismatches or indels per 100 kbp when aligning the contigs to the reference genome. A misassembly is an instance where two adjacent stretches of bases in the assembly align either to two very distant or to two highly overlapping stretches of the reference genome. The Quast study defines these metrics in more detail [28].
Assemblies produced from reads corrected with the four programs are very similar according to these mea-sures, with Quake and Lighter yielding the longest contigs and the greatest genome coverage. Surprisingly, the post-correction assemblies have more differences at nucleotide level compared to the pre-correction assemblies, perhaps due to spurious corrections.
GAGE human chromosome 14
We also evaluated Lighter’s effect on alignment and assembly using a dataset from the GAGE project [30]. The dataset consists of real 101 × 101 bp paired-end reads covering human chromosome 14 to 35×average coverage (approximately 36.5 million reads). For each error correc-tor, we tested different k-mer sizes (19, 23, 27 and 31) and chose the size that yielded the greatest total number of matching aligned nucleotides. For the assembly exper-iment, we set the k-mer size for each error corrector to
match that selected in the alignment experiment. Also for each assembly experiment, we tested differentk-mer sizes for Velvet (47, 53, 57, 63 and 67) and chose the one that yielded the greatest NG50.
The effect of error correction on Bowtie 2 alignment statistics are shown in Table 5. We used Bowtie 2 with default parameters to align the reads to an index of the human chromosome 14 sequence of the hg19 build of the human genome. As before, Lighter yields the greatest improvement in fraction of reads aligned, whereas Quake and BLESS yield the greatest improvement in fraction of aligned bases that match the reference, with Lighter very close behind.
We repeated this experiment using BWA-MEM as the aligner instead of Bowtie 2 (Additional file 1: Table S6) and found that the tools performed similarly.
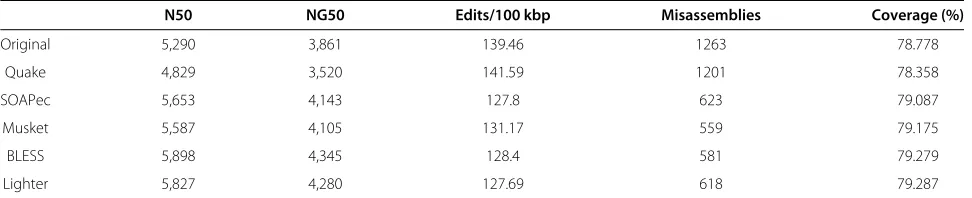
We also tested the effect of error correction onde novo
assembly of this dataset using Velvet for assembly and Quast to evaluate the quality of the assembly. For each tool we tested different k-mer sizes (19, 23, 27 and 31) and chose the one that yielded the greatest NG50. Results are shown in Table 6. Overall, Lighter’s accuracy on real data is comparable to other error correction tools, with Lighter and BLESS achieving the greatest N50, NG50 and coverage.
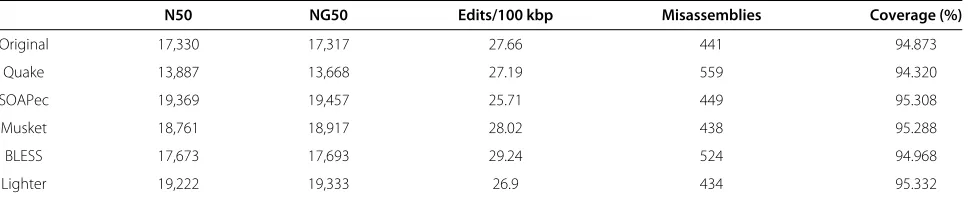
Caenorhabditis elegans
Using the same procedure as in the previous section, we measured the effect of error correction on another large real dataset using the reads from accession [NCBI-SRA SRR065390]. Results are shown in Tables 7 and 8. This
Table 6De novoassembly statistics for the GAGE chromosome 14 dataset
N50 NG50 Edits/100 kbp Misassemblies Coverage (%)
Original 5,290 3,861 139.46 1263 78.778
Quake 4,829 3,520 141.59 1201 78.358
SOAPec 5,653 4,143 127.8 623 79.087
Musket 5,587 4,105 131.17 559 79.175
BLESS 5,898 4,345 128.4 581 79.279
[image:10.595.56.542.634.733.2]Table 7 Alignment statistics for theCaenorhabditis elegansdataset
Read level Base level
k Mapped reads Increase (%) Matches/aligned base (%) Increase (%)
Original – 63,017,855 – 99.048 –
Quake 19 60,469,150 −4.04 99.834 0.79
SOAPec 19 63,032,768 0.02 99.185 0.14
Musket 23 63,060,601 0.07 99.420 0.38
BLESS 31 64,150,807 1.80 99.744 0.70
Lighter 23 63,081,655 0.10 99.469 0.43
run contains real 100× 100 bp paired-end reads cover-ing the C. elegans genome (WBcel235) to 66× average coverage (approximately 67.6 million reads).k-mer sizes for the error correctors and for Velvet were selected in the same way as for the chromosome 14 experiment. The alignment comparison shows BLESS achieving the great-est increase in fraction of reads aligned, and BLESS and Quake achieving the greatest fraction of aligned bases that match the reference, probably due to their trimming pol-icy. Lighter does the best of the non-trimming tools in the alignment comparison. In the assembly comparison, Lighter and SOAPec achieve the greatest N50, NG50 and coverage.
Speed, space usage and scalability
We compared Lighter’s peak memory usage, disk usage and running time with those of Quake, Musket and BLESS. These experiments were run on a computer run-ning Red Hat Linux 4.1.2-52 with 48 2.1-GHz AMD Opteron processors and 512 GB memory. The input datasets are the same simulatedE. colidatasets with 1% error rate discussed previously, plus the GAGE human chromosome 14 dataset andC. elegansdataset.
The space usage is shown in Table 9. BLESS and Lighter achieve constant memory footprint across sequencing depths. While Musket uses less memory than Quake, it uses more than either BLESS or Lighter. BLESS achieves constant memory footprint across sequencing depths, but consumes more disk space for datasets with deeper sequencing. Note that BLESS can be configured to trade off between peak memory footprint and the number of
temporary files it creates. Lighter’s algorithm uses no disk space. Lighter’s only sizable data structures are the two Bloom filters, which reside in memory.
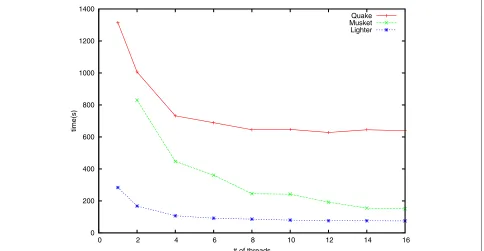
To assess scalability, we also compared running times for Quake, Musket and Lighter using different numbers of threads. For these experiments we used the simulatedE. colidataset with 70×coverage and 1% error. Results are shown in Figure 6. Note that Musket requires at least two threads due to its master–slave design. BLESS can only be run with one thread and its running time is 1,812 s, which is slower than Quake.
Discussion
At Lighter’s core is a method for obtaining a set of correct
k-mers from a large collection of sequencing reads. Unlike previous methods, Lighter does this without countingk -mers. By setting its parameters appropriately, its memory usage and accuracy can be held almost constant with respect to depth of sequencing. It is also quite fast and memory-efficient, and requires no temporary disk space.
Though we demonstrate Lighter in the context of sequencing error correction, Lighter’s counting-free approach could be applied in other situations where a collection of solid k-mers is desired. For example, one tool for scaling metagenome sequence assembly uses a Bloom filter populated with solidk-mers as a memory-efficient, probabilistic representation of a De Bruijn graph [19]. Other tools use counting Bloom filters [31,32] or the related CountMin sketch [33] to represent De Bruijn graphs for compression [20] or digital normalization and related tasks [34]. We expect ideas from Lighter could
Table 8De novoassembly statistics for theCaenorhabditis elegansdataset
N50 NG50 Edits/100 kbp Misassemblies Coverage (%)
Original 17,330 17,317 27.66 441 94.873
Quake 13,887 13,668 27.19 559 94.320
SOAPec 19,369 19,457 25.71 449 95.308
Musket 18,761 18,917 28.02 438 95.288
BLESS 17,673 17,693 29.24 524 94.968
[image:11.595.58.542.634.733.2]Table 9 Memory usage (peak resident memory) and disk usage of error correction tools
35× 70× 140× chr14 Caenorhabditis elegans
Mem Disk Mem Disk Mem Disk Mem Disk Mem Disk
Quake 2.8 GB 3.3 GB 7.1 GB 6.0 GB 14 GB 12 GB 48 GB 57 GB 86 GB 99 GB
Musket 119 MB 0 165 MB 0 225 MB 0 1.4 GB 0 2.5 GB 0
BLESS 11 MB 918 MB 11 MB 1.8 GB 13 MB 3.5 GB 138 MB 15 GB 175 MB 36 GB
Lighter 35 MB 0 35 MB 0 35 MB 0 514 MB 0 514 MB 0
chr14, chromosome 14; mem, memory.
be useful in reducing the memory footprint of these and other tools.
An important question is how Lighter’s performance can be improved for datasets where coverage is signifi-cantly non-uniform, and where solid k-mers can there-fore have widely varying abundance. In practice, datasets have non-uniform coverage because of ploidy, repeats and sequencing bias. Also, assays such as exome and RNA sequencing intentionally sample non-uniformly from the genome. Even in standard whole-genome DNA sequenc-ing of a diploid individual,k-mers overlapping heterozy-gous variants will be about half as abundant as k-mers overlapping only homozygous variants. Lighter’s ability to classify the heterozygousk-mers deteriorates as a result, as shown in the section Effect of ploidy on Bloom filter B above. Hammer [10] relaxes the uniformity-of-coverage assumption and favors corrections that increase the mul-tiplicity of ak-mer, without using a threshold to separate solid from non-solidk-mers. A question for future work is whether something similar can be accomplished in
Lighter’s non-counting regime, or whether some count-ing (e.g. with a countcount-ing Bloom filter [31,32] or CountMin sketch [33]) is necessary.
A related issue is systematically biased sequencing errors, i.e. errors that correlate with the sequence con-text. One study demonstrates this bias in data from the Illumina GA II sequencer [35]. This bias boosts the mul-tiplicity of some incorrect k-mers, causing problems for error correction tools. For Lighter, increased multiplic-ity of incorrect k-mers causes them to appear more often (and spuriously) in Bloom filters A and/or B, ulti-mately decreasing accuracy. It has also been shown that these errors tend to have low base quality and tend to occur only on one strand or the other [35]. Lighter’s policy of using a fifth-percentile threshold to classify low-quality positions as untrusted will help in some cases. However, because Lighter canonicalizes k-mers (as do many other error correctors), it loses information about whether an error tends to occur on one strand or the other.
0 200 400 600 800 1000 1200 1400
0 2 4 6 8 10 12 14 16
time(s)
# of threads
Quake Musket Lighter
[image:12.595.57.541.459.710.2]Lighter has three parameters the user must specify: the
k-mer length k, the genome length Gand the subsam-pling fractionα. While the performance of Lighter is not overly sensitive to these parameters (see Figures 3 and 5), it is not desirable to leave these settings to the user. In the future, we plan to extend Lighter to estimateG, along with appropriate values forkandα, from the input reads. This could be accomplished with methods proposed in the KmerGenie [36] and KmerStream [22] studies.
Lighter is free open-source software released under the GNU GPL license, and has been compiled and tested on Linux, Mac OS X and Windows computers. The software and its source are available from [16].
Additional file
Additional file 1: Supplementary material for ‘Lighter: fast and memory-efficient error correction without counting’.
Abbreviations
bp: base pair; FN: false negative; FP: false positive; kbp: kilobase pair; SNP: single nucleotide polymorphism; TP: true positive.
Competing interests
The authors declare that they have no competing interests.
Authors’ contributions
LS and BL designed and analyzed the method. LS implemented the software. LS, LF and BL evaluated the software and wrote the manuscript. All authors read and approved the final manuscript.
Acknowledgements
The authors thank Jeff Leek for helpful discussions. National Science Foundation grant ABI-1159078 was awarded to LF. National Science Foundation grant IIS-1349906 and Sloan Research Fellowship were awarded to BL.
Received: 27 May 2014 Accepted: 29 September 2014
References
1. Glenn TC:Field guide to next-generation DNA sequencers.Mol Ecol Resour2011,11:759–769.
2. Hayden EC:Is the $1,000 genome for real?Nature News2014. [http://www.nature.com/news/is-the-1-000-genome-for-real-1.14530] 3. Pevzner PA, Tang H, Waterman MS:An Eulerian path approach to DNA
fragment assembly.Proc Nat Acad Sci2001,98:9748–9753. 4. Chaisson M, Pevzner P, Tang H:Fragment assembly with short reads.
Bioinformatics2004,20:2067–2074.
5. Schröder J, Schröder H, Puglisi SJ, Sinha R, Schmidt B:SHREC: a short-read error correction method.Bioinformatics2009, 25:2157–2163.
6. Ilie L, Fazayeli F, Ilie S:HiTEC: accurate error correction in
high-throughput sequencing data.Bioinformatics2011,27:295–302. 7. Salmela L, Schröder J:Correcting errors in short reads by multiple
alignments.Bioinformatics2011,27:1455–1461.
8. Kao W-C, Chan AH, Song YS:ECHO: a reference-free short-read error correction algorithm.Genome Res2011,21:1181–1192.
9. Yang X, Dorman KS, Aluru S:Reptile: representative tiling for short read error correction.Bioinformatics2010,26:2526–2533. 10. Medvedev P, Scott E, Kakaradov B, Pevzner P:Error correction of
high-throughput sequencing datasets with non-uniform coverage.
Bioinformatics2011,27:137–141.
11. Kelley DR, Schatz MC, Salzberg SL:Quake: quality-aware detection and correction of sequencing errors.Genome Biol2010,11:116.
12. Marçais G, Kingsford C:A fast, lock-free approach for efficient parallel counting of occurrences ofk-mers.Bioinformatics2011,27:764–770. 13. Shi H, Schmidt B, Liu W, Müller-Wittig W:A parallel algorithm for error
correction in high-throughput short-read data on CUDA-enabled graphics hardware.J Comput Biol2010,17:603–615.
14. Liu Y, Schröder J, Schmidt B:Musket: a multistagek-mer spectrum-based error corrector for Illumina sequence data.
Bioinformatics2013,29:308–315.
15. Heo Y, Wu X-L, Chen D, Ma J, Hwu W-M:Bless: Bloom-filter-based error correction solution for high-throughput sequencing reads.
Bioinformatics2014,30:1354–1362.
16. Lighter software.[https://github.com/mourisl/Lighter/] 17. Bloom BH:Space/time trade-offs in hash coding with allowable
errors.Commun ACM1970,13:422–426.
18. Tarkoma S, Rothenberg CE, Lagerspetz E:Theory and practice of Bloom filters for distributed systems.Commun Surv Tutor IEEE2012, 14:131–155.
19. Pell J, Hintze A, Canino-Koning R, Howe A, Tiedje JM, Brown CT:Scaling metagenome sequence assembly with probabilistic De Bruijn graphs.Proc Nat Acad Sci2012,109:13272–13277.
20. Jones DC, Ruzzo WL, Peng X, Katze MG:Compression of
next-generation sequencing reads aided by highly efficientde novo, assembly.Nucleic Acids Res2012,40:171.
21. Melsted P, Pritchard JK:Efficient counting ofk-mers in DNA sequences using a Bloom filter.BMC Bioinformatics2011,12:333.
22. Melsted P, Halldórsson BV:KmerStream: streaming algorithms for
k-mer abundance estimation.bioRxiv; 2014.
23. Luo R, Liu B, Xie Y, Li Z, Huang W, Yuan J, He G, Chen Y, Pan Q, Liu Y, Tang J, Wu G, Zhang H, Shi Y, Liu Y, Yu C, Wang B, Lu Y, Han C, Cheung DW, Yiu S-M, Peng S, Xiaoqian Z, Liu G, Liao X, Li Y, Yang H, Wang J, Lam T-W, Wang J:Soapdenovo2: an empirically improved memory-efficient short-readde novoassembler.Gigascience2012,1:18.
24. Holtgrewe M:Mason–a read simulator for second generation sequencing data.TR-B-10-06, Institut für Mathematik und Informatik, Freie Universität Berlin; 2010.
25. Huang W, Li L, Myers JR, Marth GT:Art: a next-generation sequencing read simulator.Bioinformatics2012,28:593–594.
26. Langmead B, Salzberg SL:Fast gapped-read alignment with Bowtie 2.
Nat Methods2012,9:357–359.
27. Li H:Aligning sequence reads, clone sequences and assembly contigs with BWA-MEM.arXiv preprint arXiv:1303.3997; 2013. 28. Gurevich A, Saveliev V, Vyahhi N, Tesler G:Quast: quality assessment
tool for genome assemblies.Bioinformatics2013,29:1072–1075. 29. Zerbino DR, Birney E:Velvet: algorithms forde novoshort read
assembly using De Bruijn graphs.Genome Res2008,18:821–829. 30. Salzberg SL, Phillippy AM, Zimin A, Puiu D, Magoc T, Koren S, Treangen TJ,
Schatz MC, Delcher AL, Roberts M, Marcais G, Pop M, Yorke JA:Gage: A critical evaluation of genome assemblies and assembly algorithms.
Genome Res2012,22:557–567.
31. Fan L, Cao P, Almeida J, Broder AZ:Summary cache: a scalable wide-area web cache sharing protocol.IEEE/ACM Trans Netw (TON)
2000,8:281–293.
32. Bonomi F, Mitzenmacher M, Panigrahy R, Singh S, Varghese G:An improved construction for counting Bloom filters, Berlin: Springer; 2006. 33. Cormode G, Muthukrishnan S:An improved data stream summary: the
count-min sketch and its applications.J Algorithms2005,55:58–75. 34. Zhang Q, Pell J, Canino-Koning R, Howe AC, Brown CT:These are not the
k-mers you are looking for: efficient onlinek-mer counting using a probabilistic data structure.arXiv preprint arXiv:1309.2975; 2013. 35. Nakamura K, Oshima T, Morimoto T, Ikeda S, Yoshikawa H, Shiwa Y,
Ishikawa S, Linak MC, Hirai A, Takahashi H, Altaf-Ul-Amin Md, Ogasawara N, Kanaya S:Sequence-specific error profile of Illumina sequencers.
Nucleic Acids Res2011,39:e90.
36. Chikhi R, Medvedev P:Informed and automatedk-mer size selection for genome assembly.Bioinformatics2014,30:31–37.
doi:10.1186/s13059-014-0509-9