Long Term Evolution and Optimization based Downlink
Scheduling
Ibrahim Khider
Sudan University of Science and Technology
Bashir Badreldin Elsheikh
Sudan University of Science and Technology
ABSTRACT
The necessity for high data rate mobiles is fast growing. New data steam applications, online gaming and high speed applications are very quickly evolved. The Third Generation Partnership Project (3GPP) offered a full network solution to increase the data rate. This network solution called Long Term Evolution (LTE). LTE can support high data rates up to 100 Mbps for downlink and 50 Mbps for uplink.To reach this high data rate, time and frequency shared resources must be appointed to user equipments (UEs) in right way. LTE has several downlink scheduling algorithms for assigning the resources. In this paper the analysis of „Round Robin‟ and Best Channel Quality Indicator (CQI) are carried .and the comparisons are applied through a MATLAB based simulator.
Keywords
LTE network ,Round Robin ,CQI,simulation.
1.
INTRODUCTION
The first generation of mobile phones was analog system with voice call and no data services. In the second generation, data communication was introduced through General Radio Packet Service GPRS with low data rates. Later, more data rates were provided by High Speed Packet Data Access HSPDA. The latest technology is Long Term Evolution LTE. LTE can provide up to 100 Mbps for downlink channel. Figure.1 shows the development of Mobile communication .
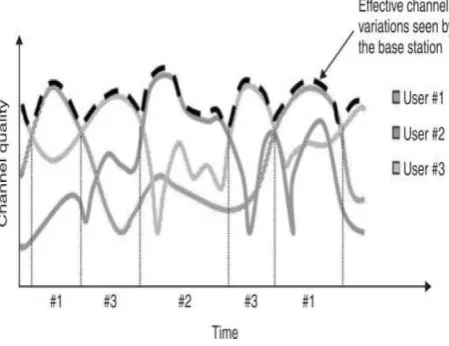
LTE provide high data rate. The key element for this is the scheduling algorithm. Round Robin provides a fair distribution of resources. All user equipments UEs will have the same number of resource blocks RBs regardless of their channel quality. UEs far from the eNodeB will waste portion of their RBs due to bad channel quality. This will reduce the overall system throughput. Through can be enhanced using alternative
scheduling algorithm based on channel quality. Only UEs with best channel quality indicator CQI will be assigned a RB.in this paper we will study and analyze the scheduling algorithm(Round Robin‟ and „Best CQI‟ algorithm) [1][2]
Figure1: Mobile co mmunication develop ment
2.
BACKGROUND
LTE resource block RB is the smallest resource element assigned by the scheduler. RB consists of 72 or 84 resource elements REs. Each resource element is of 1 time slot (0.5 ms) and bandwidth of 180 kHz (12 OFDM subcarriers).[2][3]
Figure 3: LTE do wnlin k r esource block Scheduler function is to distribute resources (time and frequency) among users for each Transmission Time Interval (TTI) of 1 ms. Two scheduling algorithms are discussed in this paper.
2.1.1 Round Robin Scheduling
In this algorithm UEs are assigned RBs on after another. This is a fair algorithm and easy to implement. Since it does not take channel quality into account, it will result to low cell throughput.[4]
Start
Schedule first user
Highest CQI?
Yes
[image:2.595.55.297.98.307.2]No
Schedule next user
Figure 4: Round Robin scheduling flo w ch art 2.1.2 Best CQI Scheduling
In this algorithm, RBs are allocated base on radio link condition. The eNodeB broadcasts reference signal (downlink
[image:2.595.319.544.117.290.2]pilot) to all UEs. UEs respond to this signal by transmitting CQI to the base station. Since channel quality decreases as the distance form base station increases, UEs at cell edge will have CQI less than those close to base station[5].
Figure 5: B es t CQI sch eduling
If a RB is assigned to a UE with bad radio channel, this resource can be wasted due to signal degradation and high bit error. So, only UEs with high CQI are assigned resource blocks. This will improve cell throughput. On the other hand, UEs at cell edge will suffer low throughput due to minimum RB assignment. Thus, this algorithm increases cell capacity at the expense of fairness[1][5].
Start Measure CQIs Highest CQI? Schedule user Yes No
Figure 6: B es t CQI sch eduling flo w chart
3.
SIMULATION ENVIRONMENT AND
DESCRIPTION
[image:2.595.356.496.396.652.2] [image:2.595.83.248.435.687.2]non-commercial, MATLAB based simulator. It was developed by Vienna University of Technology, Austria.
We applied this software in LTE network to provide a flexible design and tune LTE physical radio links. Secondly we set various network parameters including: operating frequency, bandwidth, number of transmitters and receivers, antenna gain, height, number of nodes, UEs per node and scheduler parameters.
Then we generating the network, creating UEs, initializing the scheduler and initializing traces. And then we define Transmission Time Interval TTI which is equivalent to 1 sub-frame.
The simulation provides standard Graphical User Interface GUI figures for various system parameters.
4.
Results and Discussion
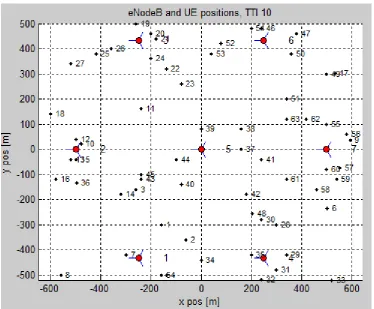
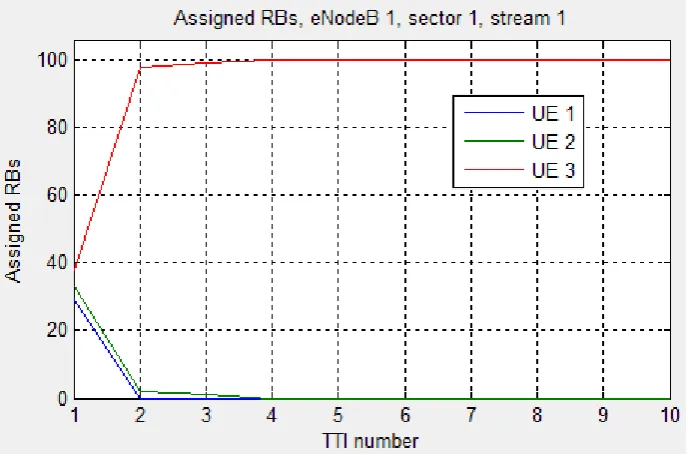
A network of 7 eNodeBs was generated of 3 UEs per sector. A frequency band of 20 MHz was used. This will provide 100 RBs. The simulation time is 10 ms (10 TTI). The performance of Round Robin RR and Best CQI scheduling algorithm was analyzed. First round robin scheduler was simulated, the
resource blocks RBs are assigned it is clear that RBs are assigned in turn (one after another) among the 3 UEs. Now we take a look at the throughput of UE 1, UE 2 and eNodeB 1.Figures 7, 8, 9 and 10 show that UE with higher CQI, will have higher throughput. Figure 11 shows that UE 1 is more close to eNodeB 1 than UE 2. Thus, UE 1 will have better CQI. This higher CQI will result in better user throughput.
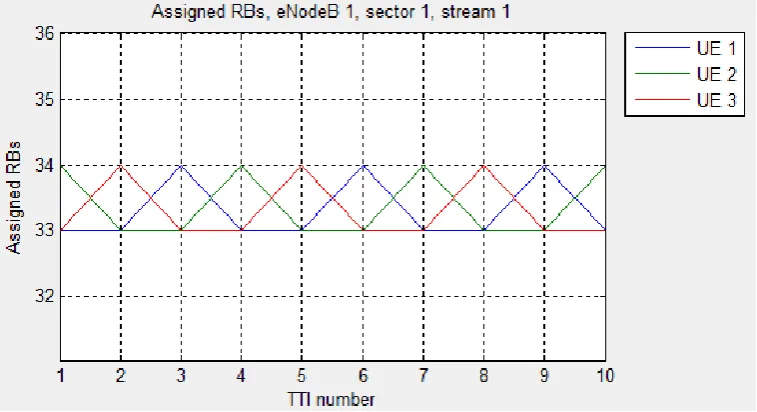
Figure 12 sho ws th at RB s ar e as sign ed equall y bet ween UE s. Each UE wi l l have one third o f the total 100 RBs. The o ver all eNodeB throu ghput is shown in fi gur e 13.
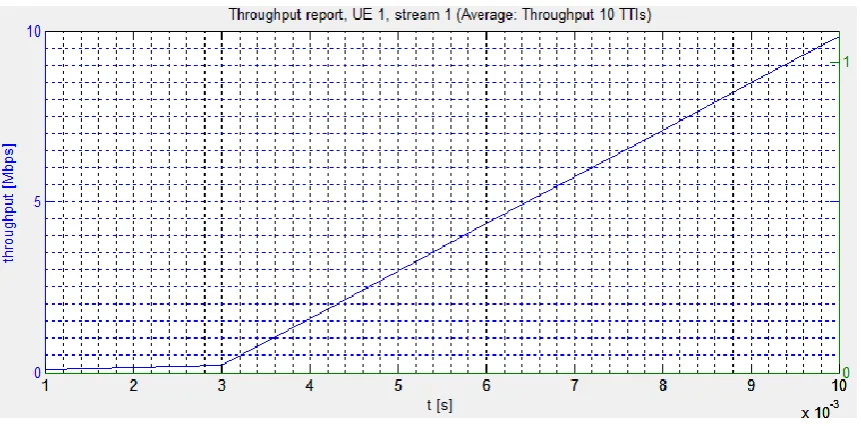
Figure 7: Throughput r eport, UE 1 (Round Robin)
[image:4.595.85.515.306.519.2]Figure 9: Throughput r eport, UE 2, Round Robin
Figure 10 : C QI r eport, UE 2 , Round Robin
[image:5.595.83.520.90.300.2] [image:5.595.111.486.327.636.2]Figure 12: Assi gned R Bs, R ound Robin
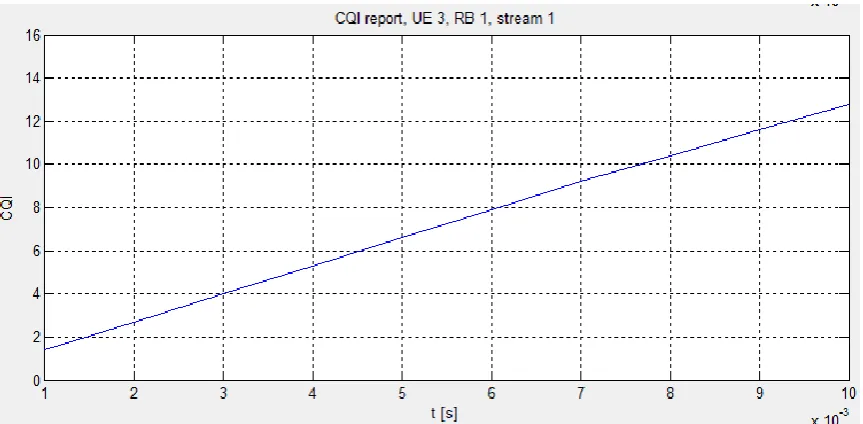
Figure 14: C QI r eport, UE 1 , Best CQI
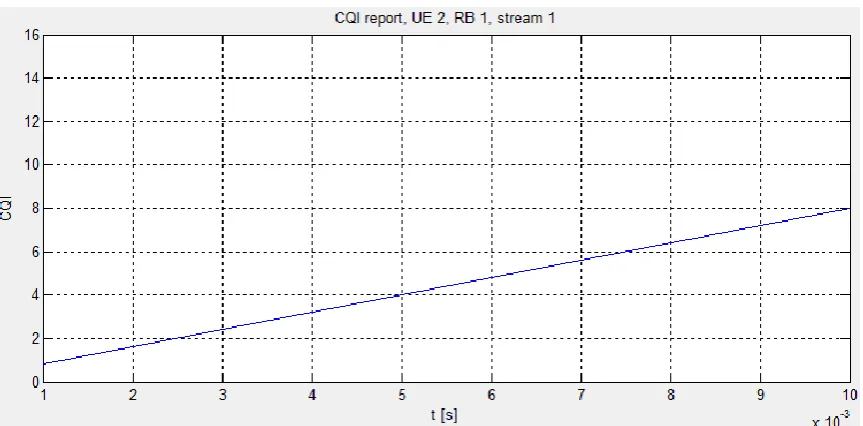
Figure 16: C QI R eport, UE 2, Best C QI
Figure 17: Throughput repo rt, UE 2, Best C QI
Figure 19: Throughput repo rt, UE 3, Best C QI
[image:9.595.126.471.374.601.2]Figures 14 – 19 shows that only UE with highest CQI will have the highest throughput.
Figure 21: Throughput, eNodeB, Best C QI
[image:10.595.93.503.371.705.2]5.
CONCLUSION
The world need of high data rate mobile communication is increasing tremendously. LTE is the latest technology in mobile communication capable of providing up to 100 Mbps downlink data rate. In this paper two scheduling algorithms were investigated. These algorithms are Round Robin and Best CQI. Round Robin assigns RBs to UEs in turn, while Best CQI assigns RBs based on highest channel quality. These algorithms were simulated on MATLAB-based Link Level Simulator of the Vienna University. Results show that Best CQI provides better cell throughput. However, this advantage is at the expense of fairness. A third algorithm is proposed for future work that combines channel quality and fairness. This can be achieved by assigning the first slot period of each sub-frame based on Best CQI, while assigning the second slot period to users in turn (Round Robin).
6.
REFERENCES
[1] Tshiteya Dikamba,2011, “Downlink Scheduling in 3GPP Long Term Evolution (LTE)”, Master thesis, Faculty of Electrical Engineering, Mathematics and Computer Science Delft University of Technology.
[2] Available: http://www.nt.tuwien.ac.at/ltesimulator/ [3] http://en.wikipedia.org/wiki/3GPP_Long_Term_Evolutin [4] Liang Zhang,2010,“Network Capacity, Coverage Estimation and Frequency Planning of 3GPP Long Term Evolution”, Master thesis, Department of Electrical Engineering, Institutionen för systemteknik, Linköping University.
[5] Josep Colom Ikuno, Martin Wrulich & Markus Rupp, 2010,“System level simulation of LTE networks”, IEEE 71st Vehicular Technology Conference.