IJPSR (2019), Volume 10, Issue 3 (Research Article)
Received on 03 July 2018; received in revised form, 05 September 2018; accepted, 15 September 2018; published 01 March 2019
ANALYTICAL METHOD DEVELOPMENT AND VALIDATION FOR SIMULTANEOUS ESTIMATION OF HALOBETASOL PROPIONATE AND MUPIROCIN IN THE RATIO 1:40 BY U.V. SPECTROSCOPY AND RP- HPLC METHOD
Arpit Bana*, Mansi A. Sathe and Sadhana J. Rajput
Quality Assurance Laboratory, Centre of Relevance and Excellence in Novel Drug Delivery Systems, Pharmacy Department, The Maharaja Sayajirao University of Baroda, Fatehgunj, Vadodara - 390002, Gujarat, India.
ABSTRACT: The present work encompasses the development of two classical UV spectroscopy methods and an RP-HPLC method for the concurrent assessment of Halobetasol propionate and Mupirocin inculcating a statistical approach. The UV spectroscopy methods developed herein include absorption ratio method and first derivative spectroscopy method. The wavelength maxima selected for Absorption ratio method were 240 and 220 nm for Halobetasol Propionate and Mupirocin respectively. The zero crossing points selected were 240.626 nm and 220.180 nm for Halobetasol Propionate and Mupirocin respectively for first derivative spectroscopy. The chromatographic separation was achieved by using CHROMBUDGET C18 (250 × 4.6 mm) 5 µm column, mobile phase consisting of Acetonitrile: phosphate buffer (65:35 v/v, pH 3.2), at 1 ml/min flow rate and detection wavelength was 230 nm The retention time of Halobetasol propionate, and Mupirocin was found to be 8.647 ± 0.06 min and 3.357±0.123 min, respectively. Linearity was observed in the concentration range of 5.125 - 5.75 µg/ml for Halobetasol propionate and 5-30 µg/ml for Mupirocin respectively. The analytical method was validated as per ICH, Q2 (R1) guidelines. The developed method was simple, specific and economic, which can be used for simultaneous estimation of Halobetasol propionate and Mupirocin in the gel dosage form.
INTRODUCTION: Halobetasol Propionate: Halobetasol propionate is a topical corticosteroid drug with molecular weight of 484.965g/mol and pKa value of 12.46 chemically it is (6S, 8S, 9R, 10S, 11S, 13S, 14S, 16S, 17R)-17-(2-chloroacetyl)-6,9-difluoro-11,17-dihydroxy-10, 13, 16-trimethyl-6, 7, 8, 11, 12, 14, 15, 16-octahydrocyclopenta[a] phenanthren-3-one Fig. 1.
QUICK RESPONSE CODE
DOI:
10.13040/IJPSR.0975-8232.10(3).1392-01
The article can be accessed online on
www.ijpsr.com
DOI link: http://dx.doi.org/10.13040/IJPSR.0975-8232.10(3).1392-01
FIG. 1: STRUCTURE OF HALOBETASOL PROPIONATE
Halobetasol propionate is a potent corticosteroid that diffuses across cell membranes to interact with cytoplasmic corticosteroid receptors located in both the dermal and intra-dermal cells, thereby Keywords:
Halobetasol propionate, Mupirocin, U.V Spectroscopy, Anderson-Darling normality test,
RP-HPLC Correspondence to Author: Arpit Bana
Research Scholar,
Quality Assurance Laboratory, Centre of Relevance and Excellence in Novel Drug Delivery Systems, Pharmacy Department, Shri G. H. Patel Building, Donor’s Plaza, The Maharaja Sayajirao University of Baroda, Fatehgunj, Vadodara - 390002, Gujarat, India.
activating gene expression of anti-inflammatory proteins mediated via the corticosteroid receptor response element. Halobetasol is mainly used for the treatment of edema, erythema, and pruritus through its cutaneous effect on vascular dilation and permeability 1.
Mupirocin: Mupirocin is a topical antibiotic with a molecular weight of 500.62g/mol and pKa value of 4.83. Chemically it is 9-[(E)-4-[(2S, 3R, 4R, 5S)-3,4-dihydroxy-5-[[(2S, 3S)-3-[(2S, 3S) hydroxyl-butan-2-yl] oxiran-2-yl] methyl] oxan- 2- yl]- 3-methylbut-2-enoyl]oxynonanoic acid Fig. 2. Mupirocin is a natural crotonic acid that is
extracted from a strain of Pseudomonas
fluorescens. Mupirocin inhibits bacterial protein synthesis by specific reversible binding to bacterial isoleucyl tRNA synthase with excellent activity
against gram-positive staphylococci and
streptococci; it is primarily used for the treatment of primary and secondary skin disorders, nasal infections, and wound healing (NCI04) 1.
No analytical methods are reported for this
combination (Halobetasol propionate and
mupirocin) in gel formulation however; analytical methods of single drug as well as with other combination are reported like, a spectrophotometric determination of clobetasol propionate, Halobetasol propionate, quinagolide hydrochloride, through charge transfer complexation 2, simultaneous determination of halobetasol propionate and fusidic acid-related substances by reversed phase high performance liquid chromatographic method 3, Development and validation of RP-HPLC Method for simultaneous estimation Prednicarbate, Mupirocin and Ketoconazole in topical dosage form 4, spectroscopic tools and implementation strategies for the chemical and pharmaceutical industries 5, Formulation and evaluation of novel combined halobetasol propionate and fusidic acid ointment 6, Practical High Performance Liquid
Chromatographic method development 7,
Development and validation of a liquid chromatographic method for in-vitro mupirocin quantification in both skin layers 8.
In this research article we have developed 2 UV methods for this combination A) Q-Absorbance ratio method B) First derivative zero crossing point method and an isocratic RP-HPLC method, we
[image:2.612.331.541.92.230.2]confirm that this UV method and RP-HPLC method are not reported anywhere.
FIG. 2: STRUCTURE OF MUPIROCIN
MATERIALS AND METHODS:
Reagents and Chemicals: West-coast Pharma, Ahmedabad kindly gifted gift samples for Halobetasol propionate (HAL) and Mupirocin (MUP) API. The above-stated combination is an approved fixed-dose combination (FDC) by
CDCSCO. The synthetic mixture of gel
formulation was prepared in the laboratory on a pilot scale containing HAL 0.05% w/w and MUP 2.0% w/w Table 1.
Methanol analytical reagent grade (Fischer Scientific Pvt. Ltd., Mumbai, India) was used as the solvent for the UV spectrophotometric method. For chromatographic analysis, Acetonitrile of HPLC grade was procured from Rankem, India and used for mobile phase preparation. Double distilled water was prepared at the laboratory premises.
TABLE 1: COMPOSITION OF SYNTHETIC MIXTURE
Composition Use Strength in % w/w
Water Excipient 48.55%
Disodium edetate Stabilizer 0.05%
Ascorbic acid Stabilizer 0.05%
Carbopol 934P Thickening
agent
1.0%
Poloxamer 407 Surfactant 0.2%
PEG-400 Co-Solvent 45.0%
Polysorbate 40 Surfactant 0.2%
Propylene glycol Co-solvent 2.0%
BHA Preservative 0.05%
BHT Preservative 0.05%
Triethanolamine Neutralizer 0.8%
Halobetasol Propionate
Drug 0.05%
Mupirocin Drug 2.0%
[image:2.612.315.563.499.671.2]spectrophotometer was also employed for ruggedness study. 1 cm quartz cells were used to measure the absorbance spectra of the reference and test solutions over the range of 200-400 nm. All the samples were weighed on an electronic analytical balance (A × 120, Shimadzu).
Preparation of Standard Stock Solution: Both UV spectrophotometric methods and RP-HPLC 10mg each of HAL and MUP were weighed accurately and transferred into a 10 ml volumetric flask to which methanol (Fischer Scientific Pvt. Ltd., Mumbai, India) was added up to the mark to produce a stock solution containing 1000 μg/ml of HAL and MUP respectively.
Selection of Analytical Wavelength: Solutions of 5 µg/ml of both drugs were prepared from working stock solution and scanned in the range of 200 nm to 400 nm against methanol as blank. The λmax for
Halobetasol propionate (HAL) and Mupirocin (MUP) was found to be 240 nm and 220 nm respectively and isoabsorptive point obtained was 230 nm for both drugs Fig. 3.
Method-A: Q-Absorbance Ratio Method:
Absorbance ratio method uses the ratio of absorbance at two selected wavelengths, one which is an Iso-absorptive point and other being the λmax of one of the two components.
From the overlay spectra of two drugs, it is evident that HAL and MUP show an Iso-absorptive point at 230 nm Fig. 3. The second wavelength used is 220 nm, which is the λmax of MUP.
Six standard working solutions having concentration 5.125, 5.25, 5.375, 5.50, 5.625 and 5.75 μg/mL for HAL and 5, 10, 15, 20, 25, 30 μg/mL for MUP were prepared in methanol and the absorbance at 230 nm (isoabsorptive point) and 220 nm (λmax of MUP) were measured and absorptivity coefficients were calculated.
The absorbance of the sample solution (10 µg/ml of HAL and MUP), i.e. A1 and A2 were
recorded at 230 nm (Iso-absorptive point) and 220 nm (λmax of MUP) respectively, and ratios of absorbance were calculated, i.e., A2/A1
The relative concentration of two drugs in the sample was calculated using the following equations.
Cx = [(Qm-Qy)/ (Qx-Qy)] × A1/aX1
Cy = [(Qm-Qx)/ (Qy-Qx)] × A1/aY1
The Q-values and absorptivity for both drugs were calculated as follows,
Absorbance of Sample solution at 220 nm (A2)
Absorbance of Sample solution at 230 nm (A1)
Absorptivity of MUP at 220 nm (ax2)
Absorptivity of MUP at 230nm (ax1)
Absorptivity of HAL at 220nm (ay2)
Absorptivity of HAL at 230nm (ay1)
Method-B: First Derivative Spectroscopy Method: In this method, zero order spectra were derivatized to first order and then on basis of zero crossing points (ZCP) of the corresponding drugs the wavelength for analysis was chosen. As per the study, HAL was analyzed at 220.18 nm which was ZCP of MUP whereas MUP was analyzed at 240.626 nm which was ZCP of HAL. The parameters delta λ is 5.0, and the scaling factor was set to be 20 Fig. 4.
Preparation of Calibration Curve of Halobetasol Propionate: Concentration range for both drugs was decided according to the ratio (1:40) in which the combination of both drugs is available. For both UV spectrophotometric and RP-HPLC method, 0.25 ml (1000 μg/ml) of HAL standard was transferred into 25 ml volumetric flask to prepare 10μg/ml working standard of HAL from which aliquots of 0.125, 0.25, 0.375, 0.5, 0.625 and 0.75 ml were transferred into 10 ml volumetric flasks. A uniform spiking was carried out for all above samples in which 1.0 ml (50 μg/ml) of HAL standard was added to above volumetric flasks to obtain the final concentration range of 5.125-5.75 μg/ml.
Preparation of Calibration Curve of Mupirocin: For MUP 2.5 ml (1000 μg/ml) of MUP was transferred into 25 ml volumetric flasks to prepare 100 μg/ml working standard from which aliquots of 0.5, 1.0, 1.5, 2.0, 2.5 and 3.0 ml were transferred into 10 ml volumetric flasks to obtain the final concentration range of 5-30 μg/ml of MUP.
Qm =
Qx =
Sample Preparation: Accurately-weighed gel equivalent to 50 mg of HAL and 2000 mg of MUP in 50 ml transferred to a volumetric flask, methanol was added and sonicated for 15 min to extract all the drugs from the gel formulation. The solution was cooled and then filtered by using 0.45 μ nylon filters. The filtrate was then evaporated and reconstituted with methanol and then transferred to 25 ml volumetric flask and diluted to the mark with methanol. The final concentration was achieved 5.5μg/ml for HAL and 20 μg/ml for MUP. The mean values of peak areas of 5 such determinations were calculated, and the drug content in the gel was quantified using the calibration curve.
RP-HPLC Method Development:
Chromatographic Condition: Chromatographic separation was achieved by using Shimadzu LC-20AT high-performance liquid chromatography equipped with SPD-20A UV detector and CHROMBUDGET C18, (250 × 4.6 mm ID, 5 µm
column) using Acetonitrile: Phosphate buffer (pH 3.2) (65:35 v/v) as mobile phase with flow rate 1.0 ml/min Table 2.
Preparation of Mobile Phase: Phosphate buffer, pH 3.2 was prepared by taking 0.2721 g of 20 mM potassium dihydrogen phosphate in a 100.0 ml volumetric flask, to which diluted orthophosphoric acid is added to bring the pH to acidic condition (pH 3.2). 35.0 ml of phosphate buffer (pH 3.2) and 65.0 ml of Acetonitrile were mixed and, sonicated for 15 min and filtered through 0.45 µm membrane filters and used as mobile phase.
Selection of Detection Wavelength: Standard solutions of HAL and MUP were scanned between 200-400 nm in UV-visible spectrophotometer and showed good sensitivity at 230 nm as shown in Fig. 5 which was selected as the detection wavelength. Method Validation:
1. System Suitability Studies: System-suitability tests are an integral part of method development and are used to ensure adequate performance of the chromatographic system. Retention time (Rt), a number of theoretical plates (N) and tailing factor (T) were evaluated for six replicate injections of the drug at a concentration of 5 μg/ml. The results which are given in Table 3 were within acceptable limits. System suitability test is a pharmacopeia requirement.
2. Linearity: To evaluate the linearity, serial dilution of analyte were prepared from the stock solution was diluted with mobile phase to get a series of concentration ranging from 5-30 μg/ml for MUP and 5.125-5.75 μg/ml for HAL. From these solutions, 20 μl injections of each concentration were injected into the HPLC system and chromatographed under the optimized conditions. A calibration curve was constructed by plotting the mean peak area (Y-axis) against the concentration (X-axis) and for UV methods A and B Fig. 7-14 above concentration range of HAL and MUP were subjected to UV-Vis Spectrophotometer, and the calibration curve was plotted between Absorbance (Y-axis) and Concentration (X-axis) 9 thus by this procedure regression and optical characteristics of UV and RP-HPLC method were obtained Table 4 and 5.
3. Limit of Detection (LOD): The detection limit of an individual analytical procedure is the lowest amount of analyte in a sample which can be detected but not necessarily quantified as an exact value. LOD was calculated using the following formula:
LOD = 3.3* σ/ S
Where σ is the standard deviation of the response and S is the slope of the calibration curve. The Limit of detection (LOD) for Halobetasol and Mupirocin is determined.
4. Limit of Quantification (LOQ): The quantification limit of an individual analytical procedure is the lowest amount of analyte in a sample which can be quantitatively determined with suitable precision and accuracy. LOQ was calculated using the following formula;
LOQ = 10 * σ/ S
Where σ is the standard deviation of the response and S is the slope of the calibration curve. The limit of quantification for Halobetasol propionate and Mupirocin are determined 9.
To demonstrate agreement among results, a series of measurements were done with HAL and MUP. For RP-HPLC three replicate injections of the specific standard at various time intervals on the same day were injected into the system for intraday precision Table 7 and were repeated on three different days for inter-day precision Table 8. The % RSD (Relative Standard Deviation) of the results was calculated.
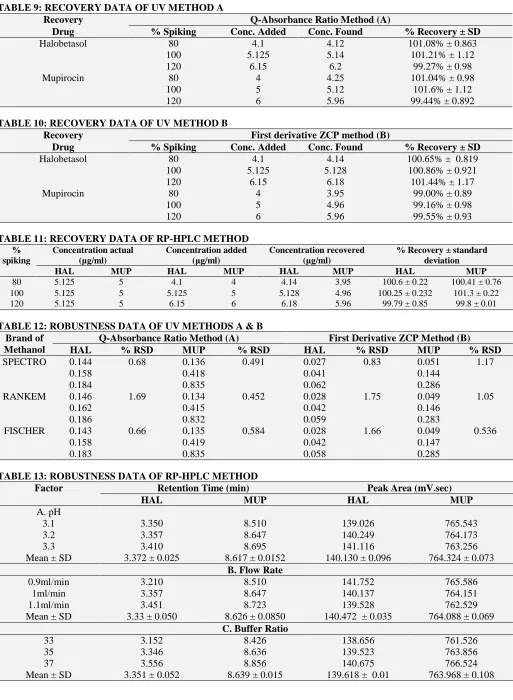
6. Accuracy: To check the Accuracy of different methods, Recovery studies were carried out from the pre-analyzed sample at three deferent levels of standard addition 80%, 100%, and 120%. Results of Recovery studies are shown in Table 9 and 10 for both UV methods and Table 11 for RP-HPLC method.
For each of the method explained above, % Recovery was the average of three determinations at each standard addition level. % Recovery for different methods was found to be between 98% - 102% which prove that all the methods were accurate.
7. Robustness: It should show the reliability of analysis concerning deliberate variations in method parameters. If measurements are susceptible to variation in analytical conditions, the analytical condition should be suitably controlled, or a precautionary statement should be included in the procedure. The evaluation of robustness should be considered during the development phase and depends on the type of procedure under study Table 12. It should show the reliability of an analysis concerning deliberate variations in method parameters. Robustness of the method was demonstrated by deliberately changing the chromatographic conditions like pH, mobile phase ratio and flow rate Table 13.
8. Ruggedness: Ruggedness means the ability of an analytical method to remain unaffected by small variations in method parameters and influential environmental factors and characterize its reliability during normal usage Table 14 and 15. RESULT AND DISCUSSION:
Overlain UV Spectra of Halobetasol Propionate and Mupirocin for Q- Absorbance Ratio Method:
FIG. 3: OVERLAIN SPECTRA OF HAL AND MUP
Overlain UV Spectra of Halobetasol Propionate and Mupirocin for First Derivative ZCP Method:
FIG. 4: OVERLAIN SPECTRA OF HAL (BLUE) AND MUP (RED) FOR FIRST DERIVATIVE ZCP METHOD
Selection of Detection Wavelength for RP-HPLC Method:
FIG. 5: OVERLAIN SPECTRA OF HALOBETASOL PROPIONATE AND MUPIROCIN
TABLE 2: OPTIMIZED CHROMATOGRAPHIC
CONDITION
Method Parameter Optimized Value
Column CHROMBUDGET 100-5-C18
column, (Column dimensions: 250 mm × 4.6 mm, 5 μm)
Mobile Phase ACN: Potassium Dihydrogen
Phosphate, pH 3.2 = 65:35
Flow Rate 1.0 ml/min
Retention Time 3.357 min for MUP and 8.647 min
for HAL
Detection Wavelength 230 nm
FIG. 6: 3D OVERLAIN CHROMATOGRAM OF HALOBETASOL PROPIONATE (RT 8.647 ± 0.06 min) AND MUPIROCIN (RT 3.357 ± 3.357 min)
TABLE 3: SST PARAMETERS
Parameter Data Obtained
MUP HAL
Retention time ± SD 3. 357 ± 0.123
8.647 ± 0.06 Theoretical plate ± SD 4895
± 18.98
12,323 ± 14.32 Tailing factor ± SD 0.895
± 0.001
0.632 ± 0.043 Resolution ± SD 4.672
± 0.501
18.181 ± 0.451
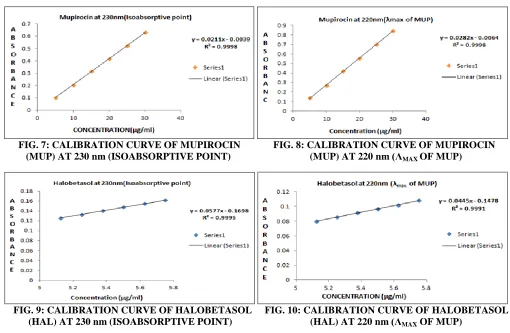
Calibration Curve of Halobetasol Propionate and Mupirocin for Q-Absorbance Ratio Method:
FIG. 7: CALIBRATION CURVE OF MUPIROCIN FIG. 8: CALIBRATION CURVE OF MUPIROCIN (MUP) AT 230 nm (ISOABSORPTIVE POINT) (MUP) AT 220 nm (ΛMAX OF MUP)
FIG. 9: CALIBRATION CURVE OF HALOBETASOL FIG. 10: CALIBRATION CURVE OF HALOBETASOL (HAL) AT 230 nm (ISOABSORPTIVE POINT) (HAL) AT 220 nm (ΛMAX OF MUP)
Calibration Curve of Halobetasol Propionate and Mupirocin for First Derivative ZCP Method:
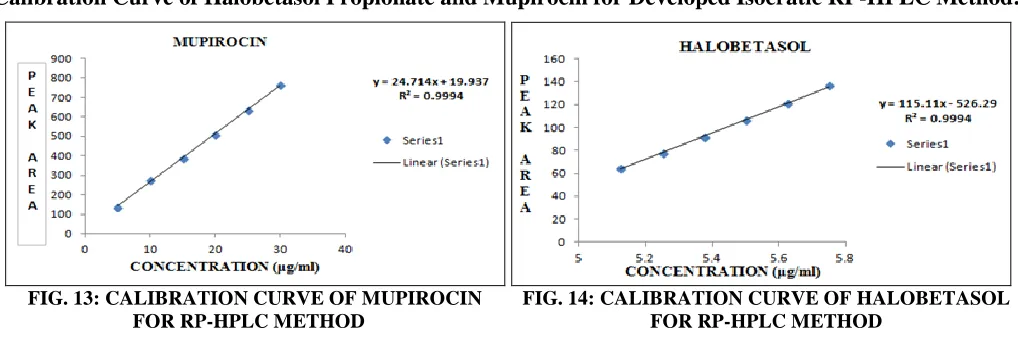
[image:6.612.50.560.238.571.2]Calibration Curve of Halobetasol Propionate and Mupirocin for Developed Isocratic RP-HPLC Method:
[image:7.612.52.561.63.232.2]FIG. 13: CALIBRATION CURVE OF MUPIROCIN FIG. 14: CALIBRATION CURVE OF HALOBETASOL FOR RP-HPLC METHOD FOR RP-HPLC METHOD
TABLE 4: REGRESSION AND OPTICAL CHARACTERISTICS FOR UV METHODS A & B
Parameters Q- Absorbance Ratio-method (A) First Derivative ZCP method (B)
Analytical Wavelength (nm)
HAL MUP HAL MUP
230 nm 220 nm 230 nm 220 nm 220.180 nm 240.626 nm
Beers’s Range (μg/ml) 5.125-5.75 5-30 5.125-5.75 5-30
Slope 0.065 0.0445 0.0211 0.0282 0.0501 0.0096
Intercept 0.2098 0.1478 0.0039 0.0064 0.2297 0.0018
Correlation Coefficient 0.9994 0.9991 0.9998 0.9998 0.9995 0.9996
Standard Deviation of Intercept
0.075 0.0101 0.012093 0.000557 0.012093 0.000557
Limit of Detection (LOD)
(μg/ml) 0.739 0.113 0.826 0.256 0.819 0.192
Limit of Quantification
(LOQ) (μg/ml) 2.24 0.344 2.54 0.772 2.48 0.584
TABLE 5: REGRESSION AND OPTICAL CHARACTERISTICS OBTAINED FOR RP-HPLC METHOD
Parameter Halobetasol Mupirocin
Detection Wavelength (nm) 230 nm
Beer’s range (μg/ml) 5.125-5.75 5-30
Regression equation Y=115.11X-526.29 Y=24.714X+19.93
LOD 0.2364 0.1069
LOQ 0.7095 0.3295
TABLE 6: INTRADAY AND INTERDAY PRECISION OF UV METHODS A & B
Parameter Q-Absorbance Ratio-method (A) First derivative ZCP method (B)
HAL MUP HAL MUP
Intraday Precision (SD) 0.0013 0.0021 0.00044 0.00057
Intraday Precision (% RSD) 0.164 0.450 1.032 0.356
Interday Precision (SD) 0.00063 0.00105 0.00058 0.00103
Interday Precision (% RSD) 0.387 0.226 1.355 0.6494
TABLE 7: INTRADAY PRECISION OF RP-HPLC METHOD
Drug Conc. (μg/ml) Mean Area Std. Dev % RSD
Mupirocin 5 138.250 0.627 0.453
15 390.900 3.893 0.995
30 764.173 7.005 0.916
Halobetasol 5.125 66.527 0.530 0.796
5.375 89.782 1.500 1.670
5.75 140.249 1.792 1.277
TABLE 8: INTERDAY PRECISION OF RP-HPLC METHOD
Drug Conc. (μg/ml) Mean Area Std. Dev % RSD
Mupirocin 5 138.789 0.7514 0.541
15 389.945 2.023 0.518
30 765.145 7.058 0.922
Halobetasol 5.125 65.256 0.523 0.801
5.375 90.065 1.022 1.134
TABLE 9: RECOVERY DATA OF UV METHOD A
Recovery Q-Absorbance Ratio Method (A)
Drug % Spiking Conc. Added Conc. Found % Recovery ± SD
Halobetasol 80 4.1 4.12 101.08% ± 0.863
100 5.125 5.14 101.21% ± 1.12
120 6.15 6.2 99.27% ± 0.98
Mupirocin 80 4 4.25 101.04% ± 0.98
100 5 5.12 101.6% ± 1.12
120 6 5.96 99.44% ± 0.892
TABLE 10: RECOVERY DATA OF UV METHOD B
Recovery First derivative ZCP method (B)
Drug % Spiking Conc. Added Conc. Found % Recovery ± SD
Halobetasol 80 4.1 4.14 100.65% ± 0.819
100 5.125 5.128 100.86% ± 0.921
120 6.15 6.18 101.44% ± 1.17
Mupirocin 80 4 3.95 99.00% ± 0.89
100 5 4.96 99.16% ± 0.98
120 6 5.96 99.55% ± 0.93
TABLE 11: RECOVERY DATA OF RP-HPLC METHOD
% spiking
Concentration actual (μg/ml)
Concentration added (μg/ml)
Concentration recovered (μg/ml)
% Recovery ± standard deviation
HAL MUP HAL MUP HAL MUP HAL MUP
80 5.125 5 4.1 4 4.14 3.95 100.6 ± 0.22 100.41 ± 0.76
100 5.125 5 5.125 5 5.128 4.96 100.25 ± 0.232 101.3 ± 0.22
120 5.125 5 6.15 6 6.18 5.96 99.79 ± 0.85 99.8 ± 0.01
TABLE 12: ROBUSTNESS DATA OF UV METHODS A & B Brand of
Methanol
Q-Absorbance Ratio Method (A) First Derivative ZCP Method (B)
HAL % RSD MUP % RSD HAL % RSD MUP % RSD
SPECTRO 0.144 0.68 0.136 0.491 0.027 0.83 0.051 1.17
0.158 0.418 0.041 0.144
0.184 0.835 0.062 0.286
RANKEM 0.146 1.69 0.134 0.452 0.028 1.75 0.049 1.05
0.162 0.415 0.042 0.146
0.186 0.832 0.059 0.283
FISCHER 0.143 0.66 0.135 0.584 0.028 1.66 0.049 0.536
0.158 0.419 0.042 0.147
0.183 0.835 0.058 0.285
TABLE 13: ROBUSTNESS DATA OF RP-HPLC METHOD
Factor Retention Time (min) Peak Area (mV.sec)
HAL MUP HAL MUP
A. pH
3.1 3.350 8.510 139.026 765.543
3.2 3.357 8.647 140.249 764.173
3.3 3.410 8.695 141.116 763.256
Mean ± SD 3.372 ± 0.025 8.617 ± 0.0152 140.130 ± 0.096 764.324 ± 0.073 B. Flow Rate
0.9ml/min 3.210 8.510 141.752 765.586
1ml/min 3.357 8.647 140.137 764.151
1.1ml/min 3.451 8.723 139.528 762.529
Mean ± SD 3.33 ± 0.050 8.626 ± 0.0850 140.472 ± 0.035 764.088 ± 0.069 C. Buffer Ratio
33 3.152 8.426 138.656 761.526
35 3.346 8.636 139.523 763.856
37 3.556 8.856 140.675 766.524
TABLE 14: RUGGEDNESS DATA OF UV METHODS A & B
INSTRUMENT: UV-1800 SHIMADZU UV Spectrophotometer and UV-1700 SHIMADZU UV Spectrophotometer were used
Parameters HAL MUP
Method-A Method-B Method-A Method-B
Mean (UV-1700&1800) 0.1617 0.042 0.4745 0.1598
Standard Deviation 0.00083 0.00049 0.00048 0.00070
%RSD 0.513 1.16 0.101 0.438
TABLE 15: RUGGEDNESS DATA OF RP-HPLC METHOD
ANALYST: Ruggedness of RP-HPLC Method was performed by using two different analyst
Parameters HAL MUP
Analyst-1 Analyst-2 Analyst-1 Analyst-2
Mean (Peak area) 140.130 140.472 763.968 764.324
Standard Deviation 0.096 0.112 0.108 0.128
%RSD 0.068 0.079 0.014 0.016
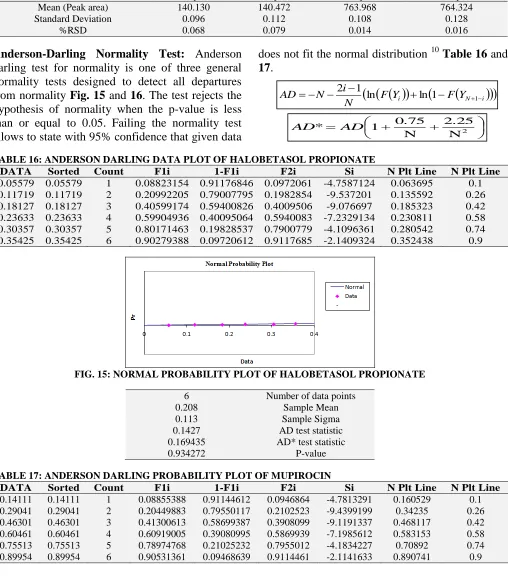
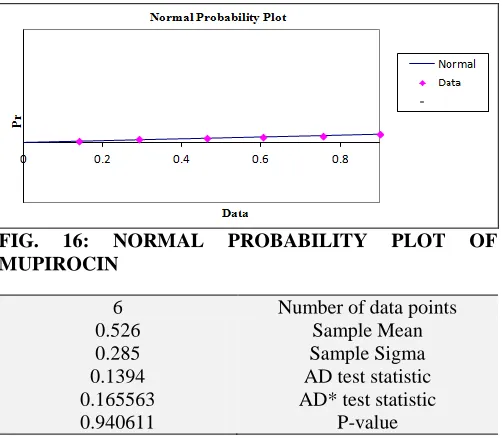
Anderson-Darling Normality Test: Anderson darling test for normality is one of three general normality tests designed to detect all departures from normality Fig. 15 and 16. The test rejects the hypothesis of normality when the p-value is less than or equal to 0.05. Failing the normality test allows to state with 95% confidence that given data
[image:9.612.56.564.193.769.2]does not fit the normal distribution 10 Table 16 and 17.
TABLE 16: ANDERSON DARLING DATA PLOT OF HALOBETASOL PROPIONATE
DATA Sorted Count F1i 1-F1i F2i Si N Plt Line N Plt Line
0.05579 0.05579 1 0.08823154 0.91176846 0.0972061 -4.7587124 0.063695 0.1 0.11719 0.11719 2 0.20992205 0.79007795 0.1982854 -9.537201 0.135592 0.26 0.18127 0.18127 3 0.40599174 0.59400826 0.4009506 -9.076697 0.185323 0.42 0.23633 0.23633 4 0.59904936 0.40095064 0.5940083 -7.2329134 0.230811 0.58 0.30357 0.30357 5 0.80171463 0.19828537 0.7900779 -4.1096361 0.280542 0.74 0.35425 0.35425 6 0.90279388 0.09720612 0.9117685 -2.1409324 0.352438 0.9
FIG. 15: NORMAL PROBABILITY PLOT OF HALOBETASOL PROPIONATE
6 Number of data points
0.208 Sample Mean
0.113 Sample Sigma
0.1427 AD test statistic 0.169435 AD* test statistic
0.934272 P-value
TABLE 17: ANDERSON DARLING PROBABILITY PLOT OF MUPIROCIN
DATA Sorted Count F1i 1-F1i F2i Si N Plt Line N Plt Line
0.14111 0.14111 1 0.08855388 0.91144612 0.0946864 -4.7813291 0.160529 0.1 0.29041 0.29041 2 0.20449883 0.79550117 0.2102523 -9.4399199 0.34235 0.26 0.46301 0.46301 3 0.41300613 0.58699387 0.3908099 -9.1191337 0.468117 0.42 0.60461 0.60461 4 0.60919005 0.39080995 0.5869939 -7.1985612 0.583153 0.58 0.75513 0.75513 5 0.78974768 0.21025232 0.7955012 -4.1834227 0.70892 0.74 0.89954 0.89954 6 0.90531361 0.09468639 0.9114461 -2.1141633 0.890741 0.9
F Yi F YN i
Ni N
AD 2 1 ln ln1 1
2
N 2.25 +
N 0.75 +
1
* AD
FIG. 16: NORMAL PROBABILITY PLOT OF MUPIROCIN
6 Number of data points
0.526 Sample Mean
0.285 Sample Sigma
0.1394 AD test statistic 0.165563 AD* test statistic
0.940611 P-value
CONCLUSION: Two UV methods Q-Absorbance ratio method & First derivative zero crossing point method and an RP- HPLC method were developed validated and applied for the simultaneous determination of Halobetasol Propionate and mupirocin in pharmaceutical gel formulation. The developed method was validated as per ICH guidelines and was found to be accurate, precise, robust and specific. The chromatographic elution step is undertaken in a short time. No, interference from any components of the pharmaceutical formulation was observed and the method has been successfully used to perform separation and identification of Halobetasol propionate and mupirocin.
ACKNOWLEDGEMENT: Authors like to thank West-coast pharmaceuticals, Ltd, Ahmedabad, Gujarat for providing free samples of Halobetasol propionate and mupirocin standards.
CONFLICT OF INTEREST: There is no conflict of interest between the authors and any other party
and this article has not been published in any other journal.
REFERENCES:
1. Vanangamudi SS, Murali S and Madhavan S: Apex Labs Private Ltd, assignee. Methods and compositions for dermatological use comprising clobetasol and halobetasol and biopolymers. The United States patent application US 15/368,556. 2017.
2. Koo K, Jeon C and Bhutani T: Beyond monotherapy: a systematic review on creative strategies in topical therapy of psoriasis. Journal of Dermatological Treatment 2017; 28(8): 702-8.
3. Shrotriya S, Ranpise N, Satpute P and Vidhate B: Skin targeting of curcumin solid lipid nanoparticles-engrossed topical gel for the treatment of pigmentation and irritant contact dermatitis. Artificial cells, nanomedicine, and biotechnology 2018; 46(7): 1471-82.
4. Bassuoni YF, Elzanfaly ES, Essam HM and Zaazaa HE: Development and validation of stability indicating TLC densitometric and spectrophotometric methods for determination of clobetasol propionate. Bulletin of Faculty of Pharmacy, Cairo University 2016; 54(2): 165-74. 5. Bakeev KA: Process analytical technology: spectroscopic
tools and implementation strategies for the chemical and pharmaceutical industries. John Wiley & Sons; 2010. 6. Curbete MM and Salgado HR: A critical review of the
properties of fusidic acid and analytical methods for its determination. Critical Reviews in Analytical Chemistry 2016; 46(4): 352-60.
7. Praça FS, Medina WS, Eloy JO, Petrilli R, Campos PM, Ascenso A and Bentley MV: Evaluation of critical parameters for in vitro skin permeation and penetration studies using animal skin models. European Journal of Pharmaceutical Sciences 2018; 111: 121-32.
8. Cern A, Nativ-Roth E, Goldblum A and Barenholz Y: Effect of solubilizing agents on mupirocin loading into and release from PEGylated nanoliposomes. Journal of pharmaceutical sciences 2014; 103(7): 2131-8.
9. ICH I. Q2 (R1): Validation of analytical procedures: text
and methodology. International Conference on
Harmonization, Geneva 2005.
10. Rajput SJ and Sathe MA: Application of doe and statistical analysis for development and validation of analytical method for chlorhexidine gluconate and cetrimide in its bulk and pharmaceutical dosage forms. International Journal of Pharmaceutical Sciences and Research 2018; 9(7): 2800-6.
All © 2013 are reserved by International Journal of Pharmaceutical Sciences and Research. This Journal licensed under a Creative Commons Attribution-NonCommercial-ShareAlike 3.0 Unported License.
This article can be downloaded to ANDROID OS based mobile. Scan QR Code using Code/Bar Scanner from your mobile. (Scanners are available on Google Play store)
How to cite this article:
[image:10.612.49.300.53.272.2]