N A N O E X P R E S S
Open Access
Nanoscale Relationship Between CD4 and CD25
of T Cells Visualized with NSOM/QD-Based
Dual-Color Imaging System
Jinping Fan, Xiaoxu Lu, Shengde Liu and Liyun Zhong
*Abstract
In this study, by using of near-field scanning optical microscopy (NSOM)/immune-labeling quantum dot (QD)-based dual-color imaging system, we achieved the direct visualization of nanoscale profiles for distribution and organization of CD4 and CD25 molecules in T cells. A novel and interesting finding was that though CD25 clustering as nanodomains were observed on the surface of CD4+CD25highregulatory T cells, these CD25 nanodomains were not co-localized with CD4 nanodomains. This result presented that the formation of these CD25 nanodomains on the surface of CD4+CD25highT cells were not associated with the response of T cell receptor (TCR)/CD3-dependent signal transduction. In contrast, on the surface of CD4+CD25lowT cells, CD25 molecules distributed randomly without forming nanodomains while CD4 clustering as nanodomains can be observed; on the surface of CD8+CD25+T cells, CD25 clustering as nanodomains and co-localization with CD8 nanodomains were observed. Collectively, above these results exhibited that TCR/CD3-based microdomains were indeed required for TCR/CD3-mediated T cells activation and enhanced the immune activity of CD4+CD25lowT cells or CD8+CD25+T cells. In particular, it was found that the formation of CD25 nanodomains and their segregation from TCR/CD3 microdomains were the intrinsic capability of CD4+CD25highT cells, suggesting this specific imaging feature of CD25 should be greatly associated with the regulatory activity of CD4+CD25highT cells. Importantly, this novel NSOM/QD-based dual-color imaging system will provide a useful tool for the research of distribution-function relationship of cell-surface molecules.
Keywords:Near-field scanning optical microscopy, Quantum dots, T cells, TCR/CD3, CD4, CD25
Background
CD4+CD25high regulatory T cells play an important role in suppression of a wide range of immune responses tar-geting various microbes, intracellular parasites, allergens, allo-antigens, and tumors [1–6]. Specially, it has been demonstrated that the effector function and regulatory activity of CD4+CD25highT cells depend at least partially on T cell receptor (TCR)-major histocompatibility com-plex (MHC) interactions [7]. A lot of evidences exhibit that TCR/CD3 microdomains are a precondition to in-duce the immunologic synapse, in which a variety of signaling molecules are recruited to TCR/CD3 microdo-mains and facilitate T cell activation [8–11]. In recent years, combing dipole-polarization and dual-color im-aging, we have constructed a near-field scanning optical
microscopy (NSOM) and quantum dot (QD)-based nanosystem to visualize nanoscale distribution and organization of antigen-specific TCR/CD3, co-receptor CD4, CD8, as well as the nanospatial relationship be-tween TCR/CD3 and CD4 or CD8 in a sustained T cells activation. The obtained results show that CD4 or CD8 are clustered and co-localized with TCR/CD3 microdo-mains in a sustained T cells activation, and the nanoscale imaging information supplies the convincing evidence in the molecular mechanism study of T cell activation sig-naling [12–14]. Up to now, it remains controversial about the molecular mechanism of CD4+CD25high regu-latory T cells-mediated suppression of autoimmunity [15, 16]. Moreover, there is no nanoscale information conceiving whether the distribution and organization of CD25 on the surface of CD4+CD25highT cells are associ-ated with its regulatory activity, the direct molecule * Correspondence:[email protected]
Guangdong Provincial Laboratory of Nanophotonic Functional Materials and Devices, South China Normal University, Guangzhou 510006, Guangdong, China
imaging of nanoscale relationship between CD25 and CD4 has not been reported.
In this study, by using our homemade NSOM/QD-based dual-color imaging system, we intend to directly visualize nanoscale nanospatial relationship between CD4 and CD25 of CD4+CD25highregulatory T cells, fur-ther detect whefur-ther the distribution and organization of CD25 on the surface of CD4+CD25highT cells are associ-ated with its regulatory activity.
Methods
Samples
We obtained human peripheral blood from the Blood Bank at University of Illinois at Chicago Hospital with formal agreement by the healthy volunteers, with the approval of the regional ethics committee. Peripheral blood mononuclear cells (PBMC) were isolated by Ficoll-Hypaque gradient centrifugation and washed with phosphate-buffered saline (PBS) as described by our pre-vious reports [12].
Antibodies and Reagents
We purchased anti-CD3-coated 96-well plates from BD Biosciences. Roswell Park Memorial Institute (RPMI)-1640 culture medium was obtained from GibcoBRL Corp. Rabbit anti-human CD4 and CD8 were purchased from Dako. Bio-tinylated anti-human CD25 was obtained from Sigma. The following antibodies and QDs were purchased from Invitro-gen: biotinylated anti-mouse IgG, anti-rabbit IgG (H + L)-conjugated QD 655, and streptavidin-L)-conjugated QD 605. Additionally, before the antibody labeling, all QDs were centrifuged to remove aggregates of QDs.
T Cell Stimulation and Immune Staining
To achieve T cells co-stimulation with anti-CD3/anti-CD28 antibodies (Abs), we first seeded PBMC at a cell density of 2 × 10⁵ cells/mL onto anti-CD3 antibody (Ab)-coated 96-well plates, and then co-cultured them with 5 ng/mL anti-CD28 Ab for 12 and 48 h, respect-ively, in Roswell Park Memorial Institute (RPMI) 1640, containing 10 % FBS at 37 °C in a 5 % CO2atmosphere.
To rule out the possibility of non-specific activation of T cells induced by antibody labeling in T cell immuno-staining, first of all, we chose 2 % formalin/PBS solution to fix T cells. In the first color labeling, CD25 molecules were labeled with biotinylated human CD25 anti-body and then with streptavidin-conjugated QD 605. In the second color labeling, CD4 (or CD8) were labeled with rabbit anti-human CD4 (or CD8) and then with anti-rabbit IgG (H + L)-conjugated QD 655. Finally, the cells were further fixed through using 2 % formalin/PBS solution. Meanwhile, to remove any unbound antibody or QDs in above each labeling step, the cells were washed twice through employing FBS/PBS, in which the
size of Ab or streptavidin-conjugated QD was about 25 nm, and the size of CD4 or CD8 or CD25 was about 1–5 nm, respectively. Following, to spread double dis-tilled water suspensions of cells onto glass cover slides effectively, all glass cover slides were pretreated with poly-L-lysine (Sigma) and air dried at room temperature performed in our NSOM imaging study. Furthermore, as described in our previous reports [12], to avoid the possi-bility of non-specific labeling, the control labeling was also performed with isotype control antibody simultaneously.
In addition, to evaluate T cells activity and its regula-tory activity, we respectively detected two cytokine pro-ductions of IL-2 and IL-10 in supernatant by ELISA in accordance with the manufacturer’s instruction (Bender Medsystems, Austria), in which CD4+CD25+ T cells and CD8+CD25+ T cells were purified with magnetic affinity cell sorting (MACS) approach though using the manufac-turer’s instruction (Miltenyi Biotec, Sunnyvale, CA, USA).
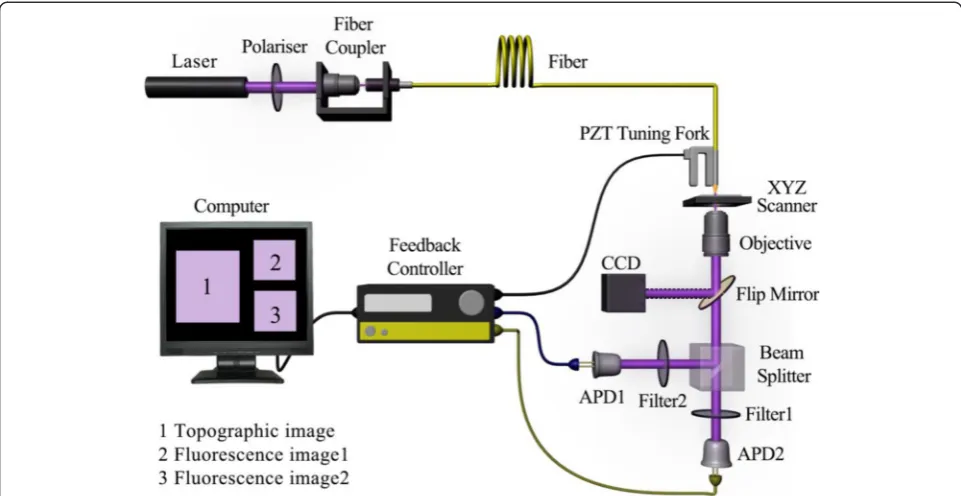
NSOM/QD-Based Dual-Color Imaging System
were performed a slight low-pass filtering before data pro-cessing. Our previous study has demonstrated that all above parameters were stable and reproducible during the repeated scanning [12].
Image Processing and Data Analyses
To achieve high-quality NSOM fluorescence image and topographic image, firstly, we performed preprocessing for all captured images with leveling and the convolution by SPMLab 6.02 software (Veeco, USA), in which each pixel gray level was processed by its neighborhood aver-aging to reduce the influence of the stray noise points, so the image information lost will be very small. Subse-quently, we chose Matlab 7.0 to perform the following image processing and analyses. (1) The color-coded technique in red and blue were implemented on the two fluorescence images captured by NSOM simultaneously, showing two labeled molecules (CD4 or CD8, as well as CD25); (2) a two-dimensional merged image of two color fluorescence images was obtained through using the intensity superposition algorithm of point to point (pixel to pixel), which expressed the intensity sum of pixel to pixel for one color fluorescence image to an-other color fluorescence image; (3) The fluorescence in-tensity and FWHM distribution of fluorescent spots, the fluorescence intensity of single QD, and the number of QD molecules in each fluorescence spot were calculated as following: since it has been found that a typical count rate for individual QD 655 and QD 605 were about 7000
and 4500 counts/s, respectively, at the excitation laser intensity of 120 W/μm2, and these values were reprodu-cible in repeat experiments [12]. Moreover, one-on-one interaction between the conjugated QD and antigen or biotin was the favor in a saturation binding condition. Therefore, the QD numbers to correlate the molecule numbers were calculated on the basis of the conservative assumption that the QD: secondary Ab: primary Ab: tar-get molecule = 1:1:1:1, in which the intensity of each spot was determined by adding all photon counts with a contour of 15 % of the peak intensity; (4) Using the aver-age fluorescence intensity to indicate the averaver-age QD numbers, we can calculate the molecular density as div-iding the molecule numbers over the nanodomains areas; (5) All data were expressed as mean ± standard error of the mean (SEM), Student’s t test for the com-parison of means was employed to show the statistical difference of molecular density, as well as the percent-ages of molecules that localized into nanodomains of dif-ferent groups, and P value less than 0.05 is considered to be statistically significant.
Results
Most of CD25 Were Clustered as Nanodomains but Not
Co-localized with CD4 Nanodomains in CD4+CD25highT
Cells
[image:3.595.57.538.89.337.2]antigen presentation cell (APC) interface [9, 16], and CD4 function as co-receptor stabilizing MHCp-TCR/ CD3 interaction for enhancing TCR/CD3 signaling. Moreover, our recent work also showed that co-receptor CD4 molecules were clustered as nanodomains and co-localized with TCR/CD3 microdomains in a sustained T cells activation [12]. For convenience, in this study, we took advantage CD4 clustering as readout of TCR/CD3 signaling. In addition, since IL-2 production is required for TCR/CD3-mediated T cells activation [17], we choose IL-2 production as the activity parameter of TCR/CD3-mediated T cells activation.
CD4+CD25highregulatory T cells, revealing the lack of the response upon TCR/CD3-mediated activation, are greatly different from conventional CD4+CD25lowT cells with the positive immune response. Therefore, we ask whether CD25 nanoscale imaging of CD4+CD25high
regulatory T cells is different from that of CD4+CD25low T cells. To solve this issue, we employed our homemade NSOM/QD-based dual-color imaging system to detect the nanoscale spatial relationship between CD4 and CD25 for different subset of T cells. Furthermore, since IL-10 production is an important immunoregulatory cytokine and the effect of CD4+CD25high regulatory T cells is mainly mediated by IL-10 [18]; thus, we choose IL-10 production as the evaluation parameter of CD4 +
CD25highT cells regulatory activity.
To discriminate CD4+CD25low T cells and CD4 +
CD25high T cells during T cells activation, we defined these two subsets of CD4+ T cells with different CD25 expression based on the anti-CD3/anti-CD28 Abs co-stimulated time: (i) CD4+CD25low T cells, stimulated time is less than 12 h; (ii) CD4+CD25highT cells, stimu-lated time is more than 48 h. Furthermore, to evaluate
I
CD 4(Un
-stimu lated)
CD2 5(Un-s
timulate
d) low)
CD25
+
CD 4(CD4
)
low
CD25
+
CD 25(CD
4 0
10 20 30 40
* **
M
o
le
c
u
le
r
a
tio
(%
)
J
CD 4(U
n-st imulat
ed)
CD25(Un -stimu
late
d) low)
CD 25
+
CD 4(CD4
)
low
CD 25
+
CD25 (CD4
0 200 400 600
*
*
Molecule density (/µm
2)
E
F
G
H
Topography CD4 CD25 CD4+CD25
Merge
A
B
C
D
1um 1um 1um 1um
200nm 200nm 200nm
1um
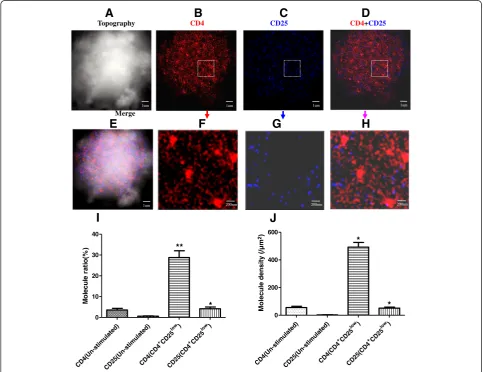
Fig. 2Simultaneous nanoscale dual-color imaging of CD4 and CD25 on the surface of CD4+CD25lowT cells through using NSOM/QD system.aT cell
topography.bFluorescence image of CD4 labeled with QD-655 (red).cFluorescence image of CD25 labeled with QD-605 (blue).dMerge of CD4 and CD25 two color fluorescence images.eMerge of cell topography and two color fluorescence images.f–hZoom images of the areas as indicated by the
[image:4.595.56.540.302.674.2]the nanoscale distribution and organization of CD4 and CD25, we defined nanostructures of these molecules as nanoclusters with size of 100–200 nm and nanodomains with size of 200–500 nm, respectively. Additionally, our recent work showed that most of the CD4 molecules on the resting T cell were detected as 70–140 nm nanoclus-ters and distinct with 40–50-nm distance from each other under the high resolution NSOM [12], but CD25 is expressed on the activated T cells. As an initial effort, to directly visualize CD4 interaction with CD25 during T cells activation through using NSOM-QD-based dual-color system, we first imaged nanoscale distribution and relationship of CD4 and CD25 on the cell surface of CD4+CD25low T cells with the anti-CD3/anti-CD28 Abs co-stimulation. Interestingly, on the surface of CD4 +
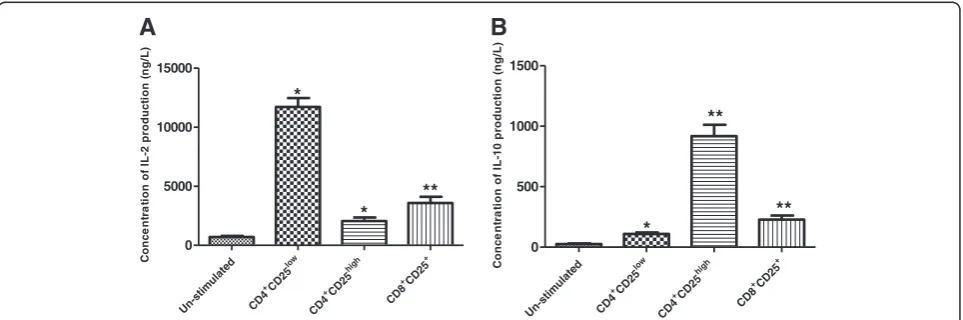
CD25lowT cells, about 30 % of CD4 molecules cluster-ing as nanodomains of 200–350 nm can be observed, but no visible CD25 clustering were observed and nearly all of the CD25 molecules distributed randomly on the cell surface (Fig. 2a–c). As described in our recent work [12], in CD4+CD25low T cells, these CD4 nanodomains were interacted and co-localized with TCR/CD3 micro-domains. Accordingly, as shown in Fig. 3a, the concen-tration of IL-2 production of CD4+CD25low T cells (11700.4 ± 872.3 ng/L) was nearly 17 times bigger than that of un-stimulated T cells (704.8 ± 37.6 ng/L), indicat-ing that TCR/CD3-based microdomains were indeed re-quired for TCR/CD3-mediated T cells activation and enhanced the immune activity of CD4+CD25lowT cells.
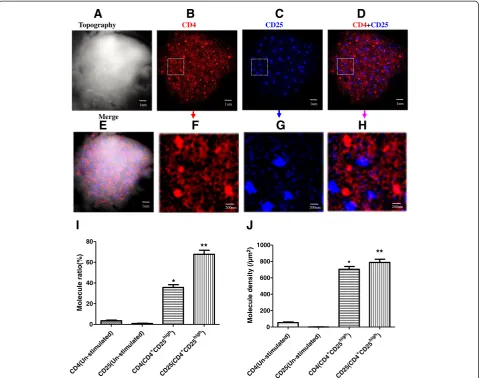
For CD4+CD25high T cells, using NSOM-QD-based dual-color imaging system, though a lot of CD4 cluster-ing and CD25 clustercluster-ing with the size of 200–350 nm also can be observed on the cell surface (Fig. 4a–c, e–g), but surprisingly, these specific CD25 nanodomains were not co-localized with CD4 nanodomains (Fig. 4d, h). The statistical analysis showed that though the average
molecule density of CD25 in nanodomains (789 ± 45/μm2) was nearly the same with that of CD4 in nanodomains (705 ± 34/μm2) (Fig. 4j), but the percentage of CD25 mole-cules that arrayed to form nanodomains (67.7 ± 3.4 %) was nearly two times bigger than that of CD4 molecules that arrayed to form nanodomains (35.7 ± 2.2 %) (Fig. 4i). Re-cently, it has been reported that CD4 clustering was greatly associated with TCR/CD3-mediated signaling transduction, in which CD4 clustering and its co-localization with TCR/CD3 microdomains will lead TCR-mediated signaling amplifies and facilitate T cells activation. In response, as shown in Fig. 3a, b, the concen-tration of IL-2 production of CD4+CD25high T cells (2054.8 ± 264.7 ng/L) was about 80 % lower than that of CD4+CD25low T cells (11700.4 ± 872.3 ng/L) while the concentration of IL-10 production in CD4+CD25high T cells (918.4 ± 86.7 ng/L) was nearly 8.5 times bigger than that of CD4+CD25lowT cells (109.8 ± 8.6 ng/L). Obviously, these results exhibited that the formation of CD25 nano-domains was not associated with TCR/CD3-mediated sig-naling transduction, but such a large number of CD25 clustering would implicate a positive feedback to facilitate the regulatory activity of CD4+CD25highT cells, suggesting that this specific imaging feature of CD25 was possibly as-sociated with the regulatory activity and the effector func-tion of CD4+CD25highT cells.
Most of CD25 Were Clustered as Nanodomains and
Co-localized with CD8 Nanodomains in CD8+CD25+T Cells
To determine whether the formation of CD25 nanodo-mains and its segregation from TCR/CD3 microdonanodo-mains was the intrinsic event and specific capability of CD4 +
CD25high T cells, we also utilized NSOM/QD-based dual-color imaging system to visualize the nanospatial relationship between CD8 and CD25 in CD8+CD25+ T cells. As we know, like co-receptor CD4 in CD4+CD25+
A
B
Un-stim
ulate d low
CD25 + CD4 high CD25 + CD4 + CD2 5 + CD 8 0 5000 10000 15000 ** * * C o nc e n tr a ti on of I L-2 pr oduc ti on ( ng/ L) Un-stim ulat
ed low
CD25 + CD 4 high CD2 5 + CD4 + CD25 + CD8 0 500 1000 1500 * ** ** C o nc e n tr a ti on of I L-1 0 pr oduc ti on ( n g/ L)
[image:5.595.58.540.534.694.2]T cells, it was also well accepted that CD8 function as co-receptors stabilizing MHCp-TCR/CD3 interaction for promoting TCR/CD3 signaling in CD8+CD25+ T cells. Now, collecting evidence indicates that CD8+CD25+ T cells also reveal a little positive immune response upon TCR/CD3-mediated activation [19]. Moreover, our re-cent work also showed that co-receptor CD8 were clus-tered as nanodomains and co-localized with TCR/CD3 microdomains during CD8+CD25+ T cells activation. Similarly, we also took advantage CD8 clustering as readout of TCR/CD3 signaling in the following research.
Interestingly, after anti-CD3/anti-CD28 Abs co-stimulation of 48 h, both CD8 clustering and CD25 clustering as nanodomains of 200–300 nm can be ob-served on the surface of CD8+CD25+T cells through using NSOM-QD-based dual-color system (Fig. 5a–c), moreover,
all of CD25 nanodomains were co-localized with CD8 nanodomains. The statistical analysis showed that though the average molecule density of CD25 in nanodomains (434 ± 29/μm2) was nearly the same with CD8 in nanodo-mains (495 ± 41/μm2) (Fig. 5j), but the percentage of CD25 molecules that arrayed to form nanodomains (57.2 ± 4.1 %) was about two times bigger than that of CD8 molecules (27.6 ± 2.7 %) (Fig. 4i). Accordingly, as shown in Fig. 3a, b, the concentration of IL-2 production of CD8+CD25+ T cells (3579.2 ± 423.5 ng/L) was nearly 75 % higher than that of CD4+CD25high T cells (2054.8 ± 264.7 ng/L) while the concentration of IL-10 production of CD8+CD25+ T cells (228.6 ± 27.3 ng/L) was about 75 % lower than that of CD4+CD25high T cells (918.4 ± 86.7 ng/L). These results possibly exhibited that the formation of CD25 nanodo-mains and their co-localization with CD8 nanodonanodo-mains
I
CD4(Un-stim ulated)
CD25(Un-stim ulated)
)
high
CD25
+
CD4(CD4
)
high
CD25
+
CD25(CD4 0
20 40 60 80
* **
Molecule ratio(%)
J
CD4(Un-stim ulated)
CD25(Un-stim ulated)
)
high
CD25
+
CD4(CD4
)
high
CD25
+
CD25(CD4
0 200 400 600 800 1000
*
**
Molecule density (/µm
2)
A
B
C
D
Topography CD4 CD25 CD4+CD25
Merge
E
F
G
H
1um 1um 1um 1um
200nm 200nm 200nm
1um
Fig. 4Simultaneous nanoscale dual-color imaging of CD4 and CD25 on the surface of CD4+CD25highT cells through using NSOM/QD system.aT cell
topography.bFluorescence image of CD4 labeled with QD-655 (red).cFluorescence image of CD25 labeled with QD-605 (blue).dMerge of CD4 and CD25 two color fluorescence images.eMerge of cell topography and two color fluorescence images.f–hZoom images of the areas as indicated by the
[image:6.595.59.539.89.467.2]were associated with TCR/CD3-mediated signaling, and this nanoscale imaging feature would play an important role to enhance the immune activity CD8+CD25+T cells.
In summary, the above results provided evidence dem-onstrating that TCR/CD3-based microdomains were in-deed required for TCR/CD3-mediated T cells activation.
I
CD
8(Un-stimul ated
)
CD
8(Un-stimulated
) +)
CD 25
+
CD 8(CD8
)
+
CD 25
+
CD 25(CD
8 0
20 40 60 80
*
*
Molecule ratio(%)
J
CD
8(Un-stimulated )
CD 25(Un
-stimu late
d) +)
CD 25 +
CD 8(CD8
) +
CD 25 +
CD 25(
CD 8
0 200 400 600
**
*
Molecule density (/µm
2 )
Topography CD8 CD25 CD8+CD25
E
F
G
H
Merge
A
B
C
D
1um 1um 1um 1um
200nm 200nm 200nm
1um
Fig. 5Simultaneous nanoscale dual-color imaging of CD4 and CD25 on the surface of CD8+CD25+T cells though using NSOM/QD system.aT cell topography.bFluorescence image of CD8 labeled with QD-655 (red).cFluorescence image of CD25 labeled with QD-605 (blue).dMerge of CD8 and CD25 two color fluorescence images.eMerge of cell topography and two color fluorescence images.f–hZoom images of the areas as indicated by the
[image:7.595.56.541.85.618.2]Moreover, it was exhibited that the formation of TCR/ CD3-based microdomains will play an important role in enhancing the immune activity of CD4+CD25lowT cells or CD8+CD25+ T cells. Specially, it was found that the for-mation of CD25 nanodomains and their segregation from TCR/CD3 microdomains were the intrinsic capability of CD4+CD25high T cells, suggesting that this specific im-aging feature of CD25 should be greatly associated with the regulatory activity of CD4+CD25highT cells.
Discussion and Conclusions
Combing the immunofluorescence labeling approach and NSOM/QD-based nanoscale imaging technique, several groups and our previous study have demonstrated that TCR/CD3 microdomains are required for the full T cells activation, in which a variety of signaling molecules including co-receptor CD4 or CD8 are recruited to TCR/ CD3 microdomains and thus facilitate T cells activation [12, 14, 20–22]. As we know, CD4+
CD25highT cells reveal a specific regulatory activity [13, 14], which is different from the conventional CD4+CD25lowT cells with the posi-tive immune response. We therefore ask what is the differ-ence of the nanoscale profiles for distribution and organization of CD4 and CD25 between CD4+CD25highT cells and CD4+CD25lowT cells. Up to now, whether CD25 are clustered and co-localized with CD4 clustering in CD4 +
CD25+ T cells keep unknown and the direct molecule imaging of nanoscale relationship between CD25 and CD4 has not been reported.
In the current study, by using our homemade NSOM/ QD-based dual-color imaging system, we achieved the direct visualization of the nanoscale profiles for distribu-tion and organizadistribu-tion of CD4 and CD25 in CD4+CD25high regulatory T cells or CD4+CD25low T cells. Moreover, based on the detection of IL-2 production and IL-10 pro-duction in different subset of T cells, some information about the relationship between the distribution and organization of CD25 and their effector function were presented. Interestingly, after anti-CD3/anti-CD28 Abs co-stimulation, like CD4 clustering as nanodomains, CD25 clustering as nanodomains were also observed on the surface of CD4+CD25high T cells, but these specific CD25 nanodomains were not co-localized with CD4 nanodomains. However, in CD4+CD25low T cells, CD25 distribute randomly without forming nanodomains while CD4 clustering as nanodomains were observed on the cell surface. Accordingly, the concentration of IL-2 production of CD4+CD25highT cells was greatly lower than that of CD4+CD25lowT cells, but the concentration of IL-10 pro-duction of CD4+CD25highT cells was greatly higher than that of CD4+CD25lowT cells. These results possibly exhib-ited that the formation of CD25 nanodomains was associ-ated with the regulatory activity of CD4+CD25highT cells but did not dependent on TCR/CD3-mediated signaling.
In addition, in CD8+CD25+ T cells, both CD8 cluster-ing and CD25 clustercluster-ing as nanodomains were observed on the cell surface, moreover these CD25 nanodomains were co-localized with CD8 nanodomains, showing that the formation of CD25 nanodomains and their segrega-tion from TCR/CD3 microdomains was the intrinsic im-aging feature of CD4+CD25highregulatory T cells. That is to say, this specific imaging feature of CD25 on CD4 +
CD25highT cells should be associated with its regulatory activity; and the difference of nanoscale profiles for distri-bution and organization of CD25 between CD4+CD25high T cells and CD4+CD25lowT cells should be closely related to their individual effector function. Importantly, by using this novel NSOM/QD-based dual-color imaging system, we can achieve the direct visualization of the nanoscale nanospatial relationship between cell-surface molecules, and this will provide more useful information for the re-search of distribution-function relationship of cell-surface molecules.
Competing Interests
The authors declare that they have no competing interests.
Authors’Contributions
LYZ designed and JPF, XXL, and SDL conducted the experiments. JPL and LYZ wrote the manuscript. All authors read and approved the final manuscript.
Acknowledgements
This work was supported by the Chinese National Nature Science Fund No. 61078064 and 61275015. We thank for technique assistances of Prof. Zheng W Chen Lab (Department of Microbiology & Immunology, University of Illinois at Chicago).
Received: 20 August 2015 Accepted: 19 October 2015
References
1. Kinnear G, Wood KJ, Fallah-Arani F, Jones ND (2013) A diametric role for OX40 in the response of effector/memory CD4+ T cells and regulatory T cells to alloantigen. J Immunol 193:1465–1475
2. Bensinger SJ, Bandeira A, Jordan MS, Caton AJ, Laufer TM (2001) Major histocompatibility complex class II-positive cortical epithelium mediates the selection of CD4(+)25(+) immunoregulatory T cells. J Exp Med 194:427–438 3. Sakaguchi S (2004) Naturally arising CD4+ regulatory T cells for
immunologic self-tolerance and negative control of immune responses. Annu Rev Immunol 22:531–562
4. Panzer M, Sitte S, Wirth S, Drexler I, Sparwasser T, Voehringer D (2012) Rapid in vivo conversion of effector T cells into Th2 cells during helminth infection. J Immunol 188:615–623
5. Ganesan AP, Johansson M, Ruffell B, Beltran A, Lau J, Jablons DM et al (2013) Cells inhibit endogenous cytotoxic T cell responses to lung adenocarcinoma. J Immunol 191:2009–2017
6. Liu Z, Zhang C, Sun J (2010) Deacetylase inhibitor trichostatin A down-regulates Foxp3 expression and reduces CD4+CD25+ regulatory T cells. Biochem Biophys Res Commun 400:409–412
7. Shimoda M, Mmanywa F, Joshi SK, Li T, Miyake K, Pihkala J et al (2006) Conditional ablation of MHC-II suggests an indirect role for MHC-II in regulatory CD4 T cell maintenance. J Immunol 176:6503–6511
8. Fooksman DR, Vardhana S, Vasiliver-Shamis G, Liese J, Blair DA, Waite J et al (2010) Functional anatomy of T cell activation and synapse formation. Annu Rev Immunol 28:79–105
10. Minguet S, Swamy M, Alarcon B, Luescher IF, Schamel WW (2007) Full activation of the T cell receptor requires both clustering and conformational changes at CD3. Immunity 26:43–54
11. Bunnell SC, Hong DI, Kardon JR, Yamazaki T, McGlade CJ, Barr VA et al (2002) T cell receptor ligation induces the formation of dynamically regulated signaling assemblies. J Cell Biol 158:1263–1275
12. Zhong L, Zeng G, Lu X, Wang RC, Gong G, Yan L et al (2009) NSOM/QD-based direct visualization of CD3-induced and CD28-enhanced nanospatial coclustering of TCR and coreceptor in nanodomains in T cell activation. PLoS One 4:e5945
13. Chen Y, Qin J, Chen ZW (2008) Fluorescence-topographic NSOM directly visualizes peak-valley polarities of GM1/GM3 rafts in cell membrane fluctuations. J Lipid Res 49:2268–2275
14. Sherman E, Barr V, Manley S, Patterson G, Balagopalan L, Akpan I et al (2011) Functional nanoscale organization of signaling molecules downstream of the T cell antigen receptor. Immunity 35:705–720
15. Cao J, Jin Y, Li W, Zhang B, He Y, Liu H et al (2013) DNA vaccines targeting the encoded antigens to dendritic cells induce potent antitumor immunity in mice. BMC Immunol 14:39
16. Zaiss DM, van Loosdregt J, Gorlani A, Bekker CP, Grone A, Sibilia M et al (2013) Amphiregulin enhances regulatory T cell-suppressive function via the epidermal growth factor receptor. Immunity 38:275–284
17. Schwartz RH (1996) Models of T cell anergy: is there a common molecular mechanism? J Exp Med 184:1–8
18. Liu H, Hu B, Xu D, Liew FY (2003) CD4+CD25+ regulatory T cells cure murine colitis: the role of IL-10, TGF-beta, and CTLA4. J Immunol 171:5012–5017 19. Zapata DA, Schamel WW, Torres PS, Alarcon B, Rossi NE, Navarro MN et al
(2004) Biochemical differences in the alphabeta T cell receptor.CD3 surface complex between CD8+ and CD4+ human mature T lymphocytes. J Biol Chem 279:24485–24492
20. Dustin ML, Depoil D (2011) New insights into the T cell synapse from single molecule techniques. Nat Rev Immunol 11:672–84
21. Ortiz S, Lee W, Smith D, Forman SJ, Lee TD, Liu C (2010) Comparative analyses of differentially-induced TCR-mediated phosphorylation pathways in T lymphoma cells. Exp Biol Med 235:1450–63
22. Choudhuri K, Dustin ML (2010) Signaling microdomains in T cells. FEBS Lett 584:4823–481
Submit your manuscript to a
journal and benefi t from:
7Convenient online submission
7Rigorous peer review
7Immediate publication on acceptance
7Open access: articles freely available online
7High visibility within the fi eld
7Retaining the copyright to your article