Poulovassilis, Alexandra and Larsson, Nick and Candlin, Fiona and Larkin,
Jamie and Ballatore, Andrea (2019) Creating a Knowledge Base to research
the history of UK Museums through Rapid Application Development. ACM
Journal of Computing and Cultural Heritage , ISSN 1556-4673. (In Press)
Downloaded from:
Usage Guidelines:
Please refer to usage guidelines at
or alternatively
Creating a Knowledge Base to research the history of UK Museums
through Rapid Application Development
ALEXANDRA POULOVASSILIS, NICK LARSSON, FIONA CANDLIN, JAMIE LARKIN, and
AN-DREA BALLATORE,
Birkbeck, University of LondonSeveral studies have highlighted the absence of an integrated comprehensive dataset covering all of the UK’s museums, hence impeding research into the emergence, evolution and wider impact of the UK’s museums sector. “Mapping Museums” is an interdisciplinary project aiming to develop a comprehensive database of UK museums in existence since 1960, and to use this to undertake an evidence-based analysis of the development of the UK’s museum sector during 1960-2020 and the links to wider cultural, social, and political concerns. A major part of the project has been the iterative, participatory design of a new RDF/S Knowledge Base to store data and metadata relating to the UK’s museums, and a Web Application for the project’s humanities scholars to browse, search and visualise the data in order to investigate their research questions. This paper presents the challenges we faced in developing the Knowledge Base and Web Application, our methodology and methods, the design and implementation of the system, and the design, outcomes and implications of a user trial undertaken with a group of experts from the UK’s museums sector.
CCS Concepts: • Applied computing→ Arts and humanities; • Information systems→ Digital libraries and archives; •Computing methodologies→Knowledge representation and reasoning.
Additional Key Words and Phrases: knowledge base development, museum studies ACM Reference Format:
Alexandra Poulovassilis, Nick Larsson, Fiona Candlin, Jamie Larkin, and Andrea Ballatore. 2019. Creating a Knowledge Base to research the history of UK Museums through Rapid Application Development.ACM J. Comput. Cult. Herit.37, 4, Article 111 (August 2019),31pages.https://doi.org/10.1145/1122445.1122456
1 INTRODUCTION
Several studies in recent decades have identified the absence of an integrated comprehensive dataset covering all of the UK’s museums [1,18,20,32]. There is no comprehensive information of the museums currently in existence, museums that have closed, or the subject matter of these museums, and visitor numbers are only recorded for accredited museums, which make up only around 50% of the total. There are particular gaps in the data with respect to small independent museums run by community or special interest groups, and there are no longitudinal records whatsoever [3]. Without this information, it is impossible to understand the emergence, evolution and wider impact of the UK museums sector, or to grasp the history of the sector as a whole. The lack of coherent data also has implications for policy makers especially in relation to growth, sustainability, subject coverage, and regional and national disparities in museum distribution.
Authors’ address: Alexandra Poulovassilis, [email protected]; Nick Larsson, [email protected]; Fiona Candlin, [email protected]; Jamie Larkin, [email protected]; Andrea Ballatore, [email protected], Birkbeck, University of London, Malet Street, London, United Kingdom, WC1E 7HX.
Permission to make digital or hard copies of all or part of this work for personal or classroom use is granted without fee provided that copies are not made or distributed for profit or commercial advantage and that copies bear this notice and the full citation on the first page. Copyrights for components of this work owned by others than ACM must be honored. Abstracting with credit is permitted. To copy otherwise, or republish, to post on servers or to redistribute to lists, requires prior specific permission and/or a fee. Request permissions from [email protected].
This lack of integrated, comprehensive information about the UK’s museum sector motivates the research of the “Mapping Museums” project1. Mapping Museums aims to develop a comprehensive database of UK museums
in existence since 1960 and use it to undertake an evidence-based analysis of the development of the UK’s museum sector since 1960 and the links to wider cultural, social, and political concerns2. Mapping Museums (MM) is an
interdisciplinary project involving researchers from art history, museology, computer science, and geographic information science (GIScience). During the first two years of the project, the research team has gathered, cleansed and codified data relating to over 4000 UK museums — almost double the number of museums covered in any previous survey, and covering the whole period from 1960 to date. This process has been lengthy and challenging, involving the need to identify and integrate existing data sources, rectify gaps and inconsistencies in the data; and also to develop a common conceptualisation of what constitutes a museum and what are the key attributes of museums that need to be captured in order to support the project’s historical research objectives.
A key part of the project has involved eliciting the evolving knowledge and requirements of the project’s humanities scholars by means of iterative, participatory design of a new RDF/S Knowledge Base to store the data and metadata relating to the museums, and a Web Application allowing them to browse, search and visualise the data in order to investigate their research questions3. This paper describes the challenges we faced in developing
the Knowledge Base (KB) and Web Application (Web App), the methodology and methods we adopted, the design and implementation of the KB and Web App, and the design and outcomes of a user evaluation study undertaken with a diverse group of independent museum experts.
A key methodological challenge was that development of the KB and the Web App needed to start well before the end of the data collection phase: this is because the data collection has taken over two years and the development of the KB and Web App also needed to be completed within that same time frame according to the project’s timing and funding schedule. It was also not possible to wait until the KB and Web App were finalised before beginning the historical research work that the KB and Web App would support. Moreover, the incremental accrual of data and knowledge served to incrementally elucidate the historical research questions to be investigated: it was not possible to formulate these questions in detail ahead of starting the KB and Web App development, and indeed the initial research proposal had formulated its research questions in high level terms, exactly because of the lack of comprehensive data and knowledge of the sector.
These parallel and incremental activities of (i) data and knowledge accrual, (ii) KB and Web App development, and (iii) research question elucidation, have necessitated the adoption of a rapid prototyping approach to the development of the KB and Web App. The staffing resource funded for their development was 21 months of one (experienced) full-time software developer, further necessitating the application of agile software development principles. The incremental accrual of data and metadata also informed the approach taken towards designing the Web App, in that our software is metadata-driven, making the system easily extensible with additional attributes of museums, as well data about new museums.
A key contribution of this paper is therefore the methodology and methods we adopted to successfully design and implement the KB and the Web App within these tight scheduling, resourcing and data collection constraints (the timeline of the MM project is summarised in Appendix A). A further contribution is the design and outcomes of a user evaluation study of the KB and Web App undertaken with a diverse group of independent domain experts, and the insights gained. Beyond our own project, the methodology, methods and designs we present here have the potential to inform other projects that aim to create knowledge-rich resources through interdisciplinary research across computer science, the humanities, and the social sciences.
1Funded by the UK Arts and Humanities Research Council (AHRC), 2016-2020, Ref AH/N007042/1. 2www.mappingmuseums.org
Related Work.There has been much work over the past decade in gathering and publishing museum and
cultural heritage data as Linked Open data [2,5,11,12,14,17], typically using the CIDOC CRM [4] as thede factostandard schema. These efforts capture detailed information about cultural artefacts, and require mapping
from museums’ internal datasets to this standard or to some other fixed schema. Our work contrasts with this as our primary motivation is to support the research of humanities scholars in investigating the development of a whole museum sector. Because of the heterogeneity of the input datasets, and the continual evolution of the domain experts’ conceptualisations and identification of museums’ attributes that needed to be captured in order to support their research, it was not possible to adopt or specify from the outset a fixed schema. In any case, the CIDOC CRM was not appropriate for our purposes as it provides rich formalisms for describing the cultural heritage domain and cultural heritage artefacts, rather than museums’ governance, accreditation, thematic focus, opening/closing, and geodemographic context, which were of highest importance for the MM project. Another point of differentiation of our work is that we needed to develop our KB and Web App concurrently, whereas previous projects that have published cultural heritage datasets have tended to first create the dataset and subsequently to turn to developing applications for users to explore the data.
We note here the IMLS dataset of USA museums, which is similar in scope to our own dataset and covers some 30,000 museums4. Its stated aim is to be “useful to researchers, journalists, the public, local practitioners, and
policymakers at the federal, state, and local levels for planning, evaluation, and policy making.” This is a much more general aim than the specific historical research investigation of the UK museum sector being undertaken by the MM project. Thus, IMLS has a coarse discipline-based classification of the thematic focus of museums, as compared to the detailed Subject Matter taxonomy that we developed in our project (see Section3.3). It does not include the equivalent of our governance and accreditation status attributes, nor does it include opening/closing dates of museums. On the other hand, it does include finance information, which was not within the scope of our own research. It also uses a narrower definition of what constitutes a “museum” than the one required for the MM’s project historical research5.
The MM Knowledge Base comprises both an ontology part (expressed in RDFS) and an instance data part (expressed in RDF). In this context, an “ontology” allows the representation of explicit and implied concepts relevant to a particular domain [9,10]. Many ontology development methodologies have been proposed over the past 20 years, including METHONTOLOGY [7], On-To-Knowledge Methodology [31], DILIGENT [24], UPON [6], HCOME [15], NEON [30]. Earlier methodologies tended to follow a phased development approach, for example in the case of METHONTOLOGY comprising successive phases of requirements specification, conceptualisation, formalisation, integration, implementation, and maintenance. For the reasons stated earlier, it was not feasible for us to follow a phased approach to developing the MM project’s KB, and indeed we have iteratively pursued requirements specification, conceptualisation, formalisation, integration, implementation and validation steps throughout the first two years of the project. In this respect, our approach has commonalities with DILIGENT and HCOME which emphasise the evolving nature of an ontology specification. However, our KB has been developed concurrently with the incremental data collection and the Web App, and has informed and been informed by these parallel activities. In contrast, ontology development methodologies generally aim to capture domain knowledge independently of the requirements of any particular application.
Early ontology development methodologies tended to be designed for the knowledge engineer rather than the domain expert. Only more recently (e.g. in HCOME and NEON) is an active role for domain experts within the ontology development lifecycle envisaged. Similarly to HCOME, the MM project’s domain experts are central to the KB development lifecycle and tools are provided for them to be able to fulfil their role: specifically, the Browse
4https://www.imls.gov/research-evaluation/data-collection/museum-data-files
5IMLS adopts the ICOM definition and uses the NTEEC code from the USA’s Inland Revenue Service to verify that a venue should be regarded
facility of the Web App itself, into which successive versions of our ontology were immediately embedded by the project’s software developer. Similarly to NEON, ontology development is undertaken collaboratively by users, domain experts and software developers. In our case the primary users and primary domain experts were one and the same, namely the MM project’s humanities scholars, and they participated in the ontology requirements specification, conceptualisation and validation, while the project’s computer scientists and GIScience experts focussed on formalisation, integration and implementation. Additional domain experts and user stakeholders from the UK museum sector were also involved in parts of the specification and conceptualisation process (see Section3.3). An additional challenge in the MM project was that the domain experts’ knowledge and detailed research questions evolved concurrently with their data collection and their participation in the ontology development process, informing and being informed by this process.
Outline of the paper.The remainder of the paper is structured as follows. The next section identifies the
major challenges faced by the MM project in developing a KB and Web App to meet the needs of its humanities scholars. Section3presents our methodology and methods, focussing on the overall development process, data collection, conceptual modelling, KB development, and Web App development. Section4gives an overview of the Web App from the viewpoint of a user, and also technical details of how it and the KB have been implemented. Section5describes the design and conduct of a user trial of our system with a broad group of stakeholders from the UK’s museums sector, and analyzes the outcomes of the trial. Section6summarises the innovations and contributions of the research described here and identifies areas of further work.
2 RESEARCH CHALLENGES
The Mapping Museums project exhibits the typical challenges of interdisciplinary research projects that aim to build a software prototype as part of their remit6. Firstly, there is a need to develop a common “language of
discourse” between researchers from different disciplines. Often, a term has a different meanings in different disciplines e.g. “ontology”, “design”, “implementation”, and developing a common understanding of the contextual usage of such terms across the different disciplines is required. Secondly, there is typically a lack of well-defined software requirements at the outset of the project, and so identifying outline requirements on the basis of which to begin to design an initial prototype is a necessary first step. The research typically then progresses in an iterative fashion, comprising successive cycles of requirements elicitation, research and design, implementation, testing and trialling, in a close collaboration between computer scientists, domain experts and users/user stakeholders. Thirdly, there is a need to develop an understanding of, and sensitivity to, the research challenges and the ways of working of the other disciplines. For example, in the MM project, a key difference in the ways of working related to the entity names and attribute values to be used within the KB and Web App. Having cross-team discussions early on helped the non-computer scientists appreciate the need for precision when specifying names and values within the input data being compiled, and to therefore make more effective use of their time as they were collecting, defining and cleansing the data.
The MM project exhibits additional challenges arising from its specific aim to develop a new KB and Web App to support the research of the project’s humanities scholars:
• there is no single existing dataset upon which to base the design of the KB, due to the currently incomplete
knowledge of the UK’s museum sector;
• the development of conceptualisations and knowledge models by the project’s domain experts is part of
the research project itself;
• there is incremental collection and integration of data from diverse sources; additional data sources become
known, or available, during the course of the project;
6Specifically, the MM project exhibits the characteristics of Broad, Cooperative, Integrated, Methodological, Bridge-Building, Instrumental
• the data exhibits incompleteness, uncertainty and contradictions that need to be resolved or handled; • there is incremental development of the humanities scholars’ conceptual model in tandem with this
incremental collection of the data;
• there is sometimes uncertainty, controversy and multiple viewpoints from the range of domain experts and
stakeholders, which need to be discussed, debated and resolved;
• it is difficult to specify the system requirements for searching, visualising and analysing the data while the
conceptual model development and data collection are still in progress;
• these requirements continue to evolve as long as the conceptual model and data continue to evolve.
3 METHODOLOGY
The parallel activities of data collection and collation, development of conceptualisations, elucidation of historical research questions, and development of the KB and Web App that would support the project’s historical research, posed unique challenges and pointed to the need to adopt aparticipatorysoftware development methodology:
participatory design actively involves all stakeholders in an iterative design process [29] so as to ensure that the viewpoints and needs of all stakeholders inform the design at all stages. It also pointed to the need to adopt
semantic technologies(specifically in our case, RDF/S) to develop the KB: representing both data and schema
information in the form of (subject,predicate,object) triples allows the evolving relationships between entities to be captured in fine detail; the schema and the data can easily be extended with new triples as new knowledge or data accrue; and it is possible to extend the evolving schema with other existing taxonomies (specifically in our case, with the geographical Administrative Area hierarchy of the Office for National Statistics7- see Section3.4).
Moreover, as mentioned earlier, data quality is variable due to incompleteness, inconsistency and uncertainty across the input datasets. Data quality does improve as the data is completed and cleansed, but as new data and knowledge accrue so new data quality issues arise. The evolving data and schema cause an inevitable burden on the software development effort, pointing to the need to adopt Rapid Application Development techniques so as to mitigate against the time loss. We describe in detail in Sections3.4and3.5the key software design methods that we employed, which include:
• making the Web App metadata-driven; as well as automatically accommodating updates to the data (e.g.
correction of data about a museum, insertion of missing data items, addition of data about a new museum), the software easily accommodates changes to the schema within its Browse, Search and Visualise facilities;
• developing a small number of data abstractions; this enables rapid extension of the KB and Web App
following extensions to the schema, since each schema extension is an instantiation of an existing, or a new, data abstraction;
• using software introspection; this allows the Web App to automatically build its Browse, Search and
Visualise user interfaces using the data abstractions; moreover, the names of all concepts are derived from the KB and appear as-such in the GUI (as do all data values).
Appendix A gives a summary of the successive iterations of the KB and the Web App over the first 24 months of the MM project. In particular, Version 8 of the KB is coupled with Version 0.1 of the Web App, which is the version that underwent the formative evaluation that is described in Section5of this paper. The iterations of the KB and Web App listed in Appendix A were formal internal releases, but between them numerous additional iterations took place to locate and correct spelling, formatting or type errors in the data, improve the data upload facilities, design and experiment with new data abstractions, and validate the incrementally added new data. Another advantage of developing early versions of the Browse and Search facilities was that data validation could be carried out using early versions of the Web App software itself. Intermediate iterations were carried out on a development server, while baseline iterations were released on a production server to support the
ongoing research of the humanities scholars. We give in Section 3.1 an overview of the overall iterative process for developing the KB and the Web App. Sections 3.2 and 3.3 describe the data collection and conceptual modelling processes, Section 3.4 the development of the KB and Section 3.5 the development of the Web App.
3.1 Overview of our development process
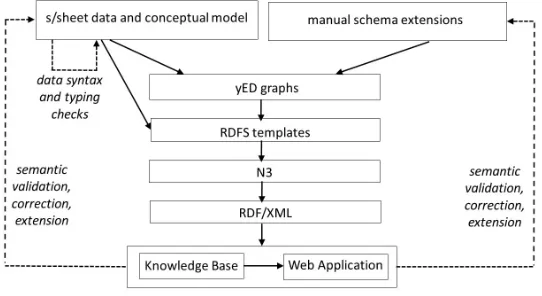
Figure1gives an overview of the iterative development process for the KB and the Web App. Data was collected within three input spreadsheets (this being a tool that the project’s domain experts were familiar with and confident in using) : acore spreadsheetcontaining one row per museum and some 50 columns; agovernance changesspreadsheet that stores historical information about changes in governance for some 30 museums; and
avisitor numbersspreadsheet that stores historical information about recorded visitor numbers for some 2300
museums.
The core spreadsheet includes in its header the name and the data type of each column (data types may be from the xsd name space8or one of our data abstractions — see Section3.4). It contains one row per museum, with
each cell representing a property of the museum. The other two spreadsheets have similar headers, but contain a separate row for each governance change and each visitor numbers measurement, respectively. Each spreadsheet is programmatically analysed for formatting or data type errors, and these are corrected in collaboration with the project’s domain experts.
A step of pre-processing is applied to extend the core spreadsheet with additional data for the Museum Size, geographical coordinates (latitude/longitude), and Administrative Area values of each museum. A graphML representation is then automatically generated from the core s/sheet header and uploaded to the yED tool9.
Additional manual schema extensions were made to this using the yED editor so as to encompass the temporal data model governing the historical visitor numbers data and governance change data.
An RDFS representation is exported from yED in the form of a set of graphML files, one for each of the three input spreadsheets, and an RDFS template is created from each graphML file using a Python program. The RDFS templates are combined with the s/sheet data (in CSV format) to generate the RDF/S triples in N3 again using a Python program. Finally, this is converted to RDF/XML (using RDF2RDF10) and loaded into the KB (Virtuoso11).
3.2 Data collection
There have been numerous government surveys of UK museums in the past 60 years, including by:
• The Museums and Galleries Commission [19,34]. During 1994-1999, its Digest of Museum Statistics
(DOMUS) survey collected information on some 1700 accredited museums. When that project ended most
of the data was deposited in the National Archives12. • The Standing Committee on Museums and Galleries [27,33].
• The Museums, Libraries and Archives Council in England (which replaced the Museums and Galleries
Commission) [8,18].
• The Northern Ireland Museums Council [23].
• The Scottish Museums Council (now Museums and Galleries Scotland) [16,28]. • The Welsh Museums, Archives and Libraries Division [21].
• Arts Council England (ACE), which keeps a list of all the accredited museums in the UK.
Other non-government bodies have also undertaken surveys, including:
8https://www.w3.org/TR/xmlschema11-1/ 9https://www.yworks.com/products/yed 10http://www.l3s.de/ minack/rdf2rdf 11https://virtuoso.openlinksw.com/rdf/
Fig. 1. Overview of the iterative development process.
• in 1983 the Association of Independent Museums (AIM) surveyed independent museums;
• in 1987 the Museums Association established theMuseums.UKdatabase project, which produced the first
digitally available survey [25];
• from 1955 Museums Association produced a Yearbook (previously Museums Calendar) that recorded
details of all its members, and currently supports a paid subscription service offering this information (the
Find-A-Museumservice13).
None of these surveys aimed to provide a single, comprehensive dataset covering the whole of the UK museum sector: they each had different purposes and encompassed different subsets of museums. There was also a lack of a single data collection standard across the different surveys, for example relating to whether, and how, museums’ locations, subject matter, opening/closing dates and visitor numbers are recorded. Moreover, much of the data that was collected has been lost over the years, most notably all of the data from the Museums.UK project of 1987; or it has been poorly archived, for example the DOMUS data which was missing full explanation of all the data encodings employed; or is only available for a fee or on request14. Other inconsistencies in the data
arise from different and changing conceptions of what constitutes a “museum”. This has resulted in uneven data collection practices: for example, venues that are missing from earlier reviews do appear in later ones, and there are differences in the definition of what constitutes a museum across the four countries of the UK (England, Scotland, Wales, Northern Ireland)15.
Data Collation.The Digest of Museum Statistics (DOMUS), 1994-1999, was the most comprehensive existing
dataset (covering some 2,000 museums) and the starting point of our own data collection. It comprises several hundred spreadsheets that had to be understood and reassembled so that data distributed across numerous DOMUS spreadsheets resulted in a single row for each museum in our own core spreadsheet. We also ensured that some attribute names and data values were more meaningful than had been the case before. Having manually cleansed, improved and reassembled the DOMUS data, we proceeded to extend it with data from the other contemporary and historical datasets listed above. This too was done using copy-and-paste methods as there was
13https://www.museumsassociation.org/find-a-museum
14A detailed discussion of these issues can be found in the Research post on “Problems with the Data” at
http://blogs.bbk.ac.uk/mapping-museums
no reliable way, within the time and resource constraints of the project, of automating the integration of these very disparate datasets.
Each museum recorded in our core spreadsheet was assigned a unique identifier including as one of its components the primary source of data about this museum, e.g. the identifier mm.domus.WM014 relates to museum WM014 originally sourced from DOMUS. Typically, a museum’s entry in the spreadsheet would gradually be extended with the discovery of new data about it from other sources. With such additions, additional columns would be added to the core spreadsheet, and the source of each new data item would also be included in an adjacent ‘provenance’ column.
Criteria for inclusion of venues.Official definitions of what constitutes a museum (such as that of the
International Council of Museums — ICOM — and the UK Museums Association) are oriented towards professional practice, setting standards that cannot be matched by many small amateur and community museums; they therefore exclude large numbers of venues and produce a skewed representation of the sector16. In the MM
project, our criteria for including venues within the KB needed to be broader than existing official definitions to ensure that independent and grassroots museums were fully captured. We consulted online resources such as museums’ websites and Wikipedia to source a wider spread of entities that are considered as being “museums” by the public. We sometimes used visitors’ comments on TripAdvisor to ascertain whether a venue could be deemed a museum. Phrases such as ‘this nice museum...’ were clear indications, but also terms like ‘exhibitions’, ‘displays’, ‘historic’, ‘cultural experience’ helped us understand how the venue was being framed and experienced by visitors. To establish our criteria for inclusion we took the lead fromprototype theoryfrom the cognitive
sciences, which recognises that objects within a category do not necessarily all share the same attributes and that some attributes may be more central to the category than others [26]. For example, the British Museum occupies a large neo-classical building and has eight million objects in its collection, while the Burston Strike School Museum is located in a tiny building and only has a handful of items on display, but both are recognisably museums. Generally, we expected museums to have a collection of objects on display, be open to the public (even if only for limited periods of time), occupy a demarcated display space, and be engaged in the preservation of the display objects.
Data cleansing.The data collection process often required cross-checking data about the same museum
arising from different sources and resolving any inconsistencies. In such cases, data from the source deemed most authoritative was selected, and the conflicting data values were recorded in an additional Notes column relating to the attribute in question. Data from government surveys was treated as being most reliable, and we were more circumspect with data from other sources.
The data collection process also required tracking down information that was not present in any data source, which related mainly to museums’ locations, governance status, opening and closing dates, and visitor numbers. To do this we consulted historic guidebooks, gazetteers and regional guides, specialist museums sources, and digital resources (search engines, the BBC 1986 Domesday project). Individual museums’ entries were validated and completed in consultation with museums staff, tourist boards and local history societies, by phone, email and twitter. We also held a series of face-to-face data validation exercises with all nine regional branches of the UK Museum Development Network, during which the data was examined line-by-line. Additional validation was undertaken with museum consultants (notably, Adrian Babbidge) and staff from English Heritage, Historic Environment Scotland, Historic Houses, ACE, Museums Galleries Scotland, and Museums Archives Libraries Division17.
16See the Research posts on “Defining museums” and “Surveying Museums: What’s in and What’s out?” at
http://blogs.bbk.ac.uk/mapping-museums/
17Further details of the data compilation, cleansing and validation can be found in the Research posts on “Getting Started: Compiling
This first stage of data collection was accompanied in parallel by the design of a first version of the conceptual model of our database, focussing on those attributes of museums that would be needed for the project’s historical research. This conceptual model was encoded within the header of the core spreadsheet, including both attribute names and data types. The main attributes identified as being of importance were museums’ accreditation status, location (postal address and administrative location), governance status, size, subject matter, year of opening, and year of closing (if any). Additional attributes, chiefly relating to the provenance of the different items of data that we were collecting, were added over the whole two-year time span of the data collection process.
Handling missing data.The outcome of the first phase of data collection (at 20 Months) was a core s/sheet
comprising over 50 items of data relating to around 4000 museums, as well as two additional s/sheets holding data about museums’ changes in governance status and changes in visitor numbers over time. By this stage we had complete coverage of most attributes apart from visitor numbers, governance, opening date and closing date: specifically, we had governance information for 92% of museums, year of opening for 88% of museums, year of closing for 68% of museums that were known to have closed, and visitor numbers for 67% of museums.
For the missing governance data, we created a sub-category of Unknown governance. For missing open-ing/closing dates, we recorded an interval of the form [earliest possible year of opening, latest possible year of opening]. We tried to make these intervals as narrow as possible by searching for references to the museum being open or closed in a given year within the historical and digital resources mentioned above, and through the data validation exercises held with the stakeholder groups mentioned earlier. TripAdvisor also served as a crowdsourcing tool in this respect, allowing us to find out which years visitors had visited the site, with the absence of a designated page for a museum being an indication that it had closed.
For visitor numbers, disparities in the way that this data is recorded in different primary data sources in any case made it difficult to compare like with like. Our primary requirement was to use visitor numbers as an indication of thesizeof a museum. We therefore decided to gross visitor numbers into museum size
categories of Huge (1M+ visitors per year), Large (50,000-1M), Medium (10,000-50,000) and Small (0-10,000), as well as a sub-category Unknown. As noted earlier, about 33% of museums had no visitor numbers data, and this proportion of museums of Unknown size was deemed to be inadequate for the project’s analytical purposes. We therefore adopted a machine learning approach to estimate these museums’ size from their other attributes, noting that the distribution of museum size is not random but statistically correlated to other attributes (e.g. independent, unaccredited museums tend to be small). The best-performing model, based on a random forest classifier implemented in R18, estimated museum size from accreditation, governance, subject matter, region,
country, and geodemographic classification of the area. This model reaches 86% classification accuracy (with p < .001), leaving only 1.6% of museums with Unknown size, which we considered sufficient for the project’s research aims. The signal was particularly strong for small and large museums and slightly weaker for medium museums, which were double-checked manually by the project team. The Size Provenance attribute associated with each museum enables the user to ascertain whether the size information comes from recorded visitor information, is derived from other attributes, or manually set19.
3.3 Conceptual Modelling
Co-developinggraphical conceptual modelsfrom the outset of the project allowed us to gradually develop a
common understanding across the whole team of the schema of the KB. These models were initially hand-drawn diagrams on paper, whiteboards or powerpoint, and were subsequently modelled using the yED tool. The format of
18https://cran.r-project.org/web/packages/randomForest/randomForest.pdf
19Further details of the variability of the visitor numbers data and the derivation of the Museum Size attribute can be found in the Research
the core spreadsheet was kept “in synch” with this evolving conceptual model. Most of the graphical specification was automatically extracted from the metadata header of the core spreadsheet as described in Section3.2.
Also necessary was the design of a new Subject Matter taxonomy for the museums identified by the project team. The most recent taxonomy for classifying the overall theme of a museum (as opposed to artefacts or collections within a museum) was devised as part of DOMUS in 1994 and structured according to traditional academic disciplines. Although this system is still in use by the Museums Association, it does not encompass non-academic subject areas targeted by some newer, independent museums, nor does it provide sufficient detail for the project’s research purposes. A new taxonomy therefore had to be designed. Successive versions of the taxonomy were reviewed with domain experts and stakeholders external to the project20. This iterative design
process continued from month 6 to month 18 of the project, resulting in a new museum Subject Matter taxonomy that is itself a major research contribution of the MM project.
3.4 Developing the Knowledge Base
After fifteen months, the project team had gathered data on about 4000 museums. However, as described earlier, the process was incremental and we continued to add to the data as new museums were identified or missing items of information were found. We also refined our criteria for inclusion and exclusion, and some museums were deleted or added as the criteria for what constitutes a museum evolved. The conceptual model has also changed repeatedly, for example with the addition of historical data for visitor numbers and governance changes, and also the need to integrate our data with the Administrative Area hierarchy embedded within the ONS Postcode Lookup Dataset21so as to support geographical analysis of the museums data. To achieve this integration, and
also to support map-based visualisation of the data, we first needed to extend the conceptual model to capture the geographical coordinates (latitude/longitude) of each museum and to generate lat/long data for each museum. For museums that had accurately recorded Postal Codes, this was achieved by accessing the Postcode Lookup Dataset. Over 150 of the closed museums had deprecated postal codes and a manual investigation and data entry was needed for these in order to record a valid postcode.
Thus, the evolving KB has had to be flexible enough to encompass new or changed data, and to continue to do so as the sector changes or as new information is incorporated. We therefore opted to use semantic technologies to describe and store our data, specifically RDF and RDFS22. This data model allows us to describe in fine detail
the different relationships between entities and also allows easy extension with new subject-object-predicate triples as new data and knowledge accrue. We used the class, subclass, object property, data property, domain and range axioms of RDFS (it was not necessary to use a more expressive ontology language such as OWL). As new data was discovered and scheduled for inclusion into the KB, the number of columns, column names and data types of the core spreadsheet changed frequently, necessitating the creation of a new version of the KB every few weeks.
Due to the evolving nature of the conceptual model, and our observation that certain types of sub-models were recurring, we created an extensible set of data abstractions to help both the humanities scholars refine their evolving conceptualisation of the domain and the software developer to rapidly extend the current versions of the KB and Web App with the new conceptualisations and new data. A number of abstractions were incrementally identified: Lists, Hierarchies, Intervals and Events:
Listsare collections of values describing some property of a museum, e.g. the Size of a museum may be Huge,
Large, Medium, Small or Unknown. The list of values is populated directly from the data entries in the relevant spreadsheet column (and is thus automatically updated if the range of values needs to be changed).
20Members of all nine Museum Development Network groups; Dr Andrew Flinn, Reader in Archival Studies at the University of London; and
Stefan Dickers, head of Library and Archive at the Bishopsgate Institute.
Hierarchiesare tree-structured classifications that allow the expression of a taxonomy of values within the
data. Examples are the Governance and Subject Matter properties of a museum. The taxonomy is again built directly from the data entries appearing in the relevant spreadsheet column. For example the valueIndependent: English Heritagerepresents a path from the class Governance, to the subclass Independent and the sub-subclass
English Heritage; and the valueLeisure and sport:Fairgrounds and amusementsrepresents a path from the class
Subject Matter to the subclass Leisure and sport and the sub-subclass Fairgrounds and amusements.
Intervalsdescribe a date (a year in our case) where the exact year is unknown for a museum’s opening or
closing date. These too are populated from the entries appearing in the relevant spreadsheet column (expressed in the form of a pair of years x:y, e.g. 1977:1988).
Eventdata relates to historical information about museums’ changing visitor numbers and governance status.
This was collected from numerous sources including DOMUS, the Museums Association Find-A-Museum service, Arts Council England accreditation data, Association of Independent Museums, Visit Britain, and the National Audit Office. To model this information, a TemporalMeasurement class abstraction was created to hold sequences of from and to values, which uses the TemporalEntity class of the OWL Time Ontology23to record a time interval
and the Entity class of the PROV ontology24to record the provenance of each measurement.
We show below some metrics for the KB, separated into modules corresponding to the three input spreadsheets.
Core S/Sheet: Visitor numbers: Governance changes:
Classes 422 Classes 7 Classes 7
Properties 100 Properties 12 Properties 14 Individuals 769,496 Individuals 104,090 Individuals 568 Subclass axioms 295
3.5 Developing the Web Application
The Web App was developed in an evolutionary manner in parallel with the data collection, conceptual modelling, and creation of the KB. The humanities scholars’ initial research questions guided initial data modelling. We then embarked on co-design of a first version of data browsing and searching capabilities. It was evident that geospatial analysis of the museums data would be required, together the ability to show the locations of museums on a visual map. Further refinement of the research questions allowed specification, design and development of visualisation facilities to analyse and summarise the museums data in a variety of dimensions. This process resulted in a Web App that has three main facilities:
(1) Browse:Drill down into the museums data through properties such as Accreditation, Governance, Size,
Subject Matter, Location, Year opened and Year closed. View the resulting museums on a map of the UK, or in tabular form showing key properties, or on a museum-by-museum basis with full details for each museum.
(2) Search:Search the museums data by specifying one or more filter conditions and the properties to be
returned in the result set. View the resulting museums on a map, or in tabular form showing the selected properties, or on a museum-by-museum basis with full details for each museum.
(3) Visualise:View bar charts and line graphs to explore research questions on aspects of opening and closing
of museums over time, allowing drilling down into dimensions such as Accreditation, Governance, Size, Subject Matter and Location. Provide also heat maps allowing cross-tabulation of these dimensions over time.
For all three facilities, the GUI and user interaction were designed and refined by the whole project team produc-ing hand-drawn sketches on paper and whiteboards. For the Visualise facility, the computer scientists began by pre-senting the humanities scholars with palettes of possible charts and diagrams (e.g. github.com/d3/d3/wiki/Gallery, bl.ocks.org/) and the whole project team worked together to discuss and refine possible visualisations for the information that would be required to investigate the project’s evolving research questions. The development timeline of the Web App is summarised in Appendix A.
The frequent changes in the conceptual model, and hence in the schema of the KB, led to the decision to make the Web App metadata-driven so as to be able to keep up with these rapid changes. The RDFS template generation of Figure1extracts the values comprising each List and Hierarchy data abstraction, as well as the properties of museums required to be presented within the Browse, Search and Visualise GUIs, and these are stored within the KB. New data and schema changes automatically become available in the GUI (e.g correction of data about a museum, insertion of missing data items, addition of new data about a new museum, changes to the schema). The more complex temporal data and imported Admininistrative Area data require some further information in order to be fully supported within the Web App. This is achieved through a Python interface class containing methods for:
• displaying the appropriate name for the attribute in the GUI
• declaring the list of comparison operators for Search on the attribute
• implementing the HTML required for the user to enter values of that data type and the associated Javascript • generating SPARQL for a filter on that attribute
• generating SPARQL for a query on the attribute, calling the above method for filter construction • displaying values of this attribute returned from users’ queries.
Implementation classes are written to instantiate these methods for each type of data. This approach allows for easy extensibility of the application with new derived or imported data. For example, towards the end of Year 2, the project’s humanities scholars requested an additional property for each museum, “In Existence”, which is logically derived from the Year Open/Year Closed data and needed to be interrogated within Search in the same way as all other properties (see Online Appendix C). This was readily handled through building a new implementation class for the above interface.
Towards the end of the KB and Web App development process, the project’s humanities and GIScience scholars requested that the museums data be extended with additional information about the Deprivation Index25and
Area Classification26relating to the location of each museum. The integration of this data was accomplished in
less than a day of development time, by extending the pre-processing step on the core spreadsheet to encompass this data also, resulting in its expansion with three additional columns (Deprivation index, Geodemographic group, Geodemographic subgroup). We note that this data was not part of Version 0.1 which is the version of the system that we focus on here and that underwent the formative user evaluation described in Section5.
4 SYSTEM IMPLEMENTATION
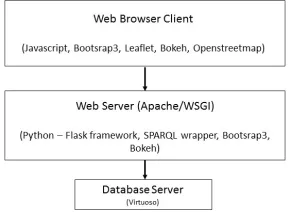
Figure2shows the architecture of our system. We see that it has a typical three-tier architecture comprising a Web Browser-based client served by a Web Server connecting to a Database Server. The Knowledge Base is implemented as a triple store, using Virtuoso, and supports a SPARQL end point for communicating with the Web Server. The web server, Apache/WSGI, uses the Python Flask27framework with Jinja template views28to 25https://www.gov.uk/government/statistics/english-indices-of-deprivation-2015,
https://gov.wales/statistics-and-research/welsh-index-multiple-deprivation/?lang=en, http://simd.scot/2016/, https://www.nisra.gov.uk/statistics/deprivation/northern-ireland-multiple-deprivation-measure-2017-nimdm2017
26https://www.ons.gov.uk/methodology/geography/geographicalproducts/areaclassifications/2011areaclassifications/datasets 27http://flask.pocoo.org/
Fig. 2. System Architecture.
deliver HTML/Javascript pages to the client. The pages are styled with Bootstrap29and CSS. Communication
with the database server is through the Python SPARQLWrapper library.
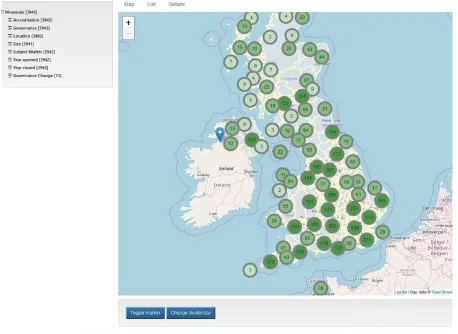
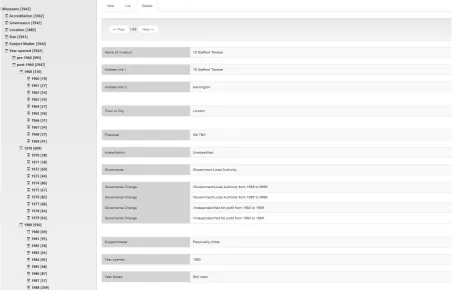
Design of the user interface was informed by Nielsen’s ten usability heuristics [22]. Users interact with the Web Application through the screen illustrated in Figure3, which provides a separate tab for the Browse, Search and Visualise facilities. The default entry screen shows a map of the UK displaying clusters of museums and the number of museums per cluster. The map can be zoomed into, so as to show finer-grained clusters and ultimately individual museums visualised as pins. It is also possible to toggle the view to directly display only individual museums. Clicking on a cluster also results in a zoom-in and display of the individual museums of the cluster. Hovering over a pin displays the name of the museum. Clicking on a pin shows a screen with full details of the data held about the museum (see Figure6).
Browse.The Browse facility allows users to navigate through the museums data in a structured way, through
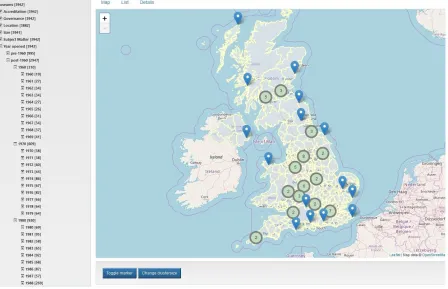
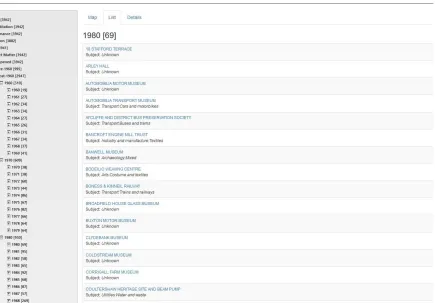
the categories of accreditation, governance, location, size, subject matter classification, year of opening and year of closing. For example, Figure4has drilled down through Year Opened into the 1980s decade and then into the specific year 1980, to select museums that opened in 1980. The results can be viewed in a map view, as in Figure4, or in a list view, as in Figure5. Users can select a specific museum to see full details of the data held about it, or page through all museums one at a time to see their details, as in Figure6.
In Browse, KB introspection (as discussed in Section3.4) is used to generate the left-hand side menu. The number of museum references accessible through this menu exceeds 40,000 and a CSS-based view provided the most efficient solution for navigating through the menu structure, also allowing for further growth (e.g. with the recent addition of Deprivation Index and Geodemographic data). Currently, just over 7MB of data is transferred to Browse upon loading the Browse page. To keep the GUI responsive, a few attribute values are loaded for all museums (name, lat/long, subject matter) and only when switching to the Details view does the browser request the full data for the selected museum from the server.
Search.The Search facility allows users to set up their own queries, over a broad range of attributes of
museums. Users specify one or more filters that can be combined to create more complex search criteria. Each filter is of the formAttribute Operator Valueand a range of operators are supported for each data type (xsd data
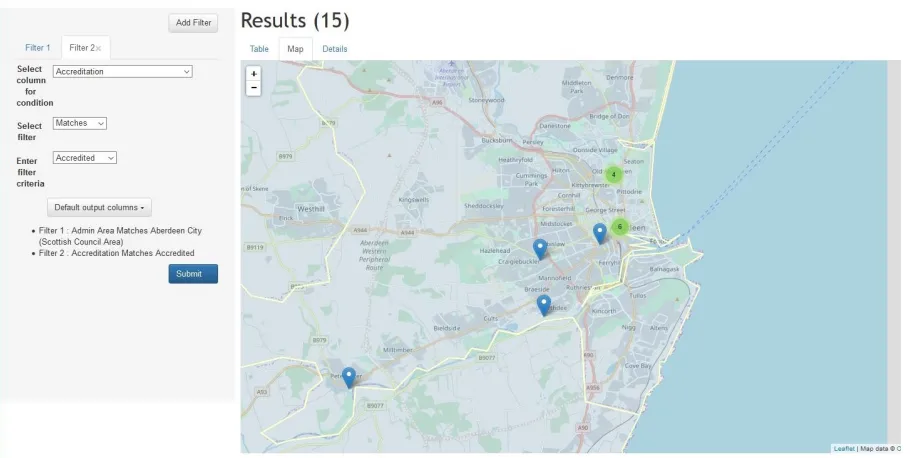
type or abstract data type). The museums’ attributes to be returned in the results can also be specified by the user. Figure7shows a completed query, with two filters (Admin Area Matches Aberdeen and Accreditation Matches Accredited). The results of a query can again be viewed in a list as in that figure, on a map as in Figure8, or in detail for each museum (Figure6).
Fig. 3. Web Application entry screen.
In Search, text entry and selection from drop-down menus are supported for the various attributes, and KB introspection allows the correct widgets and operators to be displayed in the GUI. The filters constructed by the user are combined into a conjunction of clauses within a SPARQL query while the output attributes selected are mapped to variables in the query’s SELECT clause. The most complex SPARQL queries generated by Search relate to the handling of dates and their extensive range of operators, listed in online Appendix B. The awesomplete30
JavaScript library is used to provide autocompletion of Admin Area names. Due to the size of the Admin Area hierarchy, the web server runs a Flask API service that incrementally loads as needed sub-trees of that hierarchy. The Map view supported in Browse and Search has been developed using the Leaflet31Javascript library together
with the MarkerCluster32plug-in to create the clusters. The maps themselves are dynamically loaded using the
Openstreetmap service33. 30https://leaverou.github.io/awesomplete 31https://leafletjs.com/
Fig. 4. Browsing into the Year Opened category, Map View.
Visualise.The Visualise facility supports a range of bar charts and line graphs relating to museum openings
and closings, allowing the user to drill down into dimensions such as governance, subject matter, size and location. For example, Figure9shows the number of museums that were open in 2017 broken down by subject matter classification. The temporal slider at the bottom of the graph allows the user to dynamically change the selected year. Figure10shows the number of museums opening in each year from 1960 to 2018, and Figure11shows the same information broken down by governance. Similar graphs are supported for museum closures. Figure12
shows a comparison of openings and closings on one graph. In all cases, zoom-in facilities are supported to aid the user when a chart or graph becomes too dense.
Also supported are heatmaps for cross-tabulating selected pairs of categories, e.g. Subject Matter versus Location to see in which parts of the country different types of museums occur most frequently. Figure13
Fig. 5. Browsing into the Year Opened category, List View.
For the Visualise facility, the Bokeh34library is used to produce the line graphs, bar charts and heatmaps for
delivery from the server to the client. Again, as with Browse and Search, KB introspection allows extensible handling of both xsd and abstract data types. For the heatmaps, the large number of possible cross-tabulation combinations was handled by routing the selected X,Y combination to the web server, which in turn constructs a method call invoking the correct object for constructing the page content (again, this is a dynamically extensible capability, allowing new categories to be added to the X,Y options for the user).
Opening/Closing dates.A final point of note is that museum opening and closing dates that comprise an
interval of the form [earliest possible year, latest possible year] - as opposed to a single known year - are handled differently in the Browse, Search and Visualise facilities in order to meet the overview, search, and analysis requirements, respectively, of the humanities researchers. In Browse, museums’ opening and closing dates are regarded as occurring at the mid-point of the specified interval. Search provides a more nuanced approach, supporting both Definitely and Possibly modalities for all of the date comparison operators (the full list of operators supported is shown in Online Appendix B). For example, if a user searches for museums thatdefinitely
opened between 1975 and 1980 then she will see results for those museums whose Year Open date (be it a single year or an interval) falls within the interval [1975,1980]; whereas if she searches for museums thatpossibly
Fig. 6. Museum Details View.
opened between 1975 and 1980 then she will see results for those museums whose Year Open date (be it a single year or an interval) has a non-empty intersection with the interval [1975,1980]. In Visualise, the probability of an opening/closing event occurrence is apportioned equally over the years comprising the interval. For example, if a museum is known to have opened in the interval [1965,1969], then the count of one museum opening is divided over those five years (i.e. a count of 0.2 is assigned to each of 1965, 1966, 1967, 1968, 1969). The same approach is adopted for museums with longer date ranges and for date ranges relating to closure.
Summary.Overall, the Web Application comprises some 28000 lines of Python code, 25000 lines of Javascript,
numerous HTML pages, and additional configuration files. It has been kept simple with a stateless approach free from sessions and cookies. Browse, Search and Visualise all have initialisation utilities to construct their menus on first invocation, using introspection into the KB as described earlier. This takes a few seconds (unless the data has changed since the last usage, in which case initialisation takes around 4 minutes). Due to the rapid prototyping process adopted for developing the KB and Web App, it was necessary to be able to quickly show new versions of them to project members, for validation, correction and extension. We used the Fabric35Python-based
deployment language to deploy multiple versions of code and data in parallel, allowing the project members to explore and assess their differences, and come to decisions about next steps of the development process.
Fig. 7. A completed Search query and its results, in List View.
Version 0.2 of the source code and documentation are available at github.com/nickatbbkdcs/MappingMuseums The final version of the Wep App code, and a download of the finalised KB in the form of Linked Open Data will be available from the project Web Site in late 2019.
The museums data will continue to be updated and extended up to the end of the project in December 2020. To enable this, we are developing a new web service to allow the capture of data updates relating to existing museums and also the insertion of data about new museums. There are separate forms for public upload of such data (thus supporting a form of crowd sourcing) and for validation/correction/rejection of data by the project’s domain experts before upload to the KB.
5 USER EVALUATION
Fig. 8. A completed Search query and its results, in Map View.
5.1 User Study Design
We recruited 15 volunteer participants via our network of professional contacts working in the UK museums sector, including a Museum Consultant, a Digital Archivist, several Museum Accreditation assessors, Museum Development Network officers, Cultural Heritage experts, and staff from AIM and ACE. None of these people had had any involvement in the design of the system.
We held three identically structured sessions each attended by a subset of the full set of participants. Other than very minor user interface changes, the same version of the system was used for each session (Version 0.1). Prior to each session, participants were sent information describing the aims and format of the session. They were also sent the URL of the project blog so as to be able to gain some background into the aims of the project. Online Appendix D lists the activities that participants were asked to undertake individually during the session. They were asked to undertake two tasks using Browse, two using Search and three using Visualise, to record their answers, and to answer a small set of questions regarding ease-of-use of the system. They were invited to add further comments if they wished. At the end of the seven tasks, participants were invited to answer a set of more general questions about the usability and usefulness of the system. Online Appendix D shows the number of participants’ answers falling into each answer category for each of the questions within the activity sheet, as well as additional comments that some of them provided about the usability and usefulness of the system.
Fig. 9. Number of museums open in 2017, by subject matter classification.
5.2 Discussion of results
Participants’ perceptions of the seven tasks and the accuracy of their answers are summarised in the table below: Task very easy mixed difficult very no correct partially incorrect no
easy feelings difficult comment answer correct answer answer
1 60% 36% 4% 93% 7%
2 64% 36% 93% 7%
3 27% 27% 30% 7% 10% 90% 10%
4 27% 37% 23% 10% 3% 88% 7% 5%
5 31% 44% 18% 2% 4% 80% 7% 13%
6 13% 24% 47% 2% 13% 87% 4% 9%
7 18% 31% 31% 20% 80% 7% 13%
Fig. 10. Number of museums opening over time.
and to the extensive concept taxonomy that is encapsulated in the Browse left-hand side menu. The percentage of fully correct answers for these tasks was 93%. Comments provided by the participants did not identify any fundamental sources of difficulty, pointing mainly to usability issues such as the font size of the left-hand-side menu entries, the need for the user to be able to see their trail of selections through these menus, window scrolling and zooming issues, and the requirement for online Help for finer details of the system’s terminology and user interface. A small number of data errors were also identified. These issues are being addressed for the final version of the system.
Fig. 11. Number of museums opening over time, by governance.
6 and 31% in Task 7. We conjecture that these responses reflect the relative difficulty of each of these tasks. None the less, the high level of overall correct answers to these tasks affirms the effectiveness of the Visualise facility. In addition to usability issues such as text placement and improving the scrolling functionality, comments provided by the participants pointed to one significant area of difficulty, namely understanding the terms appearing in the left-hand menu (which lists the different types of graphs and charts available). This feedback has led us to develop a new Help page as the home page for the Visualise facility, which describes each of the available graphs and charts and the information that they show.
Overall, participants’ levels of accuracy as they undertook the Browse, Search and Visualise tasks fell. This is understandable on a first exposure to the system, given the increasing levels of functionality and sophistication of these three facilities.
Fig. 12. Number of museum openings and closings over time.
Question very easy mixed difficult very not easy feelings difficult answered Navigating through the left-hand side menus is 33% 33% 33%
Accuracy of the descriptions on screen is 33% 60% 7%
Knowing what to do next is 7% 53% 33% 7%
Understanding the search results is 7% 53% 33% 7% The response time of the system is 53% 47%
Fig. 13. Heatmap of Subject Matter vs Governance.
The sixth and seventh questions in the General Questions section related to participants’ perceptions of the usefulness of the system, firstly for themselves in their own role (sixth question) and secondly more broadly for other people or institutions (seventh question). For the sixth question there were 12 responses of ‘Very Useful’ or ‘Useful, and for the seventh 13 responses of ‘Very Useful’ or ‘Useful’. These responses point to the positive evaluation of the system by the majority of the study participants and its potential usefulness to a range of stakeholders. The textual comments provided by participants to the sixth and seventh questions give specific views on how the system could be used. For example:
“It would be useful to understand all museums in one area and look at accreditation status. Additionally helpful to understand dates of closure” [Cultural Heritage expert]
“understanding where to target cluster locations for training etc. E.g. if high concentration of unaccredited museums could target ‘recruitment’ drive” [Museum Accreditation Manager]
“Baseline for understanding what museums are open in research of historic loans, merged collections and ac-creditation status ... useful to know who are considered National and Accredited for potential loans/collaborations/ disposals ... could hugely support future collections management” [Cultural Heritage expert]
“Museums would like to find other museums like them and see patterns of their development over time” [Regional Museum Development Officer]
“useful to anyone wanting to understand the museum sector as this is the closest we’ve ever had to getting a full picture of it” [Senior Manager in non-governmental museum organisation].
The group discussions held at the end of each evaluation session generally repeated and reinforced the individual comments recorded within the activity sheets, as well as suggesting some further visual and interaction improvements to the user interface which we have subsequently made. Comments made during the group discussions include: “It’s easy to use, intuitive to use”, “It’s the Museum equivalent of YouTube, could lose whole evenings on it”, “Staggered by how rich the data is”, “Really interesting in terms of trends in subject matter”, “It’d be good for helping to build networks between museums. They’d begin to see where similar or complementary expertise was located”, “Could begin to build expertise around subject network groups. Often they don’t know about all the museums in their remits”, “Good that it’s not organised around county borders so you can get information on museums that are near your patch but not in it”, ”It would be very useful in advocacy when writing reports about state of play in a given area. Gives you the tools to say ‘look, it was once this but now it’s this’“, “Would be great to have more information on what happens to collections when museums close. Would be a story of survival rather than failure (.ie. the collections get passed on)”. “Very useful for AIM in terms of potential members” [AIM staff member]. “Hugely useful for the ACE” [ACE staff member]. “Great to see the whole of the UK covered. That’s really crucial to my role” [Museum Accreditation Manager]. “Would be useful for accreditation team because we could identify clusters of unaccredited museums and target them - and hold sessions in those areas” [Museum accreditation manager]. “Would be useful when you’re talking to an individual museum, because you could identify like organisations and put them in touch” [Museum Development Officer]. “I needed to know the total number of museums in London recently and couldn’t find it out. This would tell you”
[ACE staff member].
Finally, one participant commented on the speed of development of the system and characterised it as being “amazing” starting from the hard-copy fragments of the core spreadsheet she had viewed less than a year before.
6 CONCLUSIONS
The Mapping Museums project aims to provide the first evidence-based history of the foundation, character and development of the museums sector between 1960 and 2020. As such, it aims to contribute to scholarly understanding of British culture, to inform policy makers, and ultimately to also be of interest to the general public. The MM project is the first to produce an authoritative database of UK museums opening and closing during a period of rapid expansion and change in the sector, covering more than double the number of venues of any previous study.
Web App. Our implementation methods encompassed semantic technologies (specifically, RDF/S) to develop the KB, and metadata-driven software design, data abstraction and software introspection to develop the Web App. An evaluation study was undertaken with 15 independent domain experts from the UK museums sector. A key outcome of the study was an overall endorsement of the system. The usefulness of the system, beyond its primary aim of supporting the historical research objectives of MM project, was highlighted by researchers, consultants, accreditation officers and museums development officers. The study was also useful in identifying areas of further improvement of the user interface and the feedback received is being used to finalise the Browse, Search and Visualise facilities towards version 1.0 of the system. Another interesting outcome was identification of several potential new applications of the system, beyond the historical research objectives of the MM project, in areas such as fostering networking between similar museums, setting regional development strategy, and targeting training for museum professionals.
The development and use of the KB and Web App has already led to insights about periods and regions showing high numbers of museum openings or closings, changes in museums’ accreditation and governance status over the past 60 years, and popular subject areas. There will now be two more years of detailed research funded by the MM project, both qualitative and quantitative, which will build on the first phase of research made possible through the development of the KB and Web App described here. Quantitative research is being conducted to establish correlations between high rates of openings or closings of museums and attributes such as accreditation, governance, location, size, and subject matter, and combinations thereof. The new attributes Geodemographic Group/Subgroup and Deprivation Index are enabling new analyses into the demographic context of museums’ openings/closings, including cross-correlation of these aspects with the other museum attributes, and hence the charting of new geographies of museums. Qualitative research is initially concentrating on the Scottish Highlands and Cornwall (regions that have seen the highest numbers of new independent museums opening) and on the East Midlands (which has seen the highest percentage growth since 1960). The project team is also examining independent museums devoted to local history, war and conflict, and transport, as these are subject areas showing some of the greatest increases in museum numbers. The qualitative research is comprising interviews at selected museums and with experts in cognate areas, and also archival research on the funding, policy, tourism and economic context of the selected locations and subject areas.
The KB development and Web App development will cease at the end of 2019 at which point they will be made publicly accessible free of charge to all users through the Mapping Museums project website36. Through
the provision of the new data upload and incremental data insertion/update pipeline (discussed at the end of Section4) the KB has the potential to continue being extended and improved through community efforts. The project website will include links to final versions of the Web App software (Version 0.2 is already freely available under Gnu General Public Licence). The KB will also be published and freely available as Linked Open Data. Moreover, since our data contains extensive hitherto unknown information on small museums, a hard copy will also be archived in the Micromuseums Archive at the Bishopsgate Institute37.
The MM project team itself has learned much from our collaboration on developing the KB and Web App described here. The computer scientists and GIScience experts were challenged by the detailed data and nuanced concepts of the humanities scholars’ evolving knowledge and understanding which needed to be captured within the KB and Web App; while the humanities scholars gained greater understanding of the techniques involved in data modelling, integration and cleansing, the role of conceptual modelling in designing specialist knowledge bases, and were prompted to devise new, more precise classificatory systems for their subject areas.
The Mapping Museums Knowledge Base is rigorously researched and has a high level of coverage and coherence. It has been designed specifically to support the historical research aims of the Mapping Museums project and so,