Munich Personal RePEc Archive
The relationship between export status
and productivity in services: A firm-level
analysis for Spain
Minondo, Asier
Deusto Business School, University of Deusto
December 2012
Online at
https://mpra.ub.uni-muenchen.de/43225/
1
The relationship between export status and productivity in services:
A firm-level analysis for Spain
Asier Minondo (Deusto Business School)
Camino de Mundaiz, 50; 20012 San Sebastián, Spain. Tel. :+34 943 326600 E-mail: [email protected]
Abstract
This paper analyzes the relationship between export status and productivity in a major service exporter, Spain, during 2001-2007. I find that exporters in the services sector are 37% more productive than non-exporters. This productivity premium is larger for firms that supply non-Internet-related services than for firms that supply Internet-related services. The results show that exporters were more productive than non-exporters before beginning to export. The results also show that exporting increases productivity growth; however, this positive shock vanishes quickly.
JEL Codes: F14, F19, F23
Keywords: exports, services, firm-level evidence, Spain, productivity.
2
1. Introduction
In 2009, services accounted for 75% of GDP in high-income countries and
50% of GDP in low- and medium-income countries (World Development
Indicators). Due to their large and growing share of GDP, growth in the world
economy will be increasingly linked to productivity growth in services. In this paper,
I analyze whether international trade can contribute to this process.
Studies based on manufacturing firms have shown that exporters are more
productive than non-exporters (Bernard et al., 2007). This positive relationship can
be explained by a self-selection process, in which only the most productive firms are
able to overcome the extra barriers of selling in foreign markets and still obtain
profits. Alternatively, this relationship can be explained by a learning-by-exporting
process, in which firms increase their productivity due to their participation in
foreign markets. If self-selection is prevalent, aggregate productivity can be
enhanced through policies, such as trade liberalization, that provoke a shift of
resources from less productive firms to more productive firms. If firms learn from
exporting, aggregate productivity can be enhanced if policies facilitate the entry of
new firms into foreign markets.
Can we also expect a relationship between export status and productivity in
services? From the self-selection perspective, the traditional view among scholars is
that services firms face much larger barriers to trade than manufacturers because they
require the coincidence of suppliers and customers in space and time (Francois and
Hoekman, 2010). Due to these large barriers to trade, it is reasonable to expect a
strong link between export status and productivity for firms operating in services.
3 movement of the supplier is inherent to the activity, such as transport services, and
for firms that supply their services through the Internet (e.g., call-centers) or whose
final output can be digitalized and transferred through the Internet (e.g., a machine
design or an electronic book). Regarding the learning by exporting hypothesis, I
expect that higher competition and interaction with new suppliers and customers
should also contribute to productivity growth in services firms.
Some empirical studies that have analyzed the relationship between
productivity and export status for services firms, such as Breinlich and Criscuolo
(2011), find that service exporters in the UK are more productive than non-exporters.
However, these authors do not analyze whether this link is due to a process of
self-selection or to a process of learning by exporting. Vogel (2011) also finds a link
between productivity and export status for large firms in three business services
industries in Germany and presents evidence supporting the self-selection process.
However, he does not analyze the role of learning by exporting.
The contribution of this paper is that it enhances the limited evidence on the
relationship between export status and productivity in the services sector using
firm-level data from Spain, the world's seventh-largest exporter of services in 2009.1 I
examine whether exporters in the services sector are more productive than
non-exporters and whether this productivity premium is due to self-selection or to
learning by exporting. I also test whether the productivity premium is similar for
Internet-related services, non-Internet-related services and transport services.
The paper is organized as follows. The next section presents the database and
provides some descriptive analyses. Section 3 analyzes the relationship between
1
4 export status and productivity and evaluates the self-selection and
leaning-by-exporting hypotheses. Section 4 concludes.
2. Database
We draw our data from the Annual Survey of Services (ASOS) conducted by
the Spanish Statistical Institute (INE). We divide firms into three groups:
Internet-related services, non-Internet-Internet-related services, and transport services. Following
Freund and Weinhold (2002), the first group includes services that can be transferred
electronically: computer and related activities, research and development, and
business services. The second group includes accommodations and restaurants, real
estate activities, rentals of machinery and equipment, recreational, cultural, and
sporting activities, and other personal service activities. The third group includes all
transport activities. The ASOS does not survey firms engaged in financial
intermediation, public administration and defense, or education and social work.
Firms with ten or more employees receive a broader ASOS questionnaire in
which they are asked to distribute their sales between the domestic market and
foreign markets. We use this information to identify exporters. The period of analysis
is 2001-2007. The average number of firms included in the sample per year is
approximately 17,000. Because firms with less than 10 workers are excluded, the
coverage of the sample is low in terms of establishment (1.3%) but large in terms of
employment and exports (52% and 31%, respectively).2 Because ASOS does not
provide data on capital, we can only calculate labor productivity. It is important to
emphasize that the survey does not specify whether firms export services,
2
5 manufactured goods or both. However, as previous studies have shown, if the
wholesale industry is excluded, exporters in the services sector mostly export
services (Haller et al., 2012).
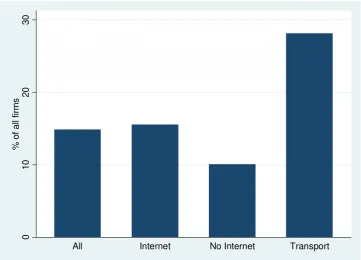
As shown in Figure 1, exporters constitute a small percentage (14.9%) of all
firms. This percentage is much lower than that for manufacturers. Drawing on data
from the Survey of Firms' Strategies (Encuesta de Estrategias Empresariales), Campa
(2004) and Mañez et al. (2004) document a percentage of exporters of approximately
60%. This higher percentage suggests that exporters in manufacturing face lower
barriers to trade than firms in the services sector.
Transport is the industry with the highest share of exporters, at 28%. The
share of exporters in Internet-related services (16%) is larger than the share of
exporters in non-Internet-related services (10%). These figures suggest that firms that
supply non-Internet-related services face larger barriers to export than firms that
supply Internet-related and transport services.
3. The relationship between productivity and export status
To test the relationship between productivity and export status, I estimate a
descriptive regression. The dependent variable is the log value of labor productivity.
The set of independent variables includes controls for size, industry and time and a
dummy variable that captures the export status of the firm. A firm is considered an
exporter if it exports during at least two consecutive years and becomes a regular
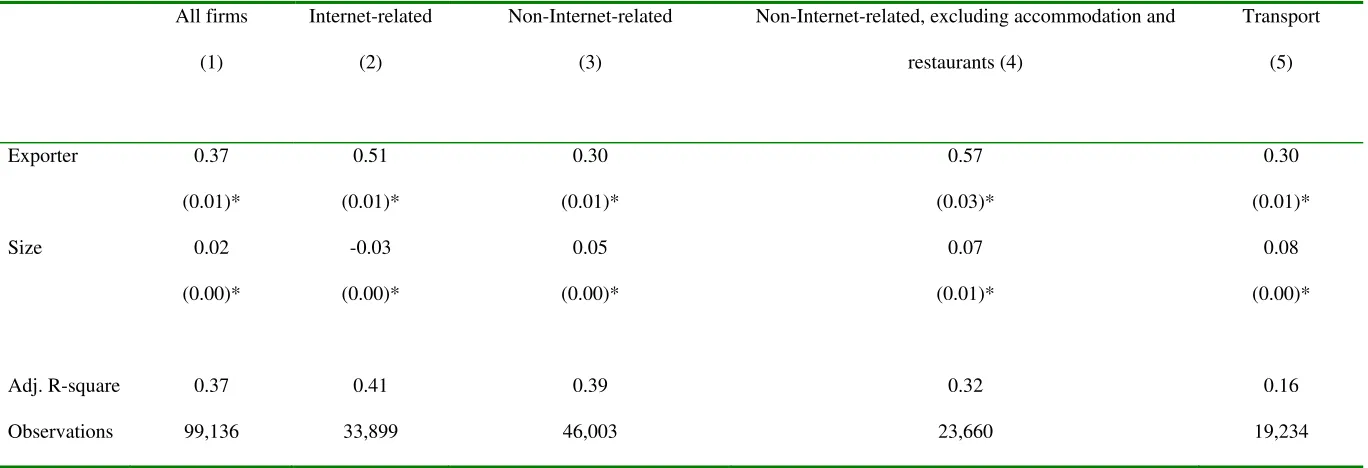
6 As shown in Table 1, exporters are 37% more productive than non-exporters.
This premium is larger than the one found for exporters in the manufacturing sector
in Spain of 17% (Fariñas and Martínez-Marco, 2007). This result suggests that
barriers to export are larger for firms in the services sector than for firms in the
manufacturing sector.
Contrary to expectations, I find that exporters' productivity premium in
non-related services is lower than exporters' productivity premium in
Internet-related services (30% vs. 51%, respectively) and is similar to exporters' productivity
premium in transport industries (30%). This strange result can be explained by the
accommodation and restaurant industries. Some accommodations and restaurants can
be considered passive exporters because they receive foreign guests without
engaging large marketing efforts abroad. In these situations, being an exporter does
not require a productivity premium. In fact, as shown in Column 4, when we remove
accommodation and restaurant industries from the non-Internet-related services
group, the productivity premium rises to 57%. This figure is slightly larger than the
premium in Internet-related services and is much larger than the premium in
transport industries. However, the small difference between Internet-related services
and non-Internet-related services suggests that the latter group, despite having a
lower proximity burden, may face other barriers to trade. On this point, Borchert et
al. (2012) find that professional services, which are included in the Internet-related
services group, are among the most protected industries in developed and developing
countries.
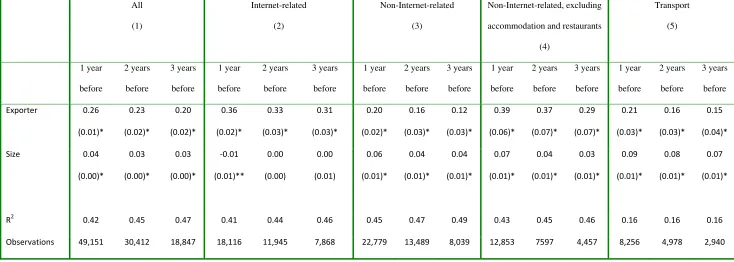
In the second part of this section, I analyze whether exporters' productivity
premium is due to ex-ante differences or ex-post differences. If self-selection
7 productivity between future export starters and non-exporters several years before
some of them begin to export. Table 2 presents the differences in labor productivity
between non-exporters and export starters three years before beginning to export,
two years before beginning to export, and one year before beginning to export. As
shown in the table, export starters were already more productive than non-exporters
before beginning to export, validating the self-selection hypothesis. Moreover, the
table shows that the productivity premium rises as firms approach the entry year,
suggesting that firms may prepare to export (López, 2009). I do not find statistically
significant differences in productivity between Internet-related services and
non-Internet-related services, excluding accommodations and restaurants.
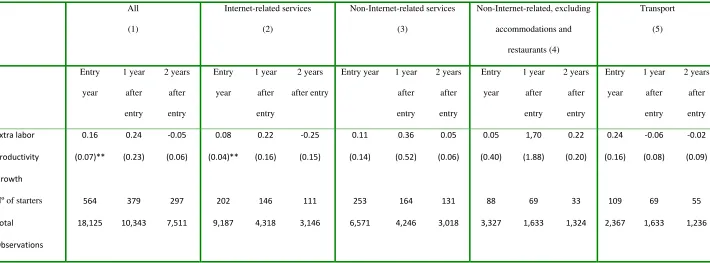
Finally, I analyze whether firms in the services sector learn from exporting.
Following Wagner (2002), I compare productivity growth between export starters
and a matched group of non-exporters.3 As shown in Table 3, the difference in
productivity growth between export starters and non-exporters is only significant at
the entry year and becomes non-significant in the following years.4 This result is
consistent with models in which higher revenues due to exporting allow firms to
introduce new technologies, leading to a jump in the productivity level at the entry
year (Bustos, 2011).
3
To match export starters and non-exporters, we use data on size, labor productivity, 4-digit industry and time.
4
8
4. Conclusions
This paper analyzes the relationship between productivity and export status
for firms operating in the services sector. Using a sample of Spanish firms during the
period of 2001-2007, we find that exporters in the services sector are 37% more
productive than non-exporters. This productivity premium is larger than the one
found for firms in the manufacturing sector. My results show that exporters in
non-Internet-related services, excluding accommodations and restaurants, have a slightly
larger productivity premium than exporters in Internet-related services. I also find
that exporters in the services sector were more productive than non-exporters before
beginning to export, confirming the self-selection hypothesis. The results show that
productivity grows at a greater pace among exporters than among non-exporters;
however, this difference is only significant at the entry year.
These findings indicate that trade liberalization, which provokes a shift of
resources from less productive firms to more productive firms, can contribute to
increased productivity in the services sector. Because there is also a positive
productivity shock when beginning to export, policies facilitating the entry of new
firms into foreign markets may contribute to increased productivity in the services
sector.
References
Bernard, A.B., Jensen, J.B., Redding, S.J. and Schott, P.K. (2007). “Firms in International Trade”, Journal of Economic Perspectives, 21, 3, 105-130.
9 Breinlich, H. and Criscuolo, C. (2011). "International trade in services: A portrait of importers and exporters", Journal of International Economics, 84, 2, 188-206.
Bustos, P. (2011). "Trade Liberalization, Exports, and Technology Upgrading: Evidence on the Impact of MERCOSUR on Argentinean Firms", American Economic Review, 101, 1, 304-340.
Campa, J.M. (2004). "Exchange rate and trade: How important is hysteresis in trade?", European Economic Review, 48, 3, 527-548.
Fariñas, J.C. and Martín-Marcos, A. (2007). "Exporting and Economic Performance: Firm-Level Evidence of Spanish Manufacturing", The World Economy, 30, 4, 618-646.
Francois, J. and Hoekman, B. (2010). "Services Trade and Policy", Journal of Economic Literature, 48, 3, 642-692.
Freund, C. and Weinhold, D. (2002). "The Internet and International Trade in Services", American Economic Review, 92, 2, 236-240.
Haller, S.A., Damijan, J., Kaitila, V., Kostevc, C., Maliranta, M., Milet, E., Mirza, D. and Rojec, M. (2012). "A Portrait of Trading Firms in the Services Sectors. Comparable Evidence from Four EU Countries", ETLA Working Paper No 1283.
López, R. (2009). "Do Firms Increase Productivity in Order to Become Exporters?",
Oxford Bulletin of Economics and Statistics, 71, 5, 621-642.
Mañez, J.A., Rochina, M.E. and Sanchis, J.A. (2004). "The decision to export: a panel data analysis for Spanish manufacuring", Applied Economic Letters, 11, 11, 669-673.
Vogel, A. (2011). "Export Performance in the German Business Service Sector", The
Service Industries Journal, 31, 7, 1015-1031.
10 Figure 1. Share of exporters in services, 2007
Note: Percentages are weighted by sample to population elevation factors.
0
10
20
30
% o
f
a
ll
fi
rm
s
11 Table 1. Productivity and export status. Descriptive regressions.
All firms
(1)
Internet-related
(2)
Non-Internet-related
(3)
Non-Internet-related, excluding accommodation and
restaurants (4)
Transport
(5)
Exporter 0.37
(0.01)*
0.51
(0.01)*
0.30
(0.01)*
0.57
(0.03)*
0.30
(0.01)*
Size 0.02
(0.00)*
-0.03
(0.00)*
0.05
(0.00)*
0.07
(0.01)*
0.08
(0.00)*
Adj. R-square 0.37 0.41 0.39 0.32 0.16
Observations 99,136 33,899 46,003 23,660 19,234
12 Table 2. Self-selection. Exporters' labor productivity premium before beginning to export.
All (1) Internet-related (2) Non-Internet-related (3) Non-Internet-related, excluding
accommodation and restaurants
(4)
Transport
(5)
1 year
before 2 years before 3 years before 1 year before 2 years before 3 years before 1 year before 2 years before 3 years before 1 year before 2 years before 3 years before 1 year before 2 years before 3 years before
Exporter 0.26
(0.01)* 0.23 (0.02)* 0.20 (0.02)* 0.36 (0.02)* 0.33 (0.03)* 0.31 (0.03)* 0.20 (0.02)* 0.16 (0.03)* 0.12 (0.03)* 0.39 (0.06)* 0.37 (0.07)* 0.29 (0.07)* 0.21 (0.03)* 0.16 (0.03)* 0.15 (0.04)* Size 0.04 (0.00)* 0.03 (0.00)* 0.03 (0.00)*
‐0.01
(0.01)** 0.00 (0.00) 0.00 (0.01) 0.06 (0.01)* 0.04 (0.01)* 0.04 (0.01)* 0.07 (0.01)* 0.04 (0.01)* 0.03 (0.01)* 0.09 (0.01)* 0.08 (0.01)* 0.07 (0.01)*
R2 0.42 0.45 0.47 0.41 0.44 0.46 0.45 0.47 0.49 0.43 0.45 0.46 0.16 0.16 0.16
Observations 49,151 30,412 18,847 18,116 11,945 7,868 22,779 13,489 8,039 12,853 7597 4,457 8,256 4,978 2,940
13 Table 3. Learning by exporting. Difference in labor productivity growth between export starters and matched non-starters.
All (1) Internet-related services (2) Non-Internet-related services (3) Non-Internet-related, excluding accommodations and restaurants (4) Transport (5) Entry year 1 year after entry 2 years after entry Entry year 1 year after entry 2 years after entry
Entry year 1 year
after entry 2 years after entry Entry year 1 year after entry 2 years after entry Entry year 1 year after entry 2 years after entry
Extra labor
Productivity Growth 0.16 (0.07)** 0.24 (0.23)
‐0.05
(0.06)
0.08
(0.04)**
0.22
(0.16)
‐0.25
(0.15) 0.11 (0.14) 0.36 (0.52) 0.05 (0.06) 0.05 (0.40) 1,70 (1.88) 0.22 (0.20) 0.24 (0.16)
‐0.06
(0.08)
‐0.02
(0.09)
Nº of starters 564 379 297 202 146 111 253 164 131 88 69 33 109 69 55
Total
Observations
18,125 10,343 7,511 9,187 4,318 3,146 6,571 4,246 3,018 3,327 1,633 1,324 2,367 1,633 1,236