comm
en
t
re
v
ie
w
s
re
ports
de
p
o
si
te
d r
e
se
a
rch
refer
e
e
d
re
sear
ch
interacti
o
ns
inf
o
rmation
Systematic quantification of gene interactions by phenotypic array
analysis
John L Hartman IV and Nicholas P Tippery
Address: Fred Hutchinson Cancer Research Center, 1100 Fairview Avenue North, Seattle, WA 98109, USA.
Correspondence: John L Hartman. E-mail: [email protected]
© 2004 Hartmanand Tippery; licensee BioMed Central Ltd. This is an Open Access article: verbatim copying and redistribution of this article are permitted in all media for any purpose, provided this notice is preserved along with the article's original URL.
Systematic quantification of gene interactions by phenotypic array analysis
<p>A phenotypic array method, developed for quantifying cell growth, was applied to the haploid and homozygous diploid yeast deletion strain sets. A growth index was developed to screen for non-additive interacting effects between gene deletion and induced perturbations. From a genome screen for hydroxyurea (HU) chemical-genetic interactions, 298 haploid deletion strains were selected for further analysis. The strength of interactions was quantified using a wide range of HU concentrations affecting reference strain growth. The selectivity of interaction was determined by comparison with drugs targeting other cellular processes. Bio-modules were defined as gene clusters with shared strength and selectivity of interaction profiles. The functions and connectivity of modules involved in processes such as DNA repair, protein secretion and metabolic control were inferred from their respective gene composition. The work provides an example of, and a gen-eral experimental framework for, quantitative analysis of gene interaction networks that buffer cell growth.</p>
Abstract
A phenotypic array method, developed for quantifying cell growth, was applied to the haploid and homozygous diploid yeast deletion strain sets. A growth index was developed to screen for non-additive interacting effects between gene deletion and induced perturbations. From a genome screen for hydroxyurea (HU) chemical-genetic interactions, 298 haploid deletion strains were selected for further analysis. The strength of interactions was quantified using a wide range of HU concentrations affecting reference strain growth. The selectivity of interaction was determined by comparison with drugs targeting other cellular processes. Bio-modules were defined as gene clusters with shared strength and selectivity of interaction profiles. The functions and connectivity of modules involved in processes such as DNA repair, protein secretion and metabolic control were inferred from their respective gene composition. The work provides an example of, and a general experimental framework for, quantitative analysis of gene interaction networks that buffer cell growth.
Background
The contributions of genes to phenotypic traits are modified by interactions with other genes and the environment, result-ing in heterogeneity of monogenic disease traits and the unpredictable penetrance of complex disease [1,2]. Statistical genetic methods, used for detecting gene-phenotype associa-tions in natural outbred populaassocia-tions, are not powerful enough to detect interacting effects due to the combinatorial complexity of genetic and environmental variations [3,4]. In contrast, experimental genetic methods relying on inbred genetic backgrounds and controlled environments have found phenotypic enhancement and suppression to be ubiq-uitous [5-7]. However, the dependence of interactions upon genetic background and environmental conditions is usually de-emphasized, resulting in a bias toward biological oversim-plification [5,8,9]. The primary aim of this work is to formal-ize an experimental framework for global analysis of phenotype modification through quantification of gene interactions.
Genome sequencing has enabled the study of all genes in par-allel, enabling systems biology and an integrated experimen-tal understanding of all gene functions [10]. It is hoped that the outcome will be more detailed knowledge about the com-plex genetics of natural phenotypes, such as human diseases. This vision is partially embodied by a concept - 'genetic archi-tecture' - referring to the full range of effects that modify genetic traits [3]. Understanding genetic architecture will require more systematic, comprehensive and quantitative knowledge about how phenotypic stability is influenced by interacting genetic and environmental variations (Figure 1). Experimentally derived principles of gene interaction, such as how gene-interaction networks function to buffer phenotypic changes against genetic and environmental perturbations, may guide hypotheses about natural phenotypic variation [5,6,11,12].
Given the respective goals and limitations of studying inbred and outbred genetic systems, molecular and population Published: 29 June 2004
Genome Biology 2004, 5:R49
Received: 2 April 2004 Revised: 12 May 2004 Accepted: 19 May 2004 The electronic version of this article is the complete one and can be
geneticists think about gene interaction differently [4,9,13-16]. Our work defines interaction quantitatively as 'non-addi-tive phenotypic effects resulting from combining two discrete perturbations' (Figure 1). Biologically, non-additive pheno-typic interactions provide a mechanism for the accumulation of functional genetic variation in a population, because inter-acting alleles, subject to phenotypic selection when present in combination, may escape selection and accumulate within a population by genetic drift in the absence of the interacting partner. In contrast, additive effects reflect genetic or envi-ronmental perturbations that elicit independent cellular
responses, and thus phenotypic selection is less dependent on combinations.
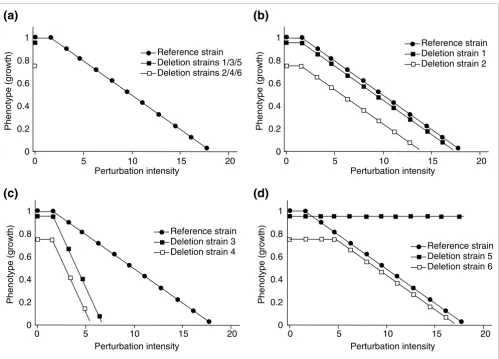
[image:2.612.59.558.84.442.2]Using the isogenic yeast deletion set, which provides both genetic tractability and genome wide insights, we developed a method for quantifying gene interaction globally with respect to cell growth. The phenotypic effects of experimental pertur-bations (for example, gene deletion and drug exposure) are measured individually and in combination for all deletion strains in parallel [17], and then quantified as additive, synergistic (greater than additive), or antagonistic (less than Model for classifying interactions as additive or non-additive
Figure 1
Model for classifying interactions as additive or non-additive. The interaction of effects between gene deletion and a second perturbation is quantified by comparison between the reference strain and each deletion strain over a range of perturbation-induced effects. Six hypothetical deletion strains are depicted to illustrate the contrast between additive and non-additive interaction. (a) The 'phenotypic slope' of the reference strain (filled circles) defines the effect of perturbation on the reference strain. The effect of gene deletion is determined in the absence of perturbation, and typically has either no effect (strains 1, 3, and 5) (filled square) or a negative effect (strains 2, 4, and 6) (open square) on growth. (b) Additive gene interactions are defined by the phenotypic slope of the deletion strain being parallel to that of the reference strain, across a range of perturbations (strains 1 and 2). (c,d) Non-additive gene interactions can be either synergistic (c), giving a phenotypic slope of greater absolute value (strains 3 and 4), or antagonistic (d), giving a phenotypic slope of lesser absolute value (strains 5 and 6). Two types of antagonistic interactions are depicted in (d). Deletion strain 5 is absolutely antagonistic to the perturbation (for example, drug resistance due to loss of a transporter required for drug uptake), whereas deletion strain 6 is antagonistic only when the inhibitory effect of the deletion alone is greater than that of the perturbation alone (for example, drug resistance due to deletion of the gene encoding the protein target of drug inhibition).
Reference strain Deletion strain 5 Deletion strain 6 Reference strain
Deletion strain 3 Deletion strain 4
Perturbation intensity
Reference strain Deletion strain 1 Deletion strain 2
Perturbation intensity
Perturbation intensity Perturbation intensity
Phenotype (growth) Phenotype (growth)
Reference strain Deletion strains 1/3/5 Deletion strains 2/4/6 1
0.8
0.6
0.4
0.2
0
1
0.8
0.6
0.4
0.2
0
Phenotype (growth) Phenotype (growth)
1
0.8
0.6
0.4
0.2
0
1
0.8
0.6
0.4
0.2
0
0 5 10 15 20 0 5 10 15 20
0 5 10 15 20
0 5 10 15 20
(a)
(b)
comm
en
t
re
v
ie
w
s
re
ports
refer
e
e
d
re
sear
ch
de
p
o
si
te
d r
e
se
a
rch
interacti
o
ns
inf
o
rmation
additive) (Figure 1). The expression 'additive interaction' implies that phenotypic effects are expressed independently, synonymous with 'no interaction' [4,9].
Is it possible to understand gene interaction networks com-prehensively and quantitatively? A simplifying principle is that biological systems appear modular (for example, path-ways) [18], so that network organization may be understood by the links between sets of functionally related genes. Genes and pathways that interact with respect to phenotype are said to buffer genetic variation [5,6]. As gene mutations typically cause loss of function, the set of yeast deletion strains pro-vides a powerful resource for investigating the genetic basis of phenotypic buffering. With the aim of conceptualizing an experimental framework for global quantitative analysis of gene interactions, this work involves development of a plat-form for measuring phenotypic interactions and demon-strates how quantitative analysis aids formulation of hypotheses about how cell growth is buffered against inhibi-tory perturbations. The analysis focuses on hydroxyurea (HU), an inhibitor of ribonucleotide reductase (RNR). RNR is a highly regulated protein complex required for deoxynucleo-side triphosphate (dNTP) synthesis, DNA replication and repair, and cell proliferation [19-27], and thus plays a central role in the molecular events of genome replication and cancer.
Results
The phenotypic array: theoretical and technical considerations for high-throughput growth analysis
Growth is both a system-level readout of cellular function and a quantitative trait. There are many considerations in quanti-fying growth, which is a complex function of cell proliferation, cell size, and viability/life span: each is potentially affected by genetic background (that is, gene deletions) and environmen-tal factors (for example, temperature, nutrient conditions, drugs).
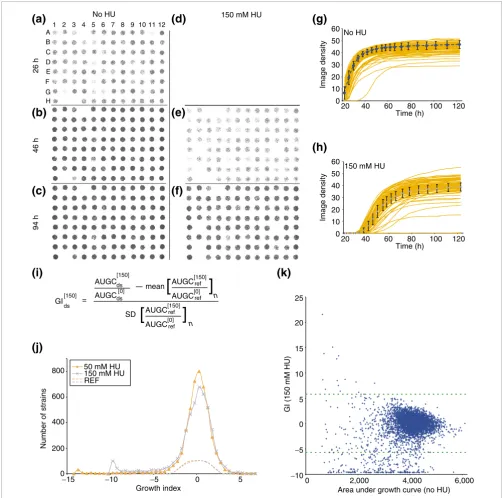
The phenotypic array method is based on analysis of scanned images of 8 × 12 cellular arrays spotted onto agar growth medium (Figure 2). In pilot studies, the image density of spot-ted cultures was linearly relaspot-ted to the number of cells (data not shown); however, imaging sensitivity was insufficient to measure exponential growth rates directly (see part A of the figure in Additional data file 1). Thus, we used the area under the growth curve (AUGC) as a unit measure of growth, repre-senting the overall fitness (rate and total yield) for biomass accumulation (Figure 2).
The growth index: a measure for screening non-additive gene interactions
The growth index (GI) predicts whether a deletion strain maintains growth proportional to the reference strain under a single perturbation. The equation is given in Figure 2i. It is formulated as a z-statistic, providing a standardized
comparison of interactions. The rationale for each of the terms in the GI equation is as follows. First, the growth (AUGC) of each deletion strain under a perturbation is nor-malized to 'intrinsic growth' (AUGC of the same strain with-out perturbation) to account for effects of the deletion alone (see Figure 1, and Additional data file 2). Second, the mean and standard deviation of normalized growth for replicate cultures of the reference strain represent the effect of the per-turbation alone and the experimental noise, respectively. Thus, a non-zero numerator signals a differential phenotypic response to the perturbation between the deletion strain and the reference strain, and the denominator normalizes to the experimental noise (Figure 2i).
Slow growth was found to be noisy; harsher perturbations therefore result in higher minimum GI values (Figure 2j). Also, strains with high GI values (antagonistic interactions) usually consist of intrinsically slow-growing strains having relative resistance but not better absolute growth than the ref-erence strain (see Figure 1d, and Additional data file 2) [28]. The GI may be modified to quantify the effect of a single per-turbation (that is, gene deletion or drug exposure), whereby the AUGC, with and without perturbation, is substituted for the normalized ratios (for example, see column J in Addi-tional data file 7). The GI, as a z-statistic, is normally distrib-uted for replicates of the reference strain, with a mean value of zero (Figure 2j, and parts A and B in Additional data file 4), and is robust with respect to times after which growth has largely subsided (linear regression of GI values from the genome-wide HU screen calculated at 94 versus 123 hours had R2 = 0.986, data not shown). Reproducibility of GI meas-urements obtained from independent experiments is repre-sented in Additional data file 3.
A common method for recording growth phenotypes involves comparing serial dilutions of cells spotted onto agar [29,30]. Because we use a single dilution across a range of perturba-tions, and the AUGC is a fairly novel unit measure for growth, we examined the behavior of the GI with respect to the pertur-bation strategy (cell dilution versus drug dilution) (see Addi-tional data file 4). Drug dilution and cell dilution were well correlated with respect to GI, but only drug dilution quantita-tively delineates strong phenotypic interactions: for example, when drug dilution but not cell dilution permits growth (Fig-ure 3).
Genome-wide HU screen reveals many non-additive interactions
Overview of phenotypic array and growth index (GI)
Figure 2
Overview of phenotypic array and growth index (GI). Growth is quantified by image analysis of cellular arrays and plotted against time to calculate area under the growth curve (AUGC), which is used to calculate the growth index (GI) a predictor of non-additive gene interaction. (a-f) Raw data from growth of a single deletion strain source plate (plate 4, see Additional data file 7) at three different times, 26 h (a,d), 46 h (b,e), and 94 h (c,f), and under two different conditions, synthetic complete medium without HU (a-c) and with 150 mM HU (d-f). Only three strains (E2, E10 and G2) were selected for further testing from this plate, having GI < -5.8. (g,h) Growth curves (red) for all 94 strains are plotted, along with the mean growth (blue dashed line) from 196 replicates of the reference strain, in (g) the absence or (h) the presence of 150 mM HU. (i) The GI equation is a z-statistic, where the difference between normalized growth of the deletion and mean of reference strains is the signal for non-additive interaction, and the standard deviation of the reference strain growth is the noise. [], concentration of HU (mM); ds, deletion strain; ref, reference strain; n, number of replicates; SD, standard deviation. (j) The distribution of GI scores for all strains (except 64 strains with unperturbed AUGC < 600, see Additional data files 2, 7) from the 50 mM (red triangles) and 150 mM (blue crosses) HU screens (n = 4,788, bin size = 0.5), along with the distribution of reference strain GI values (dashed lines) (n = 192, bin size = 1; range: -2.41 < GI < 2.15). REF, reference strain. (k) Plot of intrinsic growth (AUGC when unexposed to drugs) vs phenotypic interaction with HU (GI) is shown for all deletion strains. Dashed lines indicate the GI cutoffs used to select synergistic (GI < -5.8) or antagonistic (GI > 5.8) interactions for further testing.
20 40 60 80 100 120
No HU
Image density
Time (h) A
1 2 3 4 5 6 7 8 9 10 11 12
B C D E F G H
No HU 150 mM HU
26 h
46 h
94 h
0 2,000 4,000 6,000
Area under growth curve (no HU)
GI (150 mM HU)
Growth index 50 mM HU
150 mM HU REF
Number of strains
n
n
[150]
mean
SD GI
ds [150]
ds
ds [150]
=
[
]
[0]
ref
AUGC AUGC
[0] ref
AUGC
[150]
[
AUGCref]
[0] ref
AUGC AUGC
150 mM HU 0
10 20 30 40 50 60
20 40 60 80 100 120
Image density
Time (h) 0
10 20 30 40 50 60
200
5 0
−5
−10
−15 400 600 800
0 −10
−5 0 5 10 15 20 25
(a)
(b)
(c)
(i)
(k)
(j)
(d)
(e)
(g)
(h)
comm
en
t
re
v
ie
w
s
re
ports
refer
e
e
d
re
sear
ch
de
p
o
si
te
d r
e
se
a
rch
interacti
o
ns
inf
o
rmation
data files 4, 7). 'Sensitivity' to HU has been reported for yeast deletion strains identified from screens of sensitivity to gamma irradiation or the alkylating agent, methyl meth-anesulfonate (MMS) [31,32]. We found 'synergism' among many (75/118) of these previously reported genes, as well as many others (see Additional data file 8). Different methods of scoring growth and gene interaction, different growth media, and different HU concentrations may account for inconsist-encies. There was only one deletion strain, kre22, which was found in both of the above studies but not in our screen. This proved to be a false-negative result in our screen when we sequenced the deletion barcode from our presumed kre22 deletion culture (see methods) [17,33] and found a contami-nating strain. We subsequently recloned the kre22 deletion and confirmed the synergistic interaction with HU in separate tests (data not shown).
Figure 2k depicts the relationship between effects of gene deletion alone and the interacting effects of gene deletion and treatment with 150 mM HU. On the basis of synergistic inter-action, 274 strains were selected for further characterization, and 22 were selected on the basis of antagonistic interaction (Figure 2k, and see Additional data files 2, 8). Using the GI threshold of ±5.8, 94 strains met the GI criteria for both the 50 and 150 mM perturbations and 178 only for the harsher 150 mM HU condition. Only two interactions were scored as synergistic in the 50 mM HU screen alone. From Figure 2k note that antagonistic interactions (GI > 5.8) always occurred in the context of low intrinsic growth (see Figures 1d, 3d). This effect of 'alleviating' the deleterious effects of mutation was previously reported in transposon-mutagenized bacteria [28]. Strains with extremely low intrinsic growth (AUGC < 600 on C media) were excluded from GI analysis (see Addi-tional data file 7) the small denominator means relatively slight absolute differences in perturbed growth have a dispro-portionately large effect on the GI (see Figure 2i) in this set-ting, and are thus less reproducible. Among these excluded strains, there were at least two strains (gnd1 and ism1), which appeared growth-enhanced by the presence of HU; however, these were not studied further (see Additional data file 7).
In addition, the rnr3 and sml1 deletion strains were added to the HU-selected strains as negative controls in further stud-ies, because while these two genes are known to regulate RNR activity [34-36], they have small or undetectable effects on HU sensitivity.
The interaction index: verification of Growth Index screening and measurement of interaction quantities
The purpose of the GI is to screen for interactions using single perturbations (Figures 1, 2i). To validate its utility and further quantify the strength of the interactions, the 298 strains (with GI less than -5.8 or greater than 5.8) selected from the HU screen were perturbed with a range of HU concentrations inducing a wide spectrum of growth inhibition in the refer-ence strain (Figure 3, and Additional data file 1). 'Phenotypic
slopes' were calculated by regression analysis of AUGC, measured for each strain as a function of HU concentration (see Figures 1, 3, Materials and methods, and Additional data file 12). An 'interaction index' was formulated, essentially by substituting phenotypic slope values into the GI equation, yielding a z-statistic (see Figure 2i, Materials and methods, and Additional data file 12) where more negative, parallel, or less negative phenotypic slopes yield interaction index scores reflecting the probability of synergistic, additive or antagonis-tic interactions respectively (Figures 1, 3, and Additional data file 12). The reference range for the interaction index (repli-cate cultures of the reference strain) was -2.64 to +2.04, (see Additional data file 12). Using a z-score cut-off of ±5.8, 215 interactions were non-additive (197 were synergistic; 18 antagonistic), and 79 (27%) were additive (see Additional data file 12).
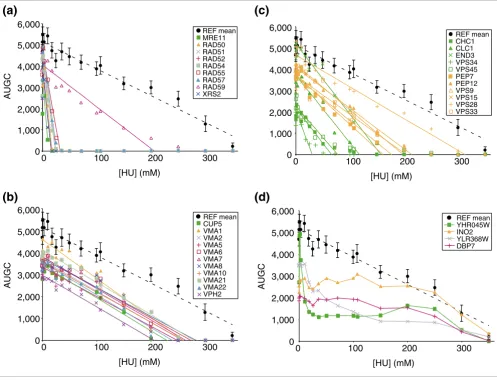
Genes with related functions had quantitatively similar inter-action index scores. For example among the RAD52 epistasis group (MRE11-RAD50-XRS2, RAD51, 52, 54, 55, 57, 59, and RDH54) [37], all members showed equivalently strong syner-gistic interaction except for RAD59 (Figure 3a, and Addi-tional data file 12), and RDH54, which functions in meiosis and was not selected from the HU screen [38]. To confirm the weaker interaction of rad59, the respective homozygous diploid deletion strain was sporulated and dissected, the chromosomal deletion was confirmed by tag-sequencing (see Materials and methods), and multiple haploid segregants (of both mating types) were re-tested along with the homozygous diploid, which confirmed the phenotypic difference (data not shown). Thus, RAD59 is unique among homologous recombi-nation genes in being relatively dispensable in the context of HU stress [39].
The interaction index for each of the 11 vacuolar H+-ATPase deletion strains was also uniform (see Additional data file 12), but in contrast to homologous recombination, the phenotypic effect of losing the vacuolar H+-ATPase was additive with the effect of HU (Figure 3b). The functional modularity seems to be due to the structural requirement of each subunit for com-plex assembly [40].
Modularity in buffering growth against HU inhibition is exemplified by genes with related functions having similar strength of interactions
Figure 3
Modularity in buffering growth against HU inhibition is exemplified by genes with related functions having similar strength of interactions. AUGC is plotted vs HU concentration in all cases. (a) Genes of the RAD52 epistasis group. Note the uniformly strong synergistic interaction (see Figure 1c), with the exception of RAD59. (b) Genes of the vacuolar H+-ATPase. Note the additive interactions (see Figure 1b). (c) Genes involved in vacuolar trafficking. The
stronger interactions are shown in green. (d) Assorted examples of antagonistic interactions (see text and Additional data file 12). Note that gene deletions often, in general, antagonize the HU phenotype at concentrations where the growth inhibitory effect of the deletion is greater than the inhibitory effect of HU on the reference strain (see Figure 1d) [28]. REF, reference strain BY4741 (see Materials and methods).
Table 1
Comparison of GI values between homozygous diploid and MATa haploid deletion strains
Synergistic HU50 Antagonistic HU50 Synergistic HU150 Antagonistic HU150 Intrinsic growth < 14%
MATa haploid only 42 18 52 4 23
Homozygous diploid only
86 76 213 72 91
Both 82 4 182 4 32
Neither 4,336 4,448 4,099 4,466 4,546
Total 4,546 4,546 4,546 4,546 4,692
At 50 and 150 mM HU, threshold values (GI < -5.8 classified as synergistic or GI > 5.8 classified as antagonistic) were used to score agreement. Only deletion strains having intrinsic (unperturbed) growth greater than 14% that of the reference strain in both sets (see text) were compared. See also Additional data file 14.
REF mean YHR045W INO2 YLR368W DBP7 REF mean CHC1 CLC1 END3 VPS34 VPS45 PEP7 PEP12 VPS9 VPS15 VPS28 VPS33
REF mean CUP5 VMA1 VMA2 VMA5 VMA6 VMA7 VMA8 VMA10 VMA21 VMA22 VPH2
0 100 200 300
REF mean MRE11 RAD50 RAD51 RAD52 RAD54 RAD55 RAD57 RAD59 XRS2
AUGC
[HU] (mM) 0
1,000 2,000 3,000 4,000 5,000 6,000
0 100 200 300
[HU] (mM) 0
1,000 2,000 3,000 4,000 5,000 6,000
0 100 200 300
AUGC
[HU] (mM) 0
1,000 2,000 3,000 4,000 5,000 6,000
0 100 200 300
AUGC
[HU] (mM) 0
1,000 2,000 3,000 4,000 5,000 6,000
(a)
(b)
(c)
[image:6.612.56.555.600.697.2]comm
en
t
re
v
ie
w
s
re
ports
refer
e
e
d
re
sear
ch
de
p
o
si
te
d r
e
se
a
rch
interacti
o
ns
inf
o
rmation
Eighteen strains exhibited antagonistic interactions (Figures 1d, 3d). Phenotypic slopes were relatively nonlinear in the context of antagonistic interactions, as absolute growth of deletion strains almost never exceeded reference-strain growth for a given perturbation (Figure 3d, and Additional data file 12: note R2 values for strains with interaction index > 3).
There were nine strains (out of 4,852) with growth index greater than 5.8 or less than -5.8 at the 50 mM concentration only (see Additional data file 8, bolded values). The interac-tion index (see Addiinterac-tional data file 12) indicated these were spurious screening results due to experimental noise, either that associated with low intrinsic growth of the deletion strain and/or that of random experimental variation.
Reproducibility of interactions between haploid and diploid deletion strains
The analysis of phenotypic slope and interaction index given above verifies whether interactions are non-additive. It does not, however, insure that the interactions are biologically explained by deletion of the targeted gene. Unintended sec-ondary mutations may occur during knockout transforma-tion, and/or spontaneous growth-enhancing mutations may become fixed during strain propagation. To assess these pos-sibilities, the genome screens were replicated in the homozygous diploid deletion set [41].
The comparison is summarized in Table 1 (see also Additional data files 7, 13, 14). Generally, the effect of homozygous dele-tion was more detrimental than haploid deledele-tion for both intrinsic growth and HU resistance, consistent with previous data showing haploid deletion strains less affected by ionizing radiation and other DNA-damaging perturbations [31]. From the 150 mM HU screens, there were 182 strains from both sets indicating synergistic interaction, 52 from the haploid but not the diploid set, and 213 from the diploid set only. Some dele-tion strain pairs could not be directly compared using the GI because either the haploid or the diploid deletion strain had inadequate intrinsic growth (less than 14% that of the refer-ence strain) or the deletion was not represented in both sets.
In summary, the agreement between haploid and diploid screens supports the utility of the yeast deletion set and the GI for quantifying gene interactions. It appears that the haploid deletion strains are generally more fit than their homozygous diploid counterparts, whether perturbed by HU or not. It is possible that rapid accumulation of suppressor/adaptive mutations occurs on some haploid backgrounds, but given the small population size of each culture and the small number of selective generations, accumulation of suppressors seems an improbable general explanation for the increased fitness of haploid strains [42,43].
Selectivity of interactions determined with other drug perturbations
The 298 deletion strains chosen from the HU screen were perturbed with four other drugs to determine the selectivity of gene interaction. Inhibitors of biologically diverse cellular functions were used: miconazole is a specific inhibitor of Erg11p, essential for ergosterol synthesis; cycloheximide is a specific inhibitor of Rpl28p, part of the large ribosomal subu-nit [44]; cisplatin causes DNA intra- and inter-strand cross-links, resulting in DNA breaks; t-butyl hydroperoxide (TBHP) induces oxidative stress. Three concentrations of each agent were identified that inhibited reference strain growth equiva-lently to 50, 100 and 150 mM HU (see Additional data file 1), and all conditions were tested in parallel.
Selectivity for interaction with HU was high (see Additional data file 9). The correlation between GI value in response to HU and either miconazole, cycloheximide or TBHP was near zero (R2 < 0.04). In contrast, correlation between cisplatin and HU was higher (R2 = 0.13) (Figure 4, and Additional data file 5). The greater correlation between HU and cisplatin interactions presumably reflects overlapping pathways required for growth during perturbations to DNA replication [29,31,32].
Hierarchical clustering of quantitative interaction data highlights bio-modularity
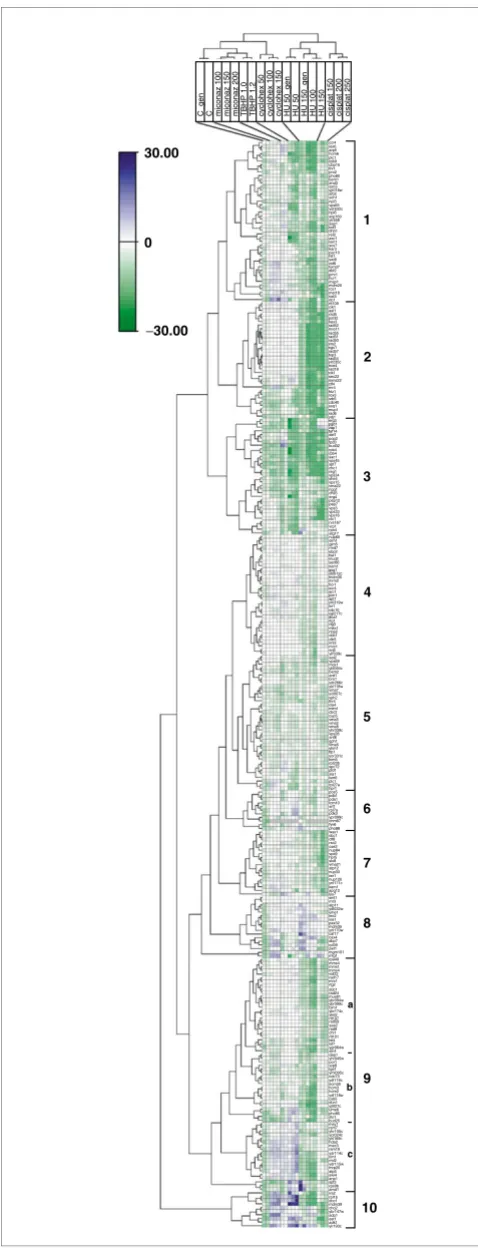
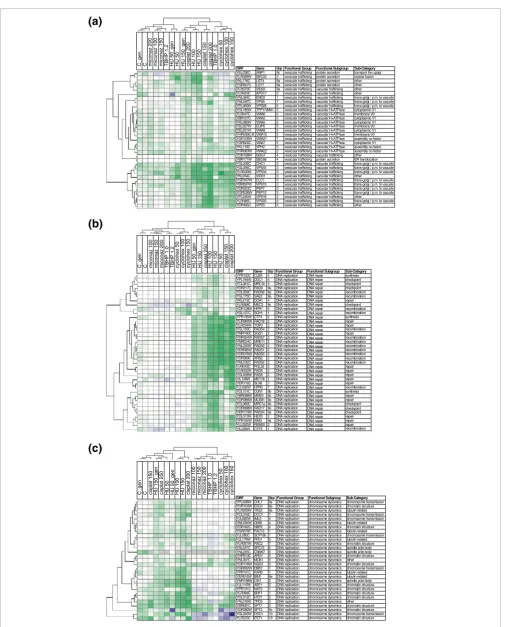
The experimental design and data structure of the phenotypic array are analogous to global gene-expression studies. The deletion strains are analogous to DNA hybridization probes for associating measurements with genes and the GI values represent directional (negative if synergistic, or positive if antagonistic) gene interaction quantities analogous to log2 of mRNA hybridization ratios. Thus clustering algorithms can be used for global correlation of the direction, strength and selectivity of interaction [45]. We refer to 'bio-modules' as sets of strains within a clustered phenotypic profile, indicat-ing modular effects of the respective genes in respondindicat-ing to various growth perturbations (Figures 3, 4, 5, 6, 7).
The strains in cluster 2 (Figure 4) indicate strong synergistic effects, selective for HU and cisplatin perturbations. This cluster is enriched for DNA repair functions (Figure 5a), including recombination pathways [49,50]. The biological basis of this module probably relates to increased require-ment for repair of single-strand DNA gaps and/or DNA dou-ble-strand breaks resulting from stalled replication forks as a consequence of either dNTP pool limitation or DNA cross-links [19,20,23,51,52]. Mre11p, Rad50p, and Xrs2p, along with the products of other genes in the RAD52 epistasis group, comprise a protein complex that repairs DNA breaks by homologous recombination. Rad51p has recombinase activity that is stimulated by Rad55p, and it is targeted to sin-gle-stranded DNA by Rad52p [37,48]. SGS1 (Bloom's Syn-drome/RecQ helicase homolog), TOP3 (SGS1-interacting topoisomerase), MUS81, MMS4, and HPR5 have been char-acterized for their roles in detoxifying single-strand DNA lesions (see Figure 6b) [52]. Within cluster 9a, five of six genes involved in sensing DNA damage (RAD24, RAD17,
RAD9, DDC1 and MRC1) form a module, while MEC3 appears
[image:8.612.57.296.84.713.2]distinct, not interacting with cisplatin, and interacting antag-onistically with other perturbations (Figure 4, cluster 9c, and Figure 6b). Only a few nucleotide-metabolism genes were identified from the HU screen. The interaction phenotypes of the strains ado1 (adenosine kinase; converts adenosine to AMP) and adk1 (adenylate kinase; converts AMP + ATP to ADP) were antagonistic, suggesting that the slow-growth phenotype of these strains could be due to basal substrate limitation. Thus, the growth-inhibitory effect of HU, observed at lower concentrations in the reference strain, would be masked until RNR activity becomes limiting (see Figure 1d) for dATP production. The strains apt1 (encoding adenine phosphoribosyltransferase, which converts adenine and phosphoribosyl pyrophosphate (PRPP) to AMP) and amd1 (AMP deaminase) indicated synergistic effects of gene dele-tion and HU perturbadele-tion, suggesting that these genes may
Figure 4 1 2 3 4 5 6 7 8 9 10 a b c ccr4 ies6 arp5 hom6 ptc1 rpb9 ubp15 thr1 pro2 pho80 bem1 end3 ssn3 yjr018w srb2 soh1 npl3 vps65 ydr532c npl6 scp160 ylr358 eap1 bdf1 dhh1 ref2 asc1 lsm1 scs7 kar3 pac10 htl1 swi6 cst6 tom37 dbf2 pmr1 hur1 map1 mdm20 rcs1 met18 nat3 rib1 rtt109 cik1 asf1 rad5 pol32 hex3 rad52 mre11 rad55 rad51 rad50 xrs2 sgs1 rad57 top3 rad54 ylr235c nce4 rad18 cik1 sec22 mms22 ctf4 rnr4 htz1 rox3 srb5 cdc40 ssq1 mup1 rad6 ydj1 erg3 pgd1 zap1 taf14 def1 pop2 tpd3 bud32 rpb4 rpb4 sac1 vps45 spt7 chc1 reg1 vps34 she4 vps15 vma22 ngg1 chs5 erg4 pep12 pep7 vps3 vps33 vps16 clc1 rvs167 vrp1 rpn4 atg17 nup60 elm1 gim5 rmd7 ubp2 tsa1 mud2 sec66 nem1 ybl012c mdm30 mrm2 hcr1 sur4 arc1 pim1 apt1 ynl319w ixr1 gsg1 cdc10 ygl217c doa1 rtg1rtg3 mks1 nbp2 ddc1 clb5 iml2 mrc1 erj5 yfr039c aat2 vps69 mck1 ybl094c bem2 ard1 bro1 ydr266c ykl118w vma7 ycl007c vph2 thr4 cla4 mtm1 cbc2 cup5 vma5 vma2 vma8 yhr039c vps28 snf8 gph1 vma6 yhm1 tfp1 yor331c rpl20b spc72 pfd1 sla1 lsm6 plc1 rpl27a hpr1 pos5 pdb1 tom5 pda1 tcm10 srf1 rpl7a pdx3 ypr099c cnm67 fyv6 pho88 wss1 dcc1 ctf8 rsc2 cse2 nup84 vps9 hpr5 slx8 vma21 atp12 nup33 iwr1 nup120 ynl171c kem1 apq12 lys7 sml1 rnr3 atp11 ydl032w yme1 ino2 isa1 pex32 mdm35 ynl170w caf17 cax4 dbp7 rpl39 mgm101 mtg1 rpa49 mms4 mms1 mms4 vid22 rad17 mrc1 rtg2 zwf1 ddc1 rad24 mus81 ybr094w ybr099c bim1 ybr174c yke2 rtt107 rad59 sae2 rad9 chl1 rtt101 lst4 lst7 ygr064w sin4 dap1 yhr045w por1 arp8 lge1 yml095c cdc73 ydl119c ecm30 hom3 hom2 ydl118w cyb5 dun1 yjl027c ume6 pho85 sto1 bud25 msy1 rsm7 yhr100c ycr024c ykl169c hda2 mec3 rsm19 ydr114c rml2 ydr115w mrp20 atp5 swi4 anp1 spt3 rim1 rps9b amd1 ira2 rpl1b mdm39 cho2 ybr147w ado1 est1 adk1 doc1 ylr193c 30.00 −30.00 0
C_gen C miconaz 100 miconaz 150 miconaz 200 TBHP 1.0 TBHP 1.2 cyclohex 50 cyclohex 100 cyclohex 150 HU 50_gen HU 50 HU 150_gen HU 100 HU 150 cisp
l at 150 cisp l at 200 cisp l at 250
Modularity of gene interactions
Figure 4
comm
en
t
re
v
ie
w
s
re
ports
refer
e
e
d
re
sear
ch
de
p
o
si
te
d r
e
sea
rch
interacti
o
ns
inf
ormation
have a regulatory function to compensate for growth defi-ciency, possibly by effecting an increase in the ADP substrate on demand. The hypothesis that ADP is the limiting substrate of RNR activity is consistent with the logic of negative feed-back regulation, given that dATP is an allosteric inhibitor of RNR [22].
Threonine synthesis was another interesting module. It was the only amino-acid metabolism pathway recovered from the HU screen (see Additional data file 11). Deletion of HOM3
and HOM2 (homoserine is upstream of the threonine/
methionine branch point) resulted in very strong and selec-tive synergism with HU, whereas the deletion effects in down-stream components (HOM6, THR1, THR4) were less selective (see Additional data file 5). AAT2 (aspartate ami-notransferase), which is involved in the metabolism of aspar-tate, the substrate of Hom3p, showed weaker synergism (see Additional data file 12).
Genes required for normal mitochondrial function (SSQ1,
TOM37, ATP5, RML2) also displayed HU synergism (see
Additional data file 11). Reduced RNR function causes increased respiratory deficiency, possibly owing to perturbed mitochondrial DNA replication [53]. Possibly connecting the threonine synthesis and 'mitochondrial' modules is the 'retro-grade signaling' module (see Figure 7 and Discussion). RTG1, RTG2, RTG3 and MKS1 have been studied for their function in regulating the expression of genes of the TCA cycle [54-57] in response to mitochondrial dysfunction. Retrograde-defi-cient mutants are auxotrophic for aspartate, the precursor of threonine synthesis [54]. MKS1, which interacts with RTG2 in retrograde signaling [56], had a similar interaction profile to the RTG genes (see part C of Additional data file 6).
The lst4 and lst7 (lethal with sec13) deletion strains, which clustered together, were phenotypically 'modular' with rtg2 as well (Figure 4, cluster 9a). LST4 and LST7 (along with an essential gene, LST8) have been shown to regulate transport of GAP1 (general amino acid permease) between the vacuole and plasma membrane [58]. Furthermore, RTG2 signaling is negatively regulated by LST8 [59]. A hypothesis emerging from these interactions is that they represent a regulatory cir-cuit whereby metabolic flux through threonine synthesis and degradation provides glycine, which may augment purine synthesis when RNR activity is compromised (see Discussion, and Figure 7) [47,60].
Figure 5
erg3 pgd1 zap1 taf14 def1 pop2 tpd3 bud32 rpb4 rpb4 sac1 vps45 spt7 chc1 reg1 vps34 she4
vps15 ngg1 chs5 erg4 pep12 pep7 vps3 vps33 vps16 clc1
vrp1 rpn4 atg17 vma22
rvs167 rtt109 cik1 asf1 rad5 pol32 hex3 rad52 mre11 rad55 rad51 rad50 xrs2 sgs1 rad57 top3 rad54 ylr235c nce4 rad18 cik1 sec22 mms22
ctf4 rnr4 htz1 rox3 srb5 cdc40 ssq1 mup1 rad6 ydj1
C_gen C miconaz 100 miconaz 150 miconaz 200 TBHP 1.0 TBHP 1.2 cyclohex 50 cyclohex 100 cyclohex 150 HU 50_gen HU 50 HU 150_gen HU 100 HU 150 cisp
l
at 150
cisp
l
at 200
cisp
l
at 250
C_gen C miconaz 100 miconaz 150 miconaz 200 TBHP 1.0 TBHP 1.2 cyclohex 50 cyclohex 100 cyclohex 150 HU 50_gen HU 50 HU 150_gen HU 100 HU 150 cisp
l
at 150
cisp
l
at 200
cisp
l
at 250
(a)
(b)
An enlarged view of clusters 2 and 3 from Figure 4
Figure 5
An enlarged view of clusters 2 and 3 from Figure 4. (a) Cluster 2 identifies a group of strains indicating strong and selective synergism between gene deletion and DNA-damaging perturbations. The set is highly enriched for DNA repair genes, and, in particular, homologous recombination genes.
Figure 6 (see legend on next page)
ORF Gene Grp Functional Group Functional Subgroup Sub-Category
YPL008W CHL1 9a DNA replication chromosome dynamics chromosome transmission YHR154W ESC4 9a DNA replication chromosome dynamics chromatin structure YLR200W YKE2 9a DNA replication chromosome dynamics tubulin-related YCL016CDCC1 7 DNA replication chromosome dynamics chromosome transmission YJL082W IML2 4 DNA replication chromosome dynamics chromosome transmission YML094W GIM5 4 DNA replication chromosome dynamics tubulin-related YDR162C NBP2 4 DNA replication chromosome dynamics chromatin structure YGR078C PAC10 1 DNA replication chromosome dynamics tubulin-related YJL080C SCP160 1 DNA replication chromosome dynamics chromosome transmission YJL179W PFD1 5 DNA replication chromosome dynamics tubulin-related YLR357W RSC2 7 DNA replication chromosome dynamics chromatin structure YAL047CSPC72 5 DNA replication chromosome dynamics spindle pole body YNL225CCNM67 6 DNA replication chromosome dynamics spindle pole body YHR013C ARD1 5 DNA replication chromosome dynamics chromatin structure YNL307CMCK1 5 DNA replication chromosome dynamics other YDR176W NGG1 3 DNA replication chromosome dynamics chromatin structure YGR092W DBF2 1 DNA replication chromosome dynamics chromosome transmission YPR141C KAR3 1 DNA replication chromosome dynamics tubulin-related YER016W BIM1 9a DNA replication chromosome dynamics tubulin-related YMR198W CIK1 2 DNA replication chromosome dynamics spindle pole body YJL115W ASF1 2 DNA replication chromosome dynamics chromatin structure YPR131C NAT3 1 DNA replication chromosome dynamics chromatin structure YLR399CBDF1 1 DNA replication chromosome dynamics chromatin structure YOL012C HTZ1 2 DNA replication chromosome dynamics chromatin structure YAL016W TPD3 3 DNA replication chromosome dynamics other YBR081C SPT7 3 DNA replication chromosome dynamics chromatin structure YDR392W SPT3 9c DNA replication chromosome dynamics chromatin structure YGL240W DOC1 10 DNA replication chromosome dynamics chromosome transmission YLR233CEST1 10 DNA replication chromosome dynamics chromatin structure
ORF Gene Grp Functional Group Functional Subgroup Sub-Category
YPR120C CLB5 4 DNA replication DNA repair synthesis YPL194W DDC1 4 DNA replication DNA repair checkpoint YCL061CMRC1b 4 DNA replication DNA repair checkpoint YDR217C RAD9 9a DNA replication DNA repair checkpoint YDL059CRAD59 9a DNA replication DNA repair recombination YGL175C SAE2 9a DNA replication DNA repair recombination YKL213CDOA1 4 DNA replication DNA repair repair YLR288CMEC3 9c DNA replication DNA repair checkpoint YDR138W HPR1 5 DNA replication DNA repair recombination
recombination
recombination recombination YGL127C SOH1 1 DNA replication
YPR135W CTF4 2 DNA replication synthesis YCR066W RAD18 2 DNA replication repair YLR234W TOP3 2 DNA replication repair YGL163C RAD54 2 DNA replication recombination YMR190C SGS1 2 DNA replication repair YDR004W RAD57 2 DNA replication recombination YMR224C MRE11 2 DNA replication recombination YNL250W RAD50 2 DNA replication recombination YER095W RAD51 2 DNA replication recombination YDR076W RAD55 2 DNA replication
YDR369C XRS2 2 DNA replication
YML032C RAD52 2 DNA replication recombination
recombination YJR043CPOL32 2 DNA replication repair YLR032W RAD5 2 DNA replication repair YGL058W RAD6 2 DNA replication repair YIL128W MET18 1 DNA replication repair YER116C SLX8 7 DNA replication repair YJL092W HPR5 7 DNA replication recombination YDL101CDUN1 9b DNA replication synthesis YBR098W MMS4 9a DNA replication repair YDR386W MUS81 9a DNA replication repair YCL060CMRC1a 9a DNA replication checkpoint
checkpoint checkpoint YOR368W RAD17 9a DNA replication
YER173W RAD24 9a DNA replication
YDL013W HEX3 2 DNA replication repair YPR164W KIM3 9a DNA replication repair YLL002W REM50 2 DNA replication repair YIL036W CST6 1 DNA replication
DNA repair DNA repair DNA repair DNA repair DNA repair DNA repair DNA repair DNA repair DNA repair DNA repair DNA repair DNA repair DNA repair DNA repair DNA repair DNA repair DNA repair DNA repair DNA repair DNA repair DNA repair DNA repair DNA repair DNA repair DNA repair DNA repair DNA repair DNA repair DNA repair
ORF Gene Grp Functional Group Functional Subgroup Sub-Category
YEL036C ANP1 9c vesicular trafficking protein secretion transport thru golgi YLR268W SEC22 2 vesicular trafficking protein secretion vesicle fusion YKL176C LST4 9a vesicular trafficking protein secretion other YGR057C LST7 9a vesicular trafficking
vesicular trafficking
protein secretion other YLR373C VID22 9a vesicular trafficking vacuolar trafficking other YLR423C APG17 3 vacuolar trafficking other YNL084C END3 1 vesicular trafficking vacuolar trafficking trans-golgi / p.m. to vacuole YML097C VPS9 7 vesicular trafficking vacuolar trafficking trans-golgi / p.m. to vacuole YPL065W VPS28 5 vesicular trafficking vacuolar trafficking trans-golgi / p.m. to vacuole YDL185W TFP1/VMA1 5 vesicular trafficking vacuolar H+ATPase cytoplasmic V1 YLR447C VMA6 5 vesicular trafficking vacuolar H+ATPase membrane V0 YBR127C VMA2 5 vesicular trafficking vacuolar H+ATPase cytoplasmic V1 YKL080W VMA5 5 vesicular trafficking vacuolar H+ATPase cytoplasmic V1 YEL027W CUP5 5 vesicular trafficking vacuolar H+ATPase membrane V0 YEL051W VMA8 5 vesicular trafficking vacuolar H+ATPase cytoplasmic V1 YHR039C-B VMA10 5 vesicular trafficking vacuolar H+ATPase membrane V0 YGR105W VMA21 7 vesicular trafficking vacuolar H+ATPase assembly co-factor YGR020C VMA7 5 vesicular trafficking vacuolar H+ATPase cytoplasmic V1 YKL119C VPH2 5 vesicular trafficking vacuolar H+ATPase assembly co-factor YHR060W VMA22 3 vesicular trafficking vacuolar H+ATPase assembly co-factor YDR108W GSG1 4 vesicular trafficking vacuolar trafficking other YBR171W SEC66 4 vesicular trafficking protein secretion ER translocation YGL206C CHC1 3 vesicular trafficking vacuolar trafficking trans-golgi / p.m. to vacuole YGL095C VPS45 3 vesicular trafficking vacuolar trafficking
YLR240W VPS34 3 vesicular trafficking vacuolar trafficking YKL054C VID31 3 vesicular trafficking vacuolar trafficking other YGR167W CLC1 3 vesicular trafficking vacuolar trafficking YBR097W VPS15 3 vesicular trafficking vacuolar trafficking YDR323C PEP7 3 vesicular trafficking vacuolar trafficking YOR036W PEP12 3 vesicular trafficking vacuolar trafficking YPL045W VPS16 3 vesicular trafficking vacuolar trafficking other YLR396C VPS33 3 vesicular trafficking vacuolar trafficking YDR495C VPS3 3 vesicular trafficking vacuolar trafficking other
trans-golgi / p.m. to vacuole trans-golgi / p.m. to vacuole
trans-golgi / p.m. to vacuole trans-golgi / p.m. to vacuole trans-golgi / p.m. to vacuole trans-golgi / p.m. to vacuole
trans-golgi / p.m. to vacuole C_gen C miconaz 200 miconaz 100 miconaz 150 TBHP 1.2 HU 50_gen HU 50 HU 150_gen cisplat 250 HU 100 HU 150 cisplat 150 cisplat 200 TBHP 1.0 cyclohex 50 cyclohex 100 cyclohex 150
C_gen C miconaz 100 miconaz 150 miconaz 200 TBHP 1.0 TBHP 1.2 cyclohex 50 cyclohex 100 cyclohex 150 HU 50_gen HU 150 cisp
l
at 250
HU 100 HU 150 HU 50 cisplat 150 cisplat 200
C_gen C cisplat 150 HU 150_gen cisplat 250 HU 50 HU 50_gen HU 100 HU 150 cisplat 200 miconaz 100 miconaz 150 miconaz 200 TBHP 1.0 TBHP 1.2 cyclohex 50 cyclohex 100 cyclohex 150
(a)
(b)
comm
en
t
re
v
ie
w
s
re
ports
refer
e
e
d
re
sear
ch
de
p
o
si
te
d r
e
se
a
rch
interacti
o
ns
inf
o
rmation
A different bio-module was suggested by the broad pheno-typic profile of interactions involving vesicular trafficking and vacuolar protein sorting genes [40,61], and the strong syner-gism with cycloheximide (Figures 4 (cluster 3), 5b). A result-ing hypothesis is that VPS genes are generally required for growth when protein synthesis is stressed (as with ribosomal poisoning by cycloheximide), and that protein synthesis is, in fact, generally stressed when cell growth is limited (see Dis-cussion). Support comes from previous work showing mor-phological class C (no vacuole) and D (defective inheritance and acidification) vps mutants [62] to be most defective in proliferative responses of the endoplasmic reticulum, and sensitive to a diverse array of 22 perturbing conditions [30]. Overall, only 12 of 46 vps mutants are in class C and D for vac-uolar morphology [62]; however, nine of 10 identified in this study were class C or D (the exception being vps28, which was phenotypically distinct in further tests, see Figure 3c). Our findings support a previous hypothesis that increased flux through the VPS pathway is a compensatory response required for maintaining growth in the face of a wide range of cellular perturbations [30].
The phenotypic profiles of the end3, chc1 (clathrin heavy chain) and clc1 (clathrin light chain) deletion strains were similar to the vps strains (Figure 7c, and Additional data file 12), implicating their shared role in trafficking to the vacuole, via endosomes [40]. The strength of interaction for these mutants was similar to that of the vps mutants, further hint-ing at modularity in the requirement for flux through the vac-uolar protein secretion pathway.
Tight phenotypic clustering was observed for strains carrying deletions of the structural subunits of the vacuolar H+ -ATPase (VMA1, VMA2, VMA5, VMA7, VMA8, VMA6, VMA10, CUP5) (Figure 1 (cluster 5), see also Additional data file 10). Each of the subunits is essential for assembly and thus function of the complex [40]. Overall, the interactions appeared weak and non-selective, suggesting that the result of losing the vacuolar H+-ATPase is additive (see Figure 3b).
An example of a protein complex that does not function quan-titatively as a discrete biomodule is the GIM complex (PAC10,
YKE2, PFD1, GIM5, GIM4, GIM3), which is involved in
protein folding and maturation of tubulin and actin [63,64]. Only four of the six subunits (PAC10, YKE2, PFD1, GIM5) were identified in the 150 mM hydroxyurea screen (see Addi-tional data file 11). Though similarities in the interaction
profiles exist (Figure 6c), the relatively pleiotropic phenotypic effects of deleting genes of the GIM complex suggest that this complex is less modular than others in buffering growth against diverse perturbations.
Clustering sub-analysis highlights modular properties of pathways
The conclusions above about biomodules were based on enrichment of related genes within phenotypic clusters. How-ever, genes of the same pathway may have opposite effects on pathway output, in which case phenotypic effects of gene deletion should not cluster together. For a more pathway-focused view, all genes were classified within broad categories of cellular function (gene expression, vesicular trafficking, cell polarization, DNA replication and cell metabolism) based on the literature (see Additional data file 11), and the subsets were individually clustered (Figure 6, and Additional data file 12).
The following broad conclusions drawn from the entire data-set (Figure 4) were confirmed. First, most strains deleted for known DNA replication genes interacted synergistically and selectively with the DNA synthesis inhibitors HU and cispla-tin (Figure 6b,6c). Second, it appears that deletion of damage-sensing/checkpoint genes caused less synergism than loss of homologous recombination, particularly in response to cispl-atin (Figure 6b). Third, genes involved in chromosome struc-ture and movement showed quantitative effects comparable to the damage-sensing genes, but with less selectivity (Figure 6c). Fourth, strains defective in vesicular trafficking revealed interactions with many of the perturbations tested, the subset of vps deletions being notable for having more selective and stronger phenotypic interactions with HU and cisplatin (Fig-ure 6a).
The pathway-oriented sub-analysis also highlighted cluster-ing features that are less obvious when the entire dataset is analyzed (Figure 4). For example, Figure 6a recapitulates clusters 3 and 5 (from Figure 4), both composed of vesicular trafficking genes, while Figure 6b recapitulates clusters 2 and 9a, composed of genes required for DNA damage repair (Fig-ure 6). It appears that these clusters have similar selectivity yet are quantitatively distinct as judged by strength of interaction. Overall, deletion of genes functioning in gene expression, cell polarization and cellular metabolism gave less modular phenotypic profiles, reflecting more pleiotropic interactions between deletions within these classes of genes Pathway modularity, assessed by subclustering of GI data involving genes of known function for protein trafficking or DNA replication
Figure 6 (see previous page)
as a function of changing cellular context (see Additional data file 12).
Discussion
Global analysis of gene interactions provides insights into the robustness of biological systems [5,6,12]. When alteration of a gene is phenotypically synergistic with a perturbation, it indicates that the unaltered gene can buffer the phenotype against that perturbation [5]. Most work on global functional
analysis of yeast phenotypes has relied upon experimental features unique to yeast, such as barcoded deletion alleles [17], on indirect measures of growth, such as PCR or microar-ray hybridization [17,65], or has recorded interactions quali-tatively or subjectively [6,8,29,66]. To enhance opportunities for computational modeling of gene-interaction networks, we present a systematic approach for the quantification of phe-notype modification.
The yeast deletion array is now an unparalleled resource for such analysis; however, the experimental method could be applied to any genetically defined cellular array (for example, with RNA interference). Furthermore, the statistical tools deployed provide a standard method of reporting gene-inter-action quantities, which may help discount the effect of exper-imental variations due to different perturbations, different laboratories, and even different cell types. Given the essen-tially infinite combinatorial complexity of gene interaction and the quantitative continuum of phenotypic effects, the need for high-throughput and quantitative phenotyping is perhaps superseded only by the need for statistically compa-rable data that can be easily stored, shared, mined and inte-grated with other genomic data [67,68].
The phenotypic array method presented here easily accom-modates parallel analysis of around 24,000 independent cul-tures per experiment. We used AUGC as a growth measure, incorporating rate and final yield into a single quantity (see Figure 2); the analysis could, however, be modified to exam-ine interactions with respect to other parameters of growth. The GI sensitively and specifically screens for non-additive effects (see Additional data files 8, 12). Phenotypic slopes are used to derive an Interaction Index, which precisely quanti-fies interactions, thus confirming or refuting screening results (see Figures 1, 3, and Additional data file 12). Cluster-ing of GI data was useful for identifyCluster-ing biomodules, as were gene annotations for interpreting their relatedness (see Fig-ures 4, 5, 6, 7).
The experimentally derived topology of gene interactions is complex [6,12,29]. What is the full complement of genes required to buffer a particular perturbation, and what is the relative importance of each gene? Conversely, what is the full range of phenotypic effects that a single genetic or environ-mental perturbation can induce? How do the properties of gene interaction networks change as a function of time and intensity of perturbation? The complex nature of these ques-tions calls for quantitative answers [1-5,8,9].
[image:12.612.58.299.127.575.2]For experimentally deriving gene-interaction networks, what is the appropriate balance between qualitative breadth and quantitative depth of data acquisition and analysis? Anecdo-tal comparison of this work to that of Parsons et al. [29] suggests that this is an important consideration. Parsons et al. [29] analyzed a 69 (12 chemical-genetic and 57 gene-gene) × 5,000 (number of deletion strains) array of interactions
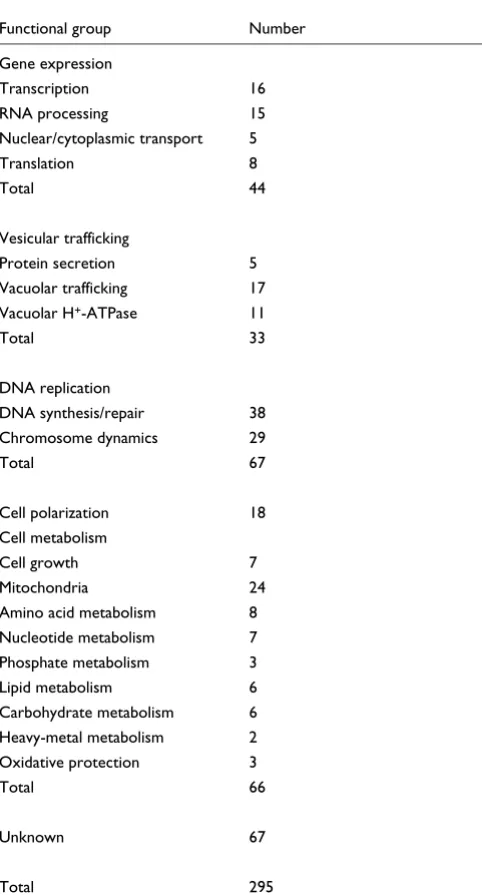
Table 2
Classification of all HU-selected strains, according to gene
annotation [46-48]
Functional group Number Gene expression
Transcription 16 RNA processing 15 Nuclear/cytoplasmic transport 5 Translation 8
Total 44
Vesicular trafficking
Protein secretion 5 Vacuolar trafficking 17 Vacuolar H+-ATPase 11
Total 33
DNA replication
DNA synthesis/repair 38 Chromosome dynamics 29
Total 67
Cell polarization 18 Cell metabolism
Cell growth 7 Mitochondria 24 Amino acid metabolism 8 Nucleotide metabolism 7 Phosphate metabolism 3 Lipid metabolism 6 Carbohydrate metabolism 6 Heavy-metal metabolism 2 Oxidative protection 3
Total 66
Unknown 67
Total 295
comm
en
t
re
v
ie
w
s
re
ports
refer
e
e
d
re
sear
ch
de
p
o
si
te
d r
e
se
a
rch
interacti
o
ns
inf
o
[image:13.612.57.551.85.702.2]rmation
Figure 7 (see legend on next page)
De novo
purine synthesis
(Degradation)
Glycine
TCA
cycle
Aspartate
Threonine
Glutamate
OAA
RNR
dNTPs
Threonine
uptake
Cell
growth
HU
DNA replication
DNA damage sensing
Mitochondrial
stress
DNA repair
Cell cycle
control
Chromosome
transmission
Plasma
membrane
synthesis
Vacuolar protein sorting/
protein secretion/
protein synthetic flux
Sister chromatid
cohesion
Microtubule
associated
Double-strand
DNA breaks
Single-strand
DNA
1
2
3
4
5
6
7 8
9
10
11
compared to our analysis of a 1 (HU) × 5,000 array plus a 5 (number of other drugs) × 300 (number of strains selected from genome-wide screen) array. Thus, qualitatively, the Par-sons data represents an approximately 50-fold increase in qualitative gene-interaction data. On the other hand, our analysis of HU entailed a genomic screen at three concentra-tions of HU (0, 50 and 150), and then further testing of 300 selected strains on 10 different HU concentrations and three different concentrations of the other four drugs, so our study represents about a fivefold increase in 'quantitative' data. Regarding gene-interaction networks and modularity, related but different observations and interpretations emerged.
First, both studies identified the vacuolar H+-ATPase as a functional module. While Parsons et al. [29] implicated this function in multidrug resistance, our data suggest such effects are additive with HU (Figures 1, 3) [4,9,28]. Further data from Parsons et al. [29] indicate that the vacuolar H+ -ATPase interacts more strongly with cyclosporin, FK506 and tunicamycin than with HU, but more weakly with camptothecin, benomyl, fluconazole and cycloheximide, sug-gesting that quantitative analysis of perturbations other than HU might reveal non-additive interactions between the vacu-olar H+-ATPase mutants and these other perturbations (assuming perturbations of equivalent strength were used in the analysis of Parsons et al. [29]).
Second, Parsons et al. [29] concluded from ERG2, ERG3, ERG4 and ERG6 interactions that ergosterol synthesis affects multidrug resistance. Our work suggests that ERG3 is distinct from the other ergosterol genes in the context of HU, showing much stronger synergism as well as selectivity for interaction with HU compared to cisplatin (see Figure 5, and Additional data files 7, 12). The erg deletion strain interaction pheno-types seemed more pleiotropic than modular in our work, varying according to the gene deleted and the particular per-turbation [69].
Third, from our work, vacuolar protein sorting (VPS) buffers growth against multiple inhibitory perturbations (see Figures 3c, 5a, and Additional data file 11) [29]. Of the 10 vps strains (vps3, vps9, vps15, vps16, vps28, vps33, vps34, vps45, pep7,
and pep12) we found, nine are related functionally by their effects on vacuolar morphology and predicted requirement for protein synthetic flux [30,62], suggesting modularity within this class of more than 40 genes. In addition, we iden-tified synergistic interactions between HU and 'endosome-to-vacuole trafficking' (chc1, clc1, end3 deletion strains), per-haps also required for protein secretion flux [30]. Parsons et al. [29] also reported chemical-genetic interactions involving several vacuolar protein sorting deletion strains, but not with HU or camptothecin (see Figure 5 and discussion below). Furthermore, only VPS16 was overlapping with our set in the actual VPS genes proposed by Parsons et al. [29] (VPS16,
VPS25, VPS36, VPS67, VAM7, VAM6, STP22, SNF7, DID4,
IES6) to be involved in multidrug resistance [29]. We did find IES6 to interact strongly, but did not classify it as a VPS gene.
Fourth, the GIM complex (prefoldin actin/tubulin chaper-one) (GIM3, GIM4, GIM5, PFD1, YKE2, PAC10) provides another example of contrast between quantitative and quali-tative data [64]. Each study found multiple subunits to inter-act; however, Parsons et al. [29] found interactions to be benomyl-specific, while we found PAC10 and YKE2 to inter-act with HU and cisplatin (see Additional data files 6 (part C), 9). GIM5 and PFD1 were recovered from our screen, but were weaker interactions in confirmatory tests (see Additional data file 12). Thus our data indicate that there are more pleiotropic interactions than do the data of Parsons et al. [29], possibly suggesting differential requirements for each gene in the mat-uration of actin and/or tubulin structural proteins [64] and probably involvement of the GIM complex in buffering cell growth against a variety of inhibitory perturbations.
Fifth, both studies found homologous recombination and DNA-damage checkpoint signaling to be modular (Figures 5, 6) [29]. Our quantitative data permit the further conclusion that homologous recombination interacts much more strongly with HU, on the basis of comparison of the interac-tion index of the recombinainterac-tion group (RAD50 (-265),
RAD51(-171), RAD54(-178), RAD55(-138), RAD57(-179),
MRE11(-304), and XRS2 (-242)) with those of the checkpoint group (MRC1 (-14), RAD24 (-19), RAD17 (-21), RAD9 (-7), and DDC1 (-30)) (see Additional data file 12). It may be that A speculative model for buffering against perturbation of deoxynucleoside triphosphate (dNTP) synthesis, based on interconnected genetic modules found to interact with HU
Figure 7 (see previous page)
comm
en
t
re
v
ie
w
s
re
ports
refer
e
e
d
re
sear
ch
de
p
o
si
te
d r
e
se
a
rch
interacti
o
ns
inf
o
rmation
functional redundancy among the checkpoint genes partially compensates for loss of these genes in response to HU, while it appears there is no such redundancy (except for RAD59 (-7)) among homologous recombination genes. In this regard it was interesting that partial deletion of MRC1 (YCL060c (-42)) interacted more strongly than complete deletion (YCL061c (-14)), suggesting a dominant-negative effect of the partial gene (see Additional data file 11).
Sixth, the respective studies found overlapping sets of genes required to tolerate HU and camptothecin [29], or HU and cisplatin (Figure 4). By using a continuous scale for quantify-ing interactions, we are able to distquantify-inguish relative strength and specificity of interaction (Figure 4, clusters 7 and 9b, and see Additional data file 4), which should enhance capabilities for computational modeling of gene interaction networks. The Parsons analysis [29] used a binary scale of interaction for cluster analysis, so did not make quantitative distinctions. However, Parsons et al. [29] included a wealth of qualitative interaction data, allowing comparison between chemical-genetic and gene-gene interaction clusters.
Seventh, there is a set of possibly interconnected modules from our dataset, which was essentially absent from Parsons et al. [29] We found all genes of threonine synthesis (AAT2, HOM3, HOM2, HOM6, THR1, THR4), several mitochondrial genes (ATP5, RML2, TOM37, SSQ1), genes involved in tricar-boxylic acid (TCA) cycle regulation via retrograde signaling (RTG1, RTG2, RTG3, MKS1), and genes involved in amino-acid permease trafficking (LST4, LST7). A model connecting these modules is presented in Figure 7 and discussed below.
Understanding quantitative differences adds another dimen-sion to interpreting the biological significance of gene interac-tion. Considering the cell as a highly interconnected and buffered genetic system, whenever a gene alteration occurs which predisposes a cell to cancer, for example, it also reduces the same cell's resistance to perturbations that the altered gene normally buffers against. In this example, the strength and specificity of synergism between gene loss and drug per-turbation essentially determines therapeutic efficacy and tox-icity. This principle of gene interaction has been proposed for drug discovery [70].
What is the biological basis for the interaction between vacu-olar trafficking and DNA replication/repair? A possible clue comes from work on VID31/DEF1, initially identified by its requirement for targeting fructose bisphosphatase (FBPase) to the vacuole for degradation upon exposure to glucose ([71] and Randy Brown, personal communication), but recently renamed DEF1 on the basis of its association with RAD26 and its suspected role in coordinating transcription-coupled repair of DNA damage and ubiquitin-mediated degradation of RNA polymerase II [72]. Our work shows that VID31 dele-tion interacts synergistically with a broad range of perturba-tions, but like other vacuolar-trafficking deletion strains has
relative specificity for HU and cisplatin (Figure 6a). Recent work shows that FBPase is degraded via both the ubiquitin-proteasome-dependent cytosolic route and the vacuolar route [73], and that some genes are common to both pathways [73,74]. Thus, VID31/DEF1 appears to have multiple func-tions, and further investigation of the gene interactions in this module may shed new light on the potential links between vacuolar and ubiquitin-mediated degradation pathways as well as the organization of these pathways in coordinating transcriptional control, protein degradation and DNA repair.
How might threonine synthesis buffer cell growth against the effects of HU? Almaas et al. [60] used flux balance analysis [75] to discover that overall metabolic activity is dominated by a small number of reactions, forming a high-flux back-bone, over which metabolism is reprogrammed to optimize growth as nutrient conditions change. Threonine synthesis was found to be a major connection on this backbone, which linked respiration and the TCA cycle (which produces the threonine substrate aspartate) to purine metabolism (via catabolism to glycine with formation of one-carbon reducing equivalents) and membrane lipid synthesis. Our data support the existence of a high-flux backbone in eukaryotes (see Fig-ure 7 and discussion above).
We propose the following speculative working hypothesis. The effect of reducing cellular nucleotide causes mitochon-drial stress, either by perturbing mitochonmitochon-drial replication or by other, undefined, means [21]. Retrograde signaling through RTG1, RTG2, RTG3 and MKS1 then acts to transcrip-tionally upregulate the TCA cycle [54,55], providing increased aspartate for threonine synthesis along the pathway of HU-interacting genes AAT2, HOM3, HOM2, HOM6, THR1 and THR4. Threonine is then catabolized to glycine which, along a high-flux backbone [60], is used to increase purine synthesis and thus augment dNTP production by RNR. To utilize external sources of threonine for the same purpose, LST4 and LST7 regulate amino-acid uptake ([58] and Figure 7). Finally, RTG2, through its interaction with LST8 (an essential gene that functions with LST4 and LST7) [59], coor-dinates retrograde signaling and permease transport in regu-lating threonine catabolic flux, which we propose contributes to buffering of dNTP pools (Figure 7).