H u m a n a n n o y a n c e , a c c e p t a bility
a n d c o n c e r n a s r e s p o n s e s t o
vi b r a ti o n fr o m t h e c o n s t r u c ti o n
of lig h t r a p i d t r a n si t lin e s in
r e si d e n ti al e n vi r o n m e n t s
Wo n g-M c S w e e n ey, DBC, Woo d c o c k , JS, P e ri s, E , Wa d di n g t o n , DC,
M o o r h o u s e , AT a n d R e d el-M a ci a s, M D
h t t p :// dx. d oi.o r g / 1 0 . 1 0 1 6 /j. s ci t o t e nv. 2 0 1 6 . 0 1 . 1 2 1
T i t l e
H u m a n a n n o y a n c e , a c c e p t a b ility a n d c o n c e r n a s r e s p o n s e s
t o vi b r a tio n f r o m t h e c o n s t r u c ti o n of lig h t r a p i d t r a n si t
li n e s i n r e si d e n ti al e n vi r o n m e n t s
A u t h o r s
Wo n g-M c S w e e n ey, DBC, Woo d c o c k, JS, P e ri s, E,
Wa d di n g t o n , DC, M o o r h o u s e , AT a n d R e d el-M a ci a s , M D
Typ e
Ar ticl e
U RL
T hi s v e r si o n is a v ail a bl e a t :
h t t p :// u sir. s alfo r d . a c . u k /i d/ e p ri n t/ 3 7 8 8 7 /
P u b l i s h e d D a t e
2 0 1 6
U S IR is a d i gi t al c oll e c ti o n of t h e r e s e a r c h o u t p u t of t h e U n iv e r si ty of S alfo r d .
W h e r e c o p y ri g h t p e r m i t s , f ull t e x t m a t e r i al h el d i n t h e r e p o si t o r y is m a d e
f r e ely a v ail a bl e o nli n e a n d c a n b e r e a d , d o w nl o a d e d a n d c o pi e d fo r n o
Human Annoyance, Acceptability and Concern as
Responses to Vibration from the Construction of Light
Rapid Transit Lines in Residential Environments
ID. Wong-McSweeney,a,∗, J. S. Woodcocka, E. Perisa, D. C. Waddingtona,
A. T. Moorhousea, M.D. Redel-Mac´ıasb
aAcoustics Research Centre, University of Salford, Salford, M5 4TW, UK bDep. Rural Engineering Campus de Rabanales, University of C´ordoba,
C´ordoba, Spain
Abstract
The aim of this paper is to investigate the use of different self-reported measures for assessing the human response to environmental vibration from the construc-tion of an urban LRT (Light Rapid Transit) system. The human response to environmental stressors such as vibration and noise is often expressed in terms of exposure-response relationships that describe annoyance as a function of the magnitude of the vibration. These relationships are often the basis of noise and vibration policy and the setting of limit values. This paper examines mea-sures other than annoyance by expressing exposure-response relationships for vibration in terms of self-reported concern about property damage and accept-ability. The exposure-response relationships for concern about property damage and for acceptability are then compared with those for annoyance. It is shown that concern about property damage occurs at vibration levels well below those where there is any risk of damage. Earlier research indicated that concern for damage is an important moderator of the annoyance induced. Acceptability, on the other hand, might be influenced by both annoyance and concern, as well as by other considerations. It is concluded that exposure-response relationships expressing acceptability as a function of vibration exposure could usefully
com-∗Corresponding author
plement existing relationships for annoyance in future policy decisions regarding environmental vibration. The results presented in this paper are derived from data collected through a socio-vibration survey (N = 321) conducted for the construction of an urban LRT in the United Kingdom.
Keywords: Light Rapid Transport, Vibration, Construction, Acceptability,
Concern, Annoyance, Exposure-Response Relationship.
1. Introduction
Preparations in the EU and other regions for transferring traffic from road to rail mean that huge investments are currently being put into railway infras-tructure to achieve a higher capacity. Railway has been promoted over other means of transport due to its environmental friendliness and competitiveness.
5
However, the construction of new railways is not always welcome. Building large railway infrastructure involves complex construction operations that are some-times performed during the whole day, generating high levels and durations of noise and vibration. Vibrations due to construction activity have been shown (Waddington et al., 2011; Woodcock et al., 2011a) to be the cause of
excep-10
tionally high annoyance and objections. This means that for the sustainable development of these infrastructures the human response to those construction operations needs to be better understood and managed.
Compared with environmental noise, the human response to environmental vibration is a relatively less developed area of research. This is partly because
15
of the limited number of studies, but also because studies have used different metrics for the characterisation of vibration and different human response scales (Waddington et al., 2014). The strength of vibration on building floors is the key parameter to assess the effect of vibrations on humans inside the building. It is required for the prediction of the human response in future planning situations
20
Guidance available for the assessment of human response to vibration varies from country to country in the form of national and international standards
25
(e.g. BS 6472:2008; ISO 2631-2:2003). There is currently no consensus as to the most appropriate single figure descriptor of vibration exposure or appropriate criteria to prevent adverse effects. Since the criteria on which the assessment methods advocated in these standards are often derived from psychophysical investigations performed in laboratory conditions and borrowed from the noise
30
field (e.g. ISO15666:2003), it is not clear whether they are relevant for assessing the adverse impacts of vibration in residential environments. These difficulties have consequently hampered policy and standard development in this field, and also affect the consistent application of current policy and standards.
Self-reported annoyance as a response to a stimulus is often used in the field
35
of acoustics to form exposure-response relationships. The annoyance of vibra-tion has been studied in the laboratory and this has gone on to inform navibra-tional and international standards (e.g. BS 6472-1:2008, BS 5228-2:2009). The method for measuring annoyance due to noise exposure in socio-acoustics field surveys is standardised in ISO 15666:2003 and these methods have recently been adopted
40
for socio-vibration surveys. As is it more difficult to measure vibration annoy-ance in the field, less research has been completed in residential environments. More recent studies have been carried out regarding the annoyance of vibra-tion from transport in residential areas (Klæboe et al., 2003; Waddington et al., 2014). Objective parameters of exposure do not fully account for the annoyance
45
reported from vibration (Peris et al., 2014; Sharp et al., 2014; Janssen et al., 2015; Woodcock et al., 2015 under review), a finding that applies to annoyance from noise too (Guski et al., 1999).
Attitudinal factors such as future expectations of vibration levels and con-cern about property damage constitute the most important parameters for
rail-50
under-standing attitudinal factors it is proposed that adverse reactions can be reduced
55
or avoided more cost-effectively than by reducing exposure levels. For example, residents could be educated how low vibration levels are not likely to cause dam-age to their property, therefore increasing the public acceptance of the vibration source.
Public acceptance has been studied for sustainable energy technologies
be-60
cause it is crucial for their successful introduction into society (Upham et al., 2015). Devine-Wright (2007) details how public acceptance is recognised as an important issue shaping the widespread implementation of renewable energy technologies and the achievement of energy policy targets. That work argues for inter-disciplinary research combining qualitative and quantitative approaches,
65
using social research methods with emphasis on the symbolic, affective and discursive nature of beliefs about these technologies. Huijts et al. (2012) put forward a framework of citizen acceptance based on a review of psychological theories and on empirical studies. In the framework the acceptance of a citizen, a person affected by the placement of a technological object controlled by others,
70
is influenced by their attitude as well as by personal and social norms. Their at-titude is formed from positive and negative feelings towards sustainable energy technology and both attitude and personal norms are influenced by perceived costs, risks and benefits. Trust and fairness also play into citizen’s attitudes. Public acceptance is considered the most important barrier in studies of urban
75
road pricing (Grisol´ıa et al., 2015).
With regard to noise, public acceptance has long been an approach favoured by the aircraft (Bauer et al., 2010) and rotorcraft industries (Leverton and Pike, 2007). Acceptance through public engagement measures have also been carried out for wind farms. Toke (2003) emphasises the benefits of sensitivity
80
to a local community from the developer and of a more open and proactive dialogue between the wind industry and local communities. To increase public acceptance of sustainable transportation systems, Pridmore and Miola (2011) recommend measures such as gaining trust from the public, informing the public in a transparent manner, seeing operations in action, improving the perception
of benefits and enhancing positive media coverage. Further study, however, is needed to establish the effectiveness.
It is suggested that along with annoyance, concern about property dam-age and acceptability could be useful measures of human response to vibration. Guidance for limiting vibration is based on prevention of damage to property.
90
A measurement of people’s concern about property damage in response to vi-bration would therefore be useful in allaying those concerns through prior com-munications. With regard to generating policy around vibration it is arguably easier to interpret people’s response using acceptability than annoyance. Even if a vibration is annoying to someone, they may none the less find it acceptable
95
if there is the prospect of future gain and therefore they may not complain. In this paper, the self-reported human response to vibration from the con-struction of an urban LRT (Light Rapid Transit) system is investigated, specif-ically the question of whether acceptability and concern are viable measures of the human response. Firstly the paper describes the methods used to collect the
100
data using field measurements of vibration exposure and responses from face-to-face questionnaires. Next the statistical analyses are described and the results expressed as response relationships: annoyance, exposure-concern about property damage (hereon concern) and exposure-acceptability. The results are then discussed with a particular emphasis on their proposed
105
application in further work to address contemporary challenges involving envi-ronmental vibration.
2. Methodology
2.1. Study Design
The data used in the paper were collected for the Defra project: The Human
110
the North-West of the England in 2010 during the construction/extension of a
115
Light Rapid Transit (LRT) system.
The construction/extension of a LRT was chosen since at each point along the line, a repeated cycle of activities was carried out. This was important as residents at one end of the line would have experienced the full construction cycle and could be surveyed without introducing a bias from the vibration survey.
120
Vibration measurements of the full construction cycle could at the same time be undertaken further down the line.
Candidate sites were chosen, using online mapping services, and then re-connoitered to assess their suitability as survey sites. It was important that sites did not have other significant sources of vibration and were at appropriate
125
stages of the construction process. It was also important that there was a mix of construction activities and that there were enough residences within 100 m. Three sites were found to meet the requirements. There were 350 dwellings in the sample.
2.2. Vibration Exposure 130
It is recommended by standards BS 6472-1:2008 (evaluation of human ex-posure to vibration in buildings) and ISO 2631-2:2003 (evaluation of human exposure to whole body vibration) that vibration is measured over a 24 hour period at the centre of the room where the greatest vibration magnitude is per-ceived. Due to the number of responses, vibration exposure was estimated using
135
a technique combining measurements and estimation. The vibration measure-ment instrumeasure-mentation used were Guralp CMD-5TD three axis force feedback accelerometers. These have low noise-floors (∼1×10⁻⁶ ms−2 at relevant
fre-quencies) and were synchronised using GPS signals.
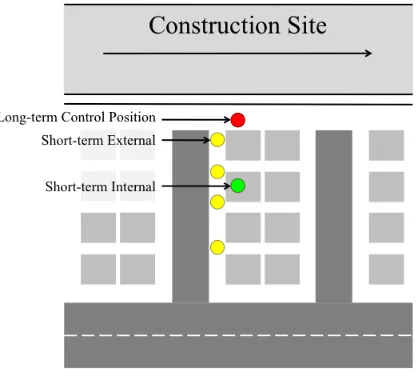
The diagram in Figure 1 illustrates where long and short-term measurements
140
long and short-term measurements the ground attenuation was characterised
145
[image:9.612.205.414.183.372.2]using the Bornitz equation (Woods, 1997) and the long-term internal vibration exposures estimated.
Figure 1: Diagram showing an overview of the construction vibration measurements setup.
Validation was made comparing the measured internal and predicted levels inside a property 35 m from the construction source. The measured, weighted (Wmunspecified body orientation), root-mean-square (rms) acceleration inside 150
the property was found to be 0.013 m/s2; the predicted Wm weighted rms
acceleration inside the property was 0.019 m/s2. The difference in the measured and predicted values therefore represents a relative error of 3.3 dB. The locations characterised enabled the simulation of the 24 hour internal vibration in 321 dwellings from the 350 in the sample. From the acceleration data the Vibration
155
Dose Value (VDV) was calculated. This was chosen both because it is the vibration exposure descriptor outlined in standard BS 5228-2:2009, and because it was previously reported that for railway vibration there is no evidence for a particular benefit to using one descriptor over another (Waddington et al., 2014). As the exposures were estimated using distance curves, different descriptors were
160
2.3. Survey Data
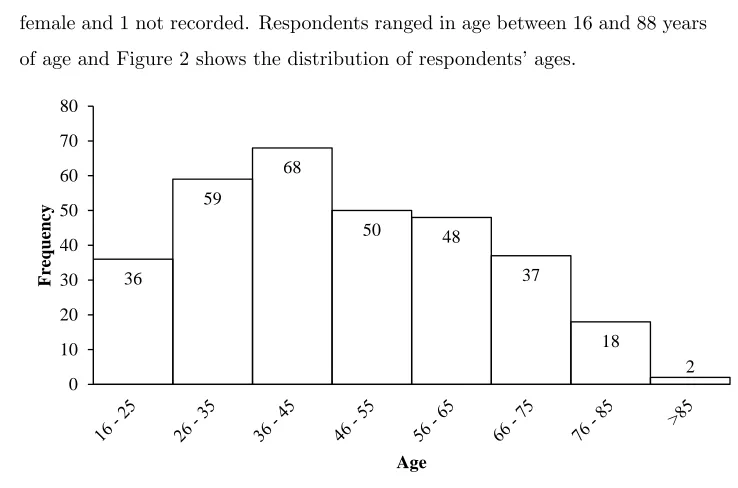
Responses were collected from 350 residences across the three locations, A (161 residences), B (124 residences) and C (65 residences), with 133 male, 216 female and 1 not recorded. Respondents ranged in age between 16 and 88 years
165
of age and Figure 2 shows the distribution of respondents’ ages.
33 92 72 53 74 22 4 36 59 68
50 48
[image:10.612.124.493.177.421.2]37 18 2 0 10 20 30 40 50 60 70 80 F re quenc y Age
Figure 2: Distribution of ages in this study. 32 ages were not reported and are not included in the chart.
All three locations were on the outskirts of a large city and therefore rela-tively urban. The same LRT lines were being constructed at each location but intrinsic differences between each location would have resulted in some differ-ences in construction activities. The light-railway lines were being constructed
170
along disused railway cuttings behind residences at locations A and C but along the main road at location B. As a result of these differences the disruption to people’s daily lives would have been different between locations.
2.4. Questionnaire
Having designed and pilot tested the questionnaire it was peer reviewed by
175
were conducted face-to-face to avoid self-selection bias and only one person per household was interviewed, namely the person who answered the door. If the person to answer was under 16 then the next person was asked. Respondents also had to have been living at the residence for more than 9 months.
180
To avoid bias regarding vibration, the survey was introduced as a neighbour-hood satisfaction survey so the first few sections were about their neighbourneighbour-hood and home. The wording of the questions regarding annoyance, concern about property damage and acceptability were of particular importance and are out-lined below.
185
Annoyance: The questions relating to levels of annoyance used a five point semantic scale and the question: “Thinking about the time you have been living here, when indoors at home, how bothered, annoyed or disturbed have you been
by feeling vibration or shaking or hearing or seeing things rattle, vibrate or shake 190
caused by construction activity, including demolition, piling road works, drilling,
surface activity such as bulldozers and loading trucks and any other construction
activity? Would you say not at all (1), slightly (2), moderately (3), very (4) or
extremely (5)?”.
Concern About Property Damage: The question used to ascertain levels
195
of concern about property damage was: “We would like to know if you are concerned that the vibration may damage this home or your possessions inside
it in any way. Are you: No - Not at all (1), Yes - Slightly (2), Yes - Moderately
(3), Yes - Very (4), Yes - Extremely (5)”.
Acceptability: The question used to measure how acceptable residents
200
found vibration was: “Looking at this scale and given all that you have said, in the time you have been living here, how acceptable have you found the level
of vibration you have experienced in this home. Would you say it has been
very acceptable, acceptable, neither acceptable nor unacceptable, unacceptable
or very unacceptable? Very acceptable (1), Acceptable (2), Neither acceptable 205
nor unacceptable (3), Unacceptable (4), Very unacceptable (5)”.
via noticing vibration or noticing rattling or shaking as a result of vibration. If a respondent reported not feeling vibration nor any effects of vibration (e.g. rattling) they were not subsequently they were about property damage nor how
210
acceptable they found the vibration. A default score of ‘0’, i.e. no score, was then recorded for these questions that people had been routed away from. Later, during the analysis, these scores were recoded to a ‘1’, the lowest category. There were 249 responses regarding acceptability.
2.5. Statistical Analyses 215
The programme SPSS (IBM SPSS Statistics v.20) was used to archive and analyse the survey data. Following the work of Peris et al. (2014) and Klæboe et al. (2003) an ordinal logistic regression was used to model the data and gen-erate parameter estimates for each dependent variable threshold (e.g. not at all, slightly annoyed, moderately, very and extremely annoyed). Parameters were estimated using a Maximum Likelihood Estimation (MLE) and they are consis-tent and asymptotically multinomial. Putting these parameters into Equation 1 indicates the probability of having a response equal to or greater thanj.
P(Y ≥j|Xi−xi) = 1−
eτj−βxi
1 +eτj−βxi
wherej∈[1, ..., J−1] (1)
whereτj corresponds to the jth estimated threshold andβ is a vector of
esti-mated parameters for both the vibration exposure. Jis the number of dependent variable categories andXi is a vector of independent variables containing the
exposure. For example, in applying this to the relationship between vibration exposure and annoyanceτj are the annoyance thresholds,β would be a vector 220
with the estimated coefficients relating the exposure to annoyance. xi would be
a vector of exposure values and modifying variables for an individuali. In using ordinal logistic regression the assumption of proportional odds is implicitly made. The validity of this assumption was tested via the test of parallel lines. This compares the use of one set of coefficients over all thresholds
225
the general model (different thresholds) was rejected with significance greater than 0.1.
Each model was judged by the change in the pseudoR2. In particular the
230
Cox & Snell R2
pseudo and Nagelkerke R 2
pseudo were used. For linear regression
theR2value describes the proportion of variance in the dependent variable that
is described by the predictor variable, however this is not the same for logistic regression. Instead only the relative improvement of one model over another can be judged using the pseudoR2 values.
235
3. Results
Table 1 presents the descriptive statistics for the semi-empirically generated vibration dose value (VDV) used in this study.
Table 1: Descriptive statistics for the vibration dose value (VDVm,24h) generated
semi-empirically in this work.
N Range Minimum Maximum Mean Std. Dev. Variance 321 0.0737 0.0002 0.0739 0.0224 0.0218 0.0005
3.1. Exposure-Annoyance Relationship
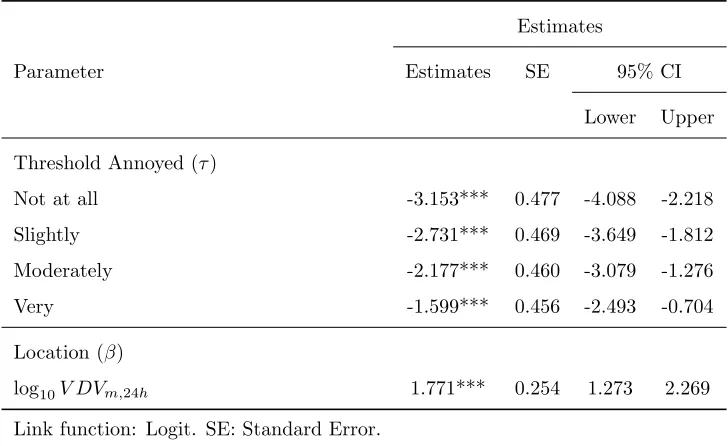
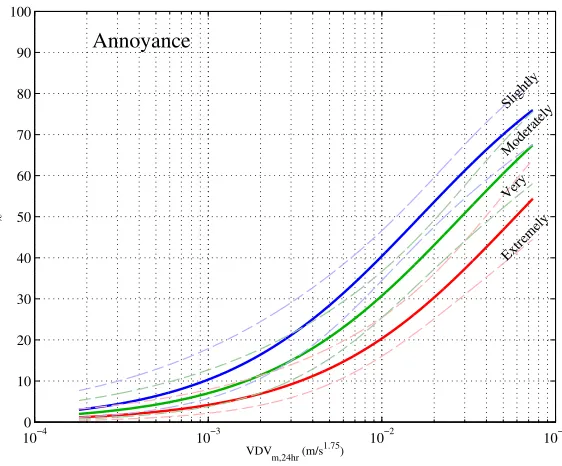
From the ordinal logistic regression relating exposure, log10VDVm,24h(m/s1.75), 240
and annoyance the parameters in Table 2 were estimated. Figure 3 shows the proportion of people who reported as beingExtremely Annoyed, Very Annoyed,
Moderately Annoyed orSlightly Annoyed in response to construction vibration.
The lines delineate the boundaries between each of the categories. Also drawn on the graph are the 95% confidence intervals. The graph shows that as the
245
exposure increases the greater the proportion of respondents who were annoyed at a higher level. The Cox & Snell R2
pseudo value is 0.17 against which later
Table 2: Estimated parameters for the prediction of annoyance by construction vibration exposure.
Estimates
Parameter Estimates SE 95% CI
Lower Upper Threshold Annoyed (τ)
Not at all -3.153*** 0.477 -4.088 -2.218
Slightly -2.731*** 0.469 -3.649 -1.812
Moderately -2.177*** 0.460 -3.079 -1.276
Very -1.599*** 0.456 -2.493 -0.704
Location (β)
log10V DVm,24h 1.771*** 0.254 1.273 2.269
Link function: Logit. SE: Standard Error. Cox & SnellR2
pseudo= 0.165, NagelkerkeR 2
pseudo= 0.178
*p <0.1, **p <0.01, ***p <0.001
3.2. Exposure-Concern Relationship
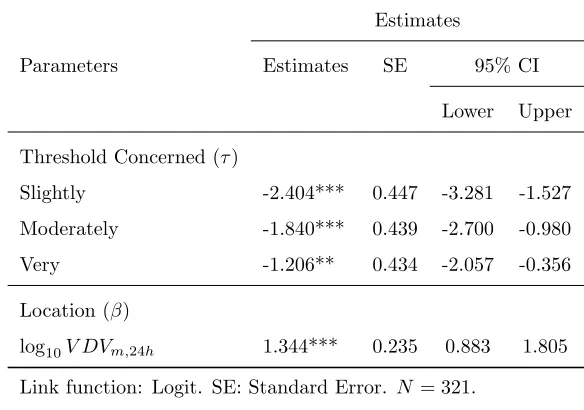
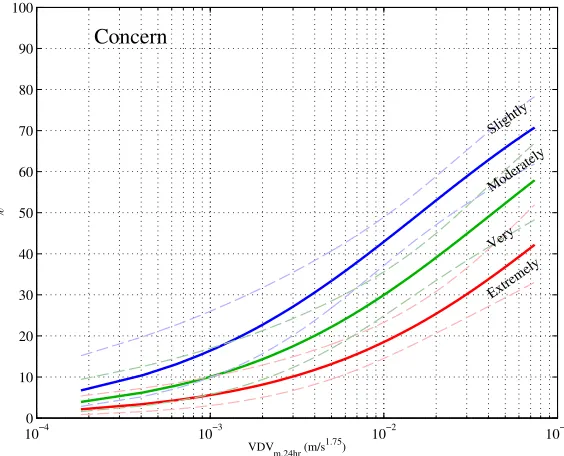
Table 4 presents the estimated parameters for the relationship between
ex-250
posure and concern about property damage. Figure 4 presents the exposure-response curves for the proportion of respondents who were at least Slightly
Concerned, Moderately Concerned andHighly Concerned along with their 95%
confidence intervals.
As with annoyance when vibration exposure increases so does the proportion
255
of respondents who report as concerned at a higher level. The Cox & Snell
R2pseudo value is around 0.11, somewhat less than the 0.17 for annoyance.
3.3. Exposure-Acceptability Relationship
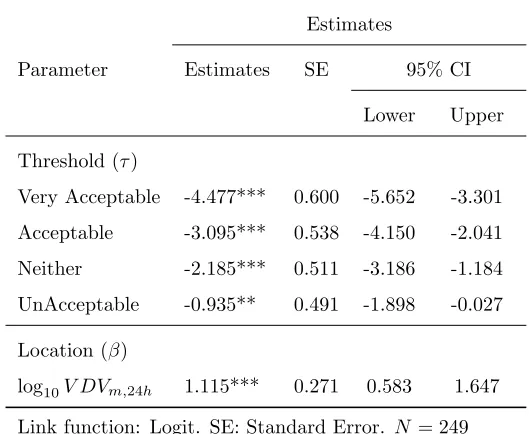
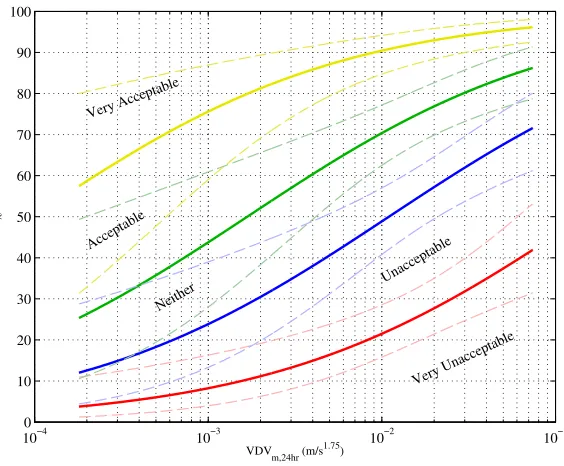
Table 4 presents the estimated parameters for the relationship between vi-bration exposure and acceptability. Figure 5 presents the proportion of
respon-260
10−4 10−3 10−2 10−1 0
10 20 30 40 50 60 70 80 90 100
%
VDV
m,24hr (m/s 1.75)
Slightly
Moderately
Very
Extremely
[image:15.612.164.445.126.359.2]Annoyance
Figure 3:Exposure-Response curves showing the proportion of people who are Extremely An-noyed, Very AnAn-noyed, Moderately Annoyed and Slightly Annoyed by construction vibration.
The dashed lines represent 95% confidence intervals.
Unacceptable or Very Unacceptable. With greater exposure, the greater the
proportion of people reporting it as unacceptable.
4. Discussion
In this work, the subjective responses of residents living near to construction
265
sites were compared to semi-empirical estimations of the vibration. Using a questionnaire the responses were measured in three ways: 1. level of annoyance; 2. level of concern about property damage and 3. level of acceptability. Using ordinal logistic regression, exposure-response relationships between vibration and each of the responses were derived and comparisons made of the three.
270
Table 3: Estimated parameters for the prediction of concern about property damage by con-struction vibration exposure.
Estimates
Parameters Estimates SE 95% CI
Lower Upper Threshold Concerned (τ)
Slightly -2.404*** 0.447 -3.281 -1.527
Moderately -1.840*** 0.439 -2.700 -0.980
Very -1.206** 0.434 -2.057 -0.356
Location (β)
log10V DVm,24h 1.344*** 0.235 0.883 1.805
Link function: Logit. SE: Standard Error. N = 321. Cox& SnellR2pseudo= 0.112, NagelkerkeR2pseudo= 0.120. *p <0.1, **p <0.01, ***p <0.001
projects, such as the development of high speed railway lines. With considera-tion of these limitaconsidera-tions, the results indicate that acceptability and annoyance
275
are equally applicable for the prediction of community response to vibration lev-els. This finding presents an interesting dichotomy for the management of the human response to vibration from construction. On the one hand, the equiva-lence of annoyance and acceptability as a predictor of community response sug-gests that vibration limit values may be set on the derived annoyance
exposure-280
relationships curves without the need for consideration of a complex framework of psychological factors. On the other hand, acceptability presents the possi-bility of the management of psychological factors, such as perceived costs, risks and benefits, and outcome efficacy, to improve the community response.
The question at hand is whether there are other useable measures of people’s
285
10−4 10−3 10−2 10−1 0
10 20 30 40 50 60 70 80 90 100
%
VDV
m,24hr (m/s 1.75)
Slightly
Moderately
Very
[image:17.612.163.445.140.368.2]Extremely
Concern
Figure 4: Exposure-response curves showing the proportion of people reporting being extremely concerned, very concerned, moderately concerned and slightly concerned
for property damage due to construction vibration, for a given vibration exposure
(V DVm,24h). The dashed lines show 95% CI. N=321. Vibration data are ‘Wm’
weighted.
variation in annoyance responses (Waddington et al., 2014; Woodcock et al., 2011b) and that other non-exposure factors do influence people’s annoyance (Peris et al., 2014). From the Cox & Snell R2
pseudo presented here it is seen
290
that exposure explains more of the variation in annoyance than it does in either
concern or acceptability.
A comparison is now made of the sizes of confidence intervals. A relationship with tight 95% confidence intervals is generally considered more useful than one with broad intervals. Of the three measures acceptability has the broadest CIs
295
as seen when comparing the graphs in Figures 3, 4 and 5. Annoyance has the tightest CIs closely followed byconcern.
Table 4: Estimated parameters for the prediction of acceptability by construction vibration exposure.
Estimates
Parameter Estimates SE 95% CI
Lower Upper Threshold (τ)
Very Acceptable -4.477*** 0.600 -5.652 -3.301 Acceptable -3.095*** 0.538 -4.150 -2.041 Neither -2.185*** 0.511 -3.186 -1.184 UnAcceptable -0.935** 0.491 -1.898 -0.027 Location (β)
log10V DVm,24h 1.115*** 0.271 0.583 1.647
Link function: Logit. SE: Standard Error. N = 249 Cox & SnellR2
pseudo= 0.097, NagelkerkeR 2
pseudo= 0.102
*p <0.1, **p <0.01, ***p <0.001
seen that the thresholds of the different levels of acceptability are spread much further apart than for eitherconcern or annoyance. This implies that within
300
the range of exposures measured a given level of acceptability covers a much wider range of exposure compared to annoyance orconcern. Increasing the β
value moves the graph to the right and lowering (to larger negative values) the
τ thresholds increases the steepness of the curve. Each of the thresholds within a metric has the sameβ parameter (proportional odds assumption).
305
Taken together, these results show that annoyance has a much tighter and more distinct relationship to exposure than acceptability. In part this may be due to the differences in questionnaire wording and scales used. Annoyance was measured using a semantic scale running from“Don’t notice” through to
“Extremely”, i.e. levels of being annoyed, while acceptability was measured on
310
An-10−4 10−3 10−2 10−1 0
10 20 30 40 50 60 70 80 90 100
%
VDV
m,24hr (m/s 1.75)
Very Acceptable
Acceptable
Neither
Unacceptable
[image:19.612.164.446.126.359.2]Very Unacceptable
Figure 5: Exposure-Response curves showing the probability of people finding the vibration either very acceptable, acceptable, neither acceptable nor unacceptable unacceptable or very
unacceptable.
other explanation considers how acceptability is judged compared to annoyance. In the model proposed, individuals decide how annoyed they are in response to vibration by considering the vibration alone, regardless of other factors. While it has been shown that many other factors actually influence the
exposure-315
annoyance relationship (Peris et al., 2014; Wong-McSweeney et al., 2016 Forth-coming), the respondent is perhaps only focussing on the vibration. Forconcern
the respondent may take into account factors that affect the potential damage to their property (vibration magnitude, strength/age of building, risk of shaking to fragile objects) but are still focussed on the vibration. For acceptability on the
320
By having these other factors involved it makes sense that there is a broader
325
spread of responses for acceptability and concern than for annoyance. This means that as a response measure in itself annoyance gauges people’s reactions more precisely and comparisons between sites can be made with more certainty. However to understand how much of a problem the vibration from a construc-tion site will be for local residents, the fact that acceptability encompasses a
330
judgement balancing the positives and negatives may be an advantage.
Aims of further work are to improve the well-being of people living in the vicinity of railway developments as well as to facilitate the mobility of the people through railway systems. On one side, construction or upgrade of railways can generate problems such as deprivation of landscape and well-being within the
335
communities located in the vicinity of such infrastructure. Reducing annoyance and related responses due to railway noise and vibration using community ori-entated measures will support the quality of urban environments. On the other hand, the enhancement of the railway achieved by using community orientated solutions would improve the mobility of the population and ensure the capacity
340
growth of the railway network.
The expectation of future vibration or noise from the line under construc-tion is not specifically considered in this study. Expectaconstruc-tion could play a role in annoyance by the construction vibration, but an even more important role in the acceptability of it. For example, if it is expected that the LRT will reduce
345
vibration and noise in the long term, then the short-term negative effects could be expected to balance with the long-term benefits. Acceptability may represent a long-term judgement of construction vibration, while annoyance encompass only current factors. Other non-acoustical factors involved in the levels of an-noyance reported by residents exposed to vibration near to LRT construction
350
site are examined by Wong-McSweeney et al. (2016 Forthcoming). Important factors assessed include: whether the resident has ownership of the property; self reported sensitivity to vibration, expectations of future levels of vibration; the visibility of the construction site and the age of the respondents.
There is a significant knowledge gap on how measures directed to manage
acceptability might be more cost-effective than physical interventions alone. Further work might therefore be directed towards the development of guidance on management of annoyance and related behaviours such as acceptability. The guidance could give knowledge about expected outcomes when applying the various mitigation measures and describe the limits of its applications. These
360
outcomes are likely to be economic and this means that it is essential for industry to partner on such work. Likewise outcomes might be societal, so policy makers and planners too need to be key participants.
5. Conclusions
It was found that annoyance is the most sensitive response to different
vi-365
bration exposures with thresholds closer together than either concern or ac-ceptability. The confidence intervals for annoyance were also smaller suggesting a stronger relationship. The Cox and Snell pseudo R2 was also greatest for
annoyance which indicates that more of the variability in the response can be attributed to the vibration, however for none of the three is the value very high.
370
It is suggested that the greater spread of bothconcernand acceptability are due to the multiple considerations taken into account by residents when judging these compared to annoyance. Even though evidence has been presented by others that external factors do influence the exposure-annoyance relationship these are not as explicit in the judgement of annoyance as in the judgement of
375
acceptability.
For concern residents may weigh up what they know of the vibration and
the property before deciding how concerned they are. Likewise for acceptabil-ity residents may balance the negatives of disruption, nuisance and annoyance against the positives of what they stand to gain from the construction, such as
380
a convenient transport link.
Of particular interest are gaps regarding possible measures and interventions,
385
accompanying costs, benefits of avoided effects, determinants of acceptance, influence of other personal and contextual aspects including policy and gover-nance, and communication. This requires a multidisciplinary approach that will bring together experts on modelling and mitigating vibration, as well as experts on human response, including annoyance, sleep disturbance and health effects.
390
Acknowledgements 395
This research was co-funded by Department for Environment and Rural Af-fairs (Defra) U.K. under grant agreement number NANR209 and the MAPFRE Foundation.
References
Standards 400
BS 5228-2:2009, Code of practice for noise and vibration control on construc-tion and open sites Part 2: Vibraconstruc-tion
BS 6472-1:2008, Guide to evaluation of human exposure to vibration in build-ings Part 1: Vibration sources other than blasting
ISO 2631-2:2003, Mechanical vibration and shock - Evaluation of human
ex-405
posure to whole-body vibration - Part 2: Vibration in buildings (1 Hz to 80 Hz)
ISO 15666:2003, Acoustics - Assessment of noise annoyance by means of social and socio-acoustic surveys
Bauer, M., Collin, D., Iemma, U., Janssens, K., M´arki, F., Muller, U., 2010. Cosma-community oriented solutions to minimise aircraft noise annoyance,
410
in: INTER-NOISE and NOISE-CON Congress and Conference Proceedings, Institute of Noise Control Engineering. pp. 4126–4135.
Devine-Wright, P., 2007. Reconsidering public attitudes and public acceptance of renewable energy technologies: a critical review. Manchester: School of Environment and Development, University of Manchester. Available at:
415
http://www. sed. manchester. ac. uk/research/beyond nimbyism .
Grisol´ıa, J.M., L´opez, F., de Dios Ort´uzar, J., 2015. Increasing the acceptability of a congestion charging scheme. Transport Policy 39, 37–47.
Guski, R., Felscher-Suhr, U., Schuemer, R., 1999. The concept of noise annoy-ance: How international experts see it. Journal of Sound and Vibration 223,
420
Huijts, N., Molin, E., Steg, L., 2012. Psychological factors influencing sustain-able energy technology acceptance: A review-based comprehensive frame-work. Renewable and Sustainable Energy Reviews 16, 525–531.
Janssen, S., Coelho, B.Z., Koopman, A., Peris, E., Groll, W., Wisniewska, K.,
425
2015. Annoyance due to vibration from freight railway lines in the netherlands and poland, in: Proceedings 10th European Congress and Exposition on Noise Control Engineering, EuroNoise, pp. 595–598.
Klæboe, R., Turunen-Rise, I., H˚arvik, L., Madshus, C., 2003. Vibration in dwellings from road and rail traffic—part ii: exposure–effect relationships
430
based on ordinal logit and logistic regression models. Applied Acoustics 64, 89–109.
Leverton, J., Pike, A., 2007. Helicopter noise - what is important from a com-munity prospective?, in: Annual Forum Proceedings - American Helicopter Society, American Helicopter Society, Inc.. p. 1.
435
Peris, E., Woodcock, J.S., Sica, G., Sharp, C., Moorhouse, A.T., Waddington, D.C., 2014. Effect of situational, attitudinal and demographic factors on railway vibration annoyance in residential areas. The Journal of the Acoustical Society of America 135, 194–204.
Pridmore, A., Miola, A., 2011. Public acceptability of sustainable transport
440
measures, a review of the literature, International Transport Forum, European Commission Joint Research Centre. OECD Publishing.
Sharp, C., Woodcock, J.S., Sica, G., Peris, E., Moorhouse, A.T., Waddington, D.C., 2014. Exposure-response relationships for annoyance due to freight and passenger railway vibration exposure in residential environments. The Journal
445
of the Acoustical Society of America 135, 205–212.
vibration in residential environments. Science of the Total Environment 482, 461–471.
450
Toke, D., 2003. Wind power in the uk: How planning conditions and financial arrangements affect outcomes. International Journal of Sustainable Energy 23, 207–216.
Upham, P., Oltra, C., Boso, `A., 2015. Towards a cross-paradigmatic framework of the social acceptance of energy systems. Energy Research & Social Science
455
8, 100–112.
Waddington, D.C., Moorhouse, A.T., Steele, A., Woodcock, J.S., Condie, J., Peris, E., Sica, G., Koziel, Z., 2011. Human response to vi-bration in residential environments (NANR209), final project report. , http://usir.salford.ac.uk/18583/.
460
Waddington, D.C., Woodcock, J.S., Peris, E., Condie, J., Sica, G., Moorhouse, A.T., Steele, A., 2014. Human response to vibration in residential envi-ronments. The Journal of the Acoustical Society of America 135, 182–193 http://usir.salford.ac.uk/33652/.
Wong-McSweeney, D., Woodcock, J.S., Waddington, D.C., Peris, E.,
Moor-465
house, A.T., Redel-Macias, M.D., 2016 Forthcoming. Effect of attitudinal, situation and demographic factors on annoyance due to environmental vibra-tion from construcvibra-tion of a light rapid transit system. IJERPH .
Woodcock, J.S., Peris, E., Condie, J., Sica, G., Koziel, Z., Evans, T., Moorhouse, A.T., Steele, A., Waddington, D.C., 2011a. Human response to vibration
470
in residential environments (NANR209), Technical report 6: determination of exposure–response relationships. Technical Report. University of Salford http://usir.salford.ac.uk/23386/.
Woodcock, J.S., Peris, E., Sica, G., Koziel, Z., Moorhouse, A.T., Waddington, D.C., 2011b. Human response to vibration in residential environments:
tablishing exposure-response relationships, in: 10th International Congress on Noise as a Public Health Problem, ICBEN http://usir.salford.ac.uk/19134/.
Woodcock, J.S., Sica, G., Peris, E., Sharp, C., T., M.A., Waddington, D.C., 2015 under review. Quantification of the effects of audible rattle and source type on the human response to environmental vibration. Journal of Acoustic
480
Society of America .