International Journal of Emerging Technology and Advanced Engineering
Website: www.ijetae.com (ISSN 2250-2459, ISO 9001:2008 Certified Journal, Volume 4, Issue 12, December 2014)
320
Multi Objective Optimization of Process Parameters in Laser
Beam Cutting of Al7075/10%SiC
p
Metal Matrix Composite
using Taguchi Method and Principal Component Analysis
M. Lakshmi Chaitanya
1, G. V. N. Santhosh
2, S. Srikanth
31,2,3Department of Mechanical Engineering, Pragati Engineering College, Surampalem, AP, India
Abstract-Laser cutting of metal matrix composite, having extensive applications in aerospace and automobile industries, is important from the eminence of cut point of view. Keeping this in view, a fusion approach of Taguchi method (TM) and principal component analysis (PCA) has been functional for multi-objective optimization (MOO) of pulsed Nd: YAG laser beam cutting (LBC) of Al7075/SiCp metal matrix composite to achieve better qualities within obtainable possessions. The three-quality characteristics kerf width, kerf deviation (along the length of cut), and kerf taper have been measured for simultaneous optimization. The input parameters considered are pulse power, pulse frequency, assist gas pressure and pulse width. Initially, single-objective optimization has been performed using TM and then the signal-to-noise (S/N) ratios obtained from TM have been more used in PCA for multi-objective optimization (MOO). The results of MOO include the prediction of optimum input parameter level and their comparative implication on multiple quality characteristics (MQC). The responses at predicted optimum parameter level are in good conformity with the outcome of authentication experiments conducted for confirmation tests.
Keywords— Laser cutting; Taguchi Method; Principal component analysis; Nd: YAG laser; Multi-objective optimization.
I. INTRODUCTION
Advanced engineering resources have high stipulate in contemporary mechanized industries due to their enhanced scientific distinctiveness such as high mechanical strength and hardness, corrosion resistance, heat resistance and wear resistance. Nowadays, aluminum based Metal Matrix Composites (Al-MMCs) identified as low cost engineering materials, get wider applications including automotive, aerospace, medical, electronic and recreational industries because of their improved mechanical properties [1]. However, these composites are processed to near net shape, and subsequent machining is unavoidable for engineering products. Conventional machining of these are difficult to machine due to hard particle reinforcement, which results in increased tool wear, poor machined surface, and high cutting force magnitudes.
Also, while machining MMC, the particle reinforcement has a chance of pulling out fibres, damaging the sub-surface, and the formation of built-up edge [2-3]. The non-conventional manufacturing processes are well suited for shaping advanced difficult-to-cut materials.
Laser beam cutting (LBC) is one of the non-traditional cutting processes, mainly used for producing complex shapes and geometries in approximately all engineering materials such as metals, non-metals, ceramics, composites, and superalloys [4-5]. LBC is a thermal cutting process and it is carried out by scanning a laser beam ahead the surface of the workpiece with consistent distance; by that producing a narrow cut kerf.
The solid state Nd: YAG and gaseous CO2 lasers are
most widely used industrial lasers due to their high powers [4-5]. Nd: YAG laser cutting becomes an excellent machining process because of high laser beam intensity, low mean beam power, good focusing characteristics due to very small pulse duration and narrow heat affected zone (HAZ).
The machining quality of pulsed Nd: YAG laser depends on many operating parameters such as pulse frequency, pulse energy, pulse width, cutting speed, assist gas type and its pressure. The proper control of these factors gives the desired cut quality [6].
International Journal of Emerging Technology and Advanced Engineering
Website: www.ijetae.com (ISSN 2250-2459, ISO 9001:2008 Certified Journal, Volume 4, Issue 12, December 2014)
321
Researchers have experimentally studied the kerf qualities like kerf taper and/or kerf width during LBC and concluded that these qualities can be optimized by proper control of process parameters [7, 9-11]. Some researchers have applied the Taguchi methodology (TM) to analyse and optimize the process parameters in order to achieve better cut qualities during LBC [12–14]. Their findings show a significant enhancement in cut qualities at optimum parameter levels.a
Kerf width Work piece
Length of cut
b
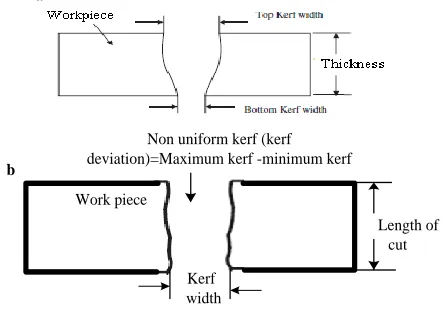
[image:2.612.62.285.248.403.2]Non uniform kerf (kerf deviation)=Maximum kerf -minimum kerf
Figure 1. Representation of laser cut kerf: (a) kerf taper and (b) kerf deviation.
In TM-based experimental studies conceded out up to now, optimization of a single quality characteristic at a time is done i.e., individual quality indices are independent to each other i.e. they are not correlated. But in practice the assumption may not be valid always. Therefore in the optimization process of MQC, the objective is to determine the best factor settings, which simultaneously optimize the quality characteristics at the same time. Therefore, hybrid Taguchi based optimization approaches like grey based Taguchi, desirability function based Taguchi, utility concept based Taguchi methods those do not account response correlation may lead to erroneous results in the selection of weighting factor due to possible correlations amongst the MQC.
Hence in order to avoid this limitation, the study proposes the application of Principal components analysis to eliminate response correlation. PCA has been proven to be useful for dealing with poor, incomplete and uncertain information. PCA converts the correlated responses into uncorrelated quality indices called principal components. From the principal components the quality losses are calculated. Fung and Kang [16] have applied the TM and PCA sequentially to optimize the MQC at a time during injection-moulding process.
The outcome of their study suggests that this hybrid approach is suitable for optimizing the MQC in manufacturing processes. Tzeng and Chen [17] have also tried the same hybrid approach in CNC turning process and found the considerable improvements in MQC. To the best of knowledge, this hybrid approach has yet not been applied so far, in any of laser-based cutting processes for improving the MQC.
In the present paper, three kerf qualities such as Kt, Kd,
and Kw have been optimized simultaneously during pulsed
Nd: YAG LBC of Al7075/10%SiCp metal matrix
composite with hybrid approach of TM and PCA. The control factors taken are: pulse power (PP), pulse frequency (PF), assist gas pressure (GP) and pulse width (PW). Initially, experiments have been performed by using L25
orthogonal array (OA) to obtain the results of single-objective optimization for Kw, Kd, and Kt, respectively. The
signal-to-noise (S/N) ratios of each quality characteristics have been further used in PCA to optimize the MQC. Finally, the analysis of variance (ANOVA) was used to find out the most influential laser cutting parameter for multiple responses.
II. METHODOLOGY FOR MOO
For optimizing MQC simultaneously, the TM and PCA both are applied sequentially. This section gives a brief idea about these two approaches
A. Taguchi Method
Taguchi's techniques have been used widely in engineering design. The Taguchi method contains system design, parameter design, and tolerance design procedures to achieve a robust process and result for the best product quality [18-19]. In this method, main process parameters which influence on process results are taken as input parameters and the experiment is performed as per exclusively premeditated orthogonal array (OA). The selection of appropriate OA is based on total degree of freedom. Once the degrees of freedom required are known, the next step is to select an appropriate OA to fit the specific task. Minimum number of experiment is calculated as[( ) ] ; where l is the number of levels and p is the number of parameters.
International Journal of Emerging Technology and Advanced Engineering
Website: www.ijetae.com (ISSN 2250-2459, ISO 9001:2008 Certified Journal, Volume 4, Issue 12, December 2014)
322
In the case of kerf taper, kerf deviation, and kerf width, lower values of them are desirable. The S/N ratio used for this type response is given by [20]:⁄ ( ) { ⁄ ∑
} ( )
Where dB means decibel, yn is the response for a trial
condition repeated k times.
B. Principal component analysis
It is a statistical method of identifying patterns in data, and expressing the data in such a way as to highlight their similarities and differences. PCA also selects a small number of components to account for the variance of original multi-response [21]. In PCA, the original dataset of MQC are converted into principal components (PC) which is a linear combination of multi-responses obtained in a trial run. The procedure of PCA [16, 17, 22] can be described as follows:
Normalization of S/N ratios of each quality characteristics obtained from TM are calculated as:
( ) ( ) ( )
( ) ( ) ( )
Where ( ) is normalized S/N Ratio for quality characteristic in experimental run, ( ) is the S/N ratio for the quality characteristic in experimental run , ( ) is the minimum and ( ) is the maximum of S/N ratios for quality characteristics in all experimental runs.
The normalized multi-response array for quality characteristics and experimental runs can be represented by matrix as:
[
( ) ( ) ( ) ( )
( )
( )
( ) ( )
( )]
( )
The correlation coefficient array ( ) of matrix is evaluated as follows:
[( ( ) ( )]
( ) ( ) ( )
Where [( ( ) ( ))] is the covariance of sequences ( ) and ( ); ( ) is the standard deviation of sequence ( ).
The eigenvalues and eigenvectors of matrix ( ) are calculated
The PC is computed as follows:
( ) ∑ ( ) ( ) ( )
Where ( ) is the PC corresponding to the experimental run, ( )is the element.
The total principal component index (TPCI) corresponding to experimental run is computed as:
∑ ( ) ( ) ( )
( ) ( ) ∑ ( )
( )
Where ( ) is the eigen value.
The TPCI for each experimental run is used to find out the average factor effect at each level. The optimum parameter level that corresponds to the maximum TPCI was also predicted.
III. PULSED ND:YAGLASER BEAM CUTTING PROCESS
The experiment was performed on a 16kW pulsed Nd: YAG laser beam machining system. The nitrogen was used as an assist gas. The different process parameters taken are: PP, PF, GP and PW. Economic grade Aluminum alloy 7075 and SiC granular of particle size 50µm were used in the experiments as workpiece material. Five levels of each control factor have been selected without considering the interaction effect. The numerical values of control factors at different levels are shown in Table 1.
An exhaustive pilot experimentation has been conducted to decide the parameter range for through cutting of Al7075/10%SiCp metal matrix composite of 2mm
thickness. The initial setting of parameters was: pulse-power 210w, pulse frequency 210Hz, assist gas pressure 8 kg/cm2 and pulse width 0.2ms.
The quality characteristics analysed are kerf taper, kerf deviation (along the length), and kerf width. Two cuts each of 10mm length were obtained in each experimental run and for each quality characteristic an average quality value of two cuts has been taken. The top and bottom kerf widths were measured using the optical microscope. The kerf taper (Kt) angle has been calculated using following
International Journal of Emerging Technology and Advanced Engineering
Website: www.ijetae.com (ISSN 2250-2459, ISO 9001:2008 Certified Journal, Volume 4, Issue 12, December 2014)
323
( ) ( ) ( )
The kerf deviation (Kd) is the difference of maximum
and minimum width of top kerf measured along the length of cut
Kd = maximum top kerf width-minimum top kerf width
The kerf width (Kw) is the width of top kerf. The kerf
widths taken for top or bottom kerfs are the mathematical average of five measurements of each cut taken at equal distances along the length of cut.
TABLE I
CONTROL FACTORS AND THEIR LEVELS
Control Factor Symbol Levels
1 2 3 4 5
Pulse-Power(W) A 210 220 230 240 250
Pulse-Frequency(Hz) B 210 220 230 240 250
Assist Gas
Pressure(kg/cm2) C 8 9 10 11 12
Pulse-Width(ms) D 0.2 0.3 0.4 0.5 0.6
IV. DETERMINATION OF OPTIMAL PARAMETERS
In this section, the results of single-objective optimization using TM and multi-objective optimization (MOO) by hybrid approach of TM and PCA have been discussed. The verification results obtained on suggested optimum parameter levels have also been reported.
A. Orthogonal array experiments
The minimum number of experiments to be conducted has been calculated without considering the interaction effect for four control factors each at five different levels is 17. Based on this orthogonal array (OA) was to be selected which has at least 17 rows i.e., 17 experimental runs. An OA has been selected for performing the experiments. The observed quality values for each quality characteristics kerf width (mm), kerf deviation (mm), and kerf taper (deg) in different trials have been tabulated in Table 2.
B. Single objective optimization using TM
The S/N ratios for Kw, Kd and Kt have been calculated
from experimental values of each quality characteristic (Table 2).
The S/N ratio corresponding to each experimental run is given in Table 3. The factor effect of a parameter at any level is computed by taking the average of all S/N ratios at the same level. The effect of various factors at different levels for responses Kw, Kd, and Kt are shown in Table 4.
The optimum parameter level is the level corresponding to maximum average S/N ratio for a control factor. Therefore, the optimum parameter level for minimum value of Kw, Kd,
and Kt are A5B2C1D5, A2B4C5D4, and A5B3C1D4,
respectively.
TABLE II
EXPERIMENTAL LAYOUT USING L25 ORTHOGONAL ARRAY
No Factor level Kw
(mm)
Kd (mm)
Kt (deg)
A B C D
1 1 1 1 1 0.3300 0.7010 0.0154
2 1 2 2 2 0.3082 0.9870 0.0210
3 1 3 3 3 0.3130 0.9060 0.0280
4 1 4 4 4 0.3295 0.2660 0.0410
5 1 5 5 5 0.3390 0.7210 0.1080
6 1 1 2 3 0.3640 0.7400 0.1120
7 2 2 3 4 0.2990 0.1000 0.0190
8 2 3 4 5 0.3405 0.1689 0.0387
9 2 4 5 1 0.3295 0.1740 0.0320
10 2 5 1 2 0.3130 0.5500 0.0240
11 3 1 3 5 0.3129 0.3290 0.0250
12 3 2 4 1 0.3410 0.4690 0.0290
13 3 3 5 2 0.3450 0.4150 0.0210
14 3 4 1 3 0.3180 0.6370 0.0350
15 3 5 2 4 0.2990 0.5370 0.0230
16 4 1 4 2 0.3510 0.7190 0.1170
17 4 2 5 3 0.3665 0.6090 0.0719
18 4 3 1 4 0.3185 0.4440 0.0190
19 4 4 2 5 0.3415 0.4810 0.0243
20 4 5 3 1 0.3490 0.4840 0.0430
21 5 1 5 4 0.3225 0.1020 0.0336
22 5 2 1 5 0.2259 0.5690 0.0237
23 5 3 2 1 0.3260 0.9180 0.0220
24 5 4 3 2 0.2599 0.6093 0.0110
International Journal of Emerging Technology and Advanced Engineering
Website: www.ijetae.com (ISSN 2250-2459, ISO 9001:2008 Certified Journal, Volume 4, Issue 12, December 2014)
324
TABLE III
S/N RATIOS AND NORMALISED S/N RATIOS FOR KW, KD AND KT
Since there are a large number of variables controlling the process, some mathematical models are required to represent the process. However, these models are to be developed using only the significant parameters influencing the process rather than including all the parameters. In order to achieve this, statistical analysis of the experimental results will have to be processed using the analysis of variance (ANOVA) [23]. Greater the F-ratio more significant will be the factor. The results of ANOVA for Kw, Kd, and Kt is given in Table 5. The result show that
pulse power is the significant factor for Kw, pulse width is
significant for Kd, and assist gas pressure is significant
factor for Kt. The contribution of factors in increasing order
for Kw is PW, PF, GP and PP for Kd is PF, GP, PP and PW
and for Kt is PW, PF, PP and GP.
TABLE IV
S/N RESPONSE TABLE FOR KW, KD AND KT
TABLE V
RESULTS OF ANOVA FOR KW, KD AND KT
Symbol DOF SS MS F % cont
Kw
A 4 7.86 1.96 3.83 46.60
B 4 2.20 0.55 1.08 13.08
C 4 4.75 1.19 2.31 28.16
D 4 2.05a 0.51 - 12.16
Error 8 2.05
Total 24 16.86 100.00
Kd
A 4 178.39 44.60 5.12 27.09
B 4 34.85a 8.71 - 5.29
C 4 159.26 39.81 4.57 24.18
D 4 286.05 71.51 8.21 43.44
Error 8 34.85
Total 24 658.54 100.00
Kt
A 4 133.13 33.28 1.69 30.12
B 4 83.14 20.79 1.05 18.81
C 4 146.72 36.68 1.86 33.20
D 4 78.95a 19.74 - 17.86
Error 8 78.95
Total 24 441.94 100.00
a
pooled factor
C. Multi objective optimization using hybrid approach of TM and PCA
The normalized S/N ratios for each quality characteristic Kw, Kd, and Kt have been calculated using Eq. (2) and are
shown in Table 3.
No
S/N Ratios Normalised S/N Ratios
Kw Kd Kt Kw Kd Kt
1 9.630 3.086 36.250 0.217 0.149 0.858
2 10.223 0.114 33.556 0.358 0.000 0.727
3 10.089 0.857 31.057 0.326 0.037 0.605
4 9.643 11.502 27.744 0.220 0.573 0.444
5 9.396 2.841 19.332 0.161 0.137 0.034
6 8.778 2.615 19.016 0.014 0.126 0.018
7 10.487 20.000 34.425 0.421 1.000 0.769
8 9.358 15.447 28.246 0.152 0.771 0.468
9 9.643 15.189 29.897 0.220 0.758 0.548
10 10.090 5.193 32.396 0.326 0.255 0.670
11 10.093 9.656 32.041 0.327 0.480 0.653
12 9.345 6.577 30.752 0.149 0.325 0.590
13 9.244 7.639 33.556 0.125 0.378 0.727
14 9.951 3.917 29.119 0.293 0.191 0.510
15 10.487 5.401 32.765 0.421 0.266 0.688
16 9.094 2.865 18.636 0.089 0.138 0.000
17 8.719 4.308 22.865 0.000 0.211 0.206
18 9.938 7.052 34.425 0.290 0.349 0.769
19 9.332 6.357 32.288 0.146 0.314 0.665
20 9.143 6.303 27.331 0.101 0.311 0.423
21 9.829 19.828 29.473 0.264 0.991 0.528
22 12.922 4.898 32.505 1.000 0.241 0.675
23 9.736 0.743 33.152 0.242 0.032 0.707
24 11.704 4.303 39.172 0.710 0.211 1.000
25 10.489 4.437 34.471 0.421 0.217 0.771
Symbol
Mean S/N ratios
Level 1 Level 2 Level 3 Level 4 Level 5
Kw
A 9.796 9.778 9.824 9.245 10.936a
B 9.485 10.339a 9.673 10.055 9.921
C 10.506a 9.818 10.303 9.586 9.366
D 9.499 10.071 9.713 10.077 10.22a
Kd
A 3.68 11.689a 6.638 5.377 6.842
B 7.61 7.179 6.348 8.254a 4.835
C 4.829 3.046 8.224 8.166 9.961a
D 6.379 4.023 3.227 12.757a 7.84
Kt
A 29.59 28.8 31.65 27.11 33.75a
B 27.08 30.82 32.09a 31.64 29.26
C 32.94a 30.16 32.81 27.97 27.02
D 31.48 31.46 27.31 31.77a 28.88
a
International Journal of Emerging Technology and Advanced Engineering
Website: www.ijetae.com (ISSN 2250-2459, ISO 9001:2008 Certified Journal, Volume 4, Issue 12, December 2014)
325
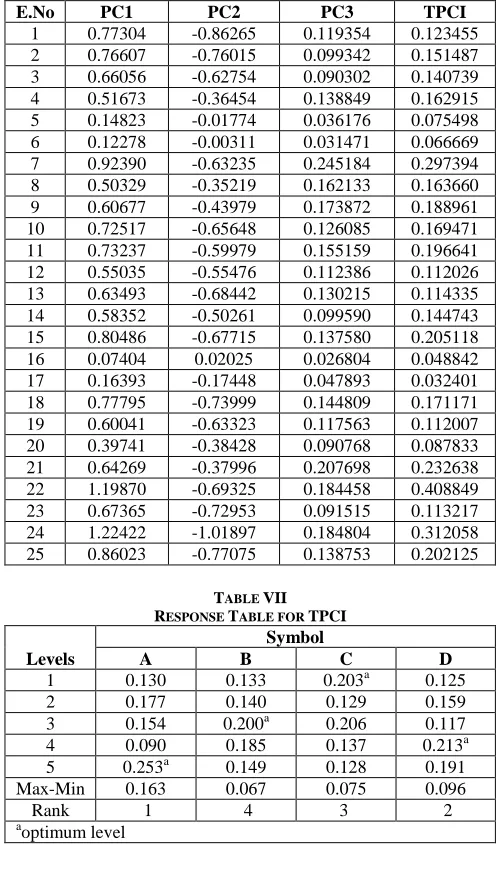
The eigenvalues and eigenvectors obtained from correlation coefficient matrix are: 1.5400, 1.0126, 0.4474 and [0.699, 0.084, 0.710], [0.179, -0.982, -0.061], [0.692, 0.170, -0.702], respectively. The three principal components PC1, PC2, PC3 and their integrated TPCI for each experimental run have been calculated using Eqs. (5)– (7) and given in Table 6. The factor effect at each parameter levels have been computed by taking the average of all TPCI at that level and are given in Table 7.TABLE VI
PRINCIPAL COMPONENT SCORES AND THEIR INTEGRATED TPCI
E.No PC1 PC2 PC3 TPCI
1 0.77304 -0.86265 0.119354 0.123455
2 0.76607 -0.76015 0.099342 0.151487
3 0.66056 -0.62754 0.090302 0.140739
4 0.51673 -0.36454 0.138849 0.162915
5 0.14823 -0.01774 0.036176 0.075498
6 0.12278 -0.00311 0.031471 0.066669
7 0.92390 -0.63235 0.245184 0.297394
8 0.50329 -0.35219 0.162133 0.163660
9 0.60677 -0.43979 0.173872 0.188961
10 0.72517 -0.65648 0.126085 0.169471
11 0.73237 -0.59979 0.155159 0.196641
12 0.55035 -0.55476 0.112386 0.112026
13 0.63493 -0.68442 0.130215 0.114335
14 0.58352 -0.50261 0.099590 0.144743
15 0.80486 -0.67715 0.137580 0.205118
16 0.07404 0.02025 0.026804 0.048842
17 0.16393 -0.17448 0.047893 0.032401
18 0.77795 -0.73999 0.144809 0.171171
19 0.60041 -0.63323 0.117563 0.112007
20 0.39741 -0.38428 0.090768 0.087833
21 0.64269 -0.37996 0.207698 0.232638
22 1.19870 -0.69325 0.184458 0.408849
23 0.67365 -0.72953 0.091515 0.113217
24 1.22422 -1.01897 0.184804 0.312058
25 0.86023 -0.77075 0.138753 0.202125
TABLE VII RESPONSE TABLE FOR TPCI
Levels
Symbol
A B C D
1 0.130 0.133 0.203a 0.125
2 0.177 0.140 0.129 0.159
3 0.154 0.200a 0.206 0.117
4 0.090 0.185 0.137 0.213a
5 0.253a 0.149 0.128 0.191
Max-Min 0.163 0.067 0.075 0.096
Rank 1 4 3 2
a
optimum level
The optimum parameter level for MQC corresponds to maximum average TPCI for a control factor which is A5B3C1D4 i.e. PP at 250W, PF at 230Hz, GP at 8Kg/cm2, and PW at 0.5ms.The ANOVA given in Table 8 shows the contribution of different factors in increasing order as: gas pressure, pulse frequency, pulse width, and cutting speed. The graphical representation of contribution of different control factors on TPCI of MQC is shown in Figure 2. The value of kerf width (mm), kerf deviation (mm), and kerf taper (deg) at this optimum level are found to be 0.346, 0.497 and 0.0117 respectively, after conducting the confirmation run to verify the results (Table 9). The results of confirmation test show that two quality characteristics Kd and Kt have been improved considerably while third
quality characteristic Kw deteriorates slightly. Therefore,
overall enhancement in MQC has been registered.
Table VIII
RESULTS OF ANOVA FOR TPCI
0 5 10 15 20 25 30 35 40 45
A B C D
31.16%
11.33%
41.31%
16.21%
Control factors
P
er
ce
n
ta
g
e
co
n
tr
ib
u
ti
o
n
A-Pulsepower B-Pulse-frequency C-Assist gas pressure
[image:6.612.43.293.261.691.2]D-Pulse-width
Figure 2. Schematic representation of laser cut kerf: (a) kerf taper and (b) kerf deviation
Symbol DOF S.S M.S F CONT (%)
A 4 0.18 0.05 2.75 31.16
B 4 0.07a 0.02 1.00 11.33
C 4 0.24 0.06 3.65 41.31
D 4 0.10 0.02 1.43 16.21
Error 8 0.07 0.02
Total 24 0.59219 100
[image:6.612.43.292.269.709.2] [image:6.612.322.568.344.619.2]International Journal of Emerging Technology and Advanced Engineering
Website: www.ijetae.com (ISSN 2250-2459, ISO 9001:2008 Certified Journal, Volume 4, Issue 12, December 2014)
326
TABLE IX
RESULTS OF CONFIRMATORY EXPERIMENT
V. CONCLUSIONS
The concluding notes can be summarized as follows:
In single-objective optimization using TM, pulse power is the significant factor for kerf width; pulse width for kerf deviation while assist gas pressure is significant for kerf taper.
The optimum parameter levels predicted in single objective optimization for minimum value of kerf width, kerf deviation, and kerf taper are A5B2C1D5, A2B4C5D4, and A5B3C1D4, respectively.
As compared to initial parameter setting the MQC has been improved by using hybrid approach of TM and PCA. The optimum value of control factors for overall improvement in MQC is assist gas pressure 8 kg/cm2, pulse width 0.5 ms, pulse frequency 230 Hz and pulse power 250W. The value of kerf width, kerf deviation, and kerf taper at optimum parameter level is 0.346 mm, 0.497 mm, and 0.01171deg respectively.
The contribution of different control factors on MQC is assist gas pressure-41%, pulse width-16%, pulse frequency-11%, and pulse power-31%. The assist gas pressure is found to be the most significant parameter in this operating range.
REFERENCES
[1] Manna, A., Bhattacharayya, B., 2003. A study on machinability of Al/SiC – MMC, J. Mater. Process.Technol. 140, 711-716.
[2] Looney, L.A., Monaghan, J.M., O’Reilly, P., Taplin, D.M.R., 1992. The turning of an Al/SiC metal matrix composite, J. Mater. Process.Technol. 33, 453-468.
[3] Hung, N.P., Boey, F.Y.C., Khor, K.A., Puha, Y.S., Lee, H.F., 1996a. Machinability of aluminium alloys reinforced with silicon carbide particulates, J. Mater. Process.Technol. 56, 966-977.
[4] Luxon, J.T., Parker, D.E., 1985. Industrial lasers and their applications. Prentice-Hall.
[5] Chryssolouris, G., ―Laser machining—theory and practice (mechanical engineering series)‖, New York, Springer, 1991.
[6] Dubey, A.K., Yadava, V., 2008. Experimental study of Nd: YAG laser beam machining—an overview. J. Mater. Process .Technol. 195, 15-26.
[7] Ghany, K. A., Newishy. N., 2005. Cutting of 12mm thick austenitic stainless steel sheet using pulsed and CW Nd: YAG laser. J. Mater. Process.Technol. 168, 438-447.
[8] Avanish kumar, D., Vinod,Y., 2008. Optimization of kerf quality during pulsed laser cutting of aluminium alloy sheet. J. Mater. Process.Technol. 204, 412-418.
[9] Methew, J., Goswami, G., Ramakrishna, N., Naik, N.K., 1999. Parametric studies on pulsed Nd: YAG laser cutting of carbon-fibre reinforced plastic composites. J. Mater. Process.Technol. 89, 198-203.
[10] Prasad, G.V.S., Siores, E., Wong, W.C.K., 1998. Laser cutting of metallic coated sheet steels, J. Mater. Process.Technol. 74, 234-42. [11] Thawari, G., Sarin Sundar, J.K., Sundararajan, G., Joshi, S.V., 2005.
Influence of process parameters during pulsed Nd: YAG laser cutting of nickelbase superalloys, J. Mater. Process. Technol. 170, 229–39.
[12] Li, C.H., Tsai, M.J., Yang, C.D., 2007. Study of optimal laser parameters for cutting QFN packages by Taguchi’s matrix method. Opt Laser Technol. 39, 786–95.
[13] Tam, S.C., Lim, L.E.N., Quek, K.Y.,1992. Application of Taguchi method in the optimization of the laser-cutting process. J. Mater. Process. Technol.29, 63–74.
[14] Lim, S.H., Lee, C.M., Chung, W.J., 2006. A study on optimal cutting conditionof a high speed feeding type laser cutting machine by using Taguchi method. Int J Precision Eng Manuf. 7, 18–23. [15] Antony, J., 2001. Simultaneous optimization of multiple quality
characteristics in manufacturing processes using Taguchi’s quality loss function. Int J Adv Manuf Technol.17, 134–8.
[16] Fung, C.P., Kang, P.C., 2005.Multi-response optimization in friction properties of PBT composites using Taguchi method and principal component analysis. J. Mater. Process. Technol. 170,602–10. [17] Tzeng, Y.F., Chen, F.C., 2006. Multi-objective process optimization
forturning of tool steels. Int J Machining Machinability Mater. 1, 76-93.
[18] Phadke, M. S., ―Quality engineering using robust design‖, Englewood Cliffs, NJ. Prentice-Hall, 1989.
[19] Ross, P. J., ―Taguchi techniques for quality engineering‖, New York. McGraw-Hill; 1988.
[20] Taguchi, G., Konishi, S., ―Taguchi methods, orthogonal arrays and linear graphs, tools for quality engineering‖, Dearborn, MI: American Supplier Institute, 1987, 35-38.
[21] Antony, J., 2000. Multi-response optimization in industrial experiments using Taguchi’s quality loss function and principal component analysis. Qual Reliab Eng Int. 16, 3-8.
[22] Avanish kumar, D., Vinod, Y., 2008. Multi-objective optimization of Nd: YAG laser cutting of nickel-based superalloy sheet using orthogonal array with principal component analysis. Opt Lasers Eng. 46, 124-138.
[23] Rahul, D., Jitendra singh, M., Vikas sigh, R., Prince, S., 2012. Optimization of Cutting Parameters in Dry Turning Operation of EN24 Steel. Int.J.Emer.Tech,adv engg. 2,2250-59.
Initial Optimized
Factor level A1B1C1D1 A5B3C1D4
Kerf width(mm) 0.33 0.346
Kerf deviation(mm) 0.701 0.497