S O F T W A R E
Open Access
CHANCE: comprehensive software for quality
control and validation of ChIP-seq data
Aaron Diaz
1,2, Abhinav Nellore
1,2and Jun S Song
1,2,3,4*Abstract
ChIP-seq is a powerful method for obtaining genome-wide maps of protein-DNA interactions and epigenetic modifications. CHANCE (CHip-seq ANalytics and Confidence Estimation) is a standalone package for ChIP-seq quality control and protocol optimization. Our user-friendly graphical software quickly estimates the strength and quality of immunoprecipitations, identifies biases, compares the user’s data with ENCODE’s large collection of published datasets, performs multi-sample normalization, checks against quantitative PCR-validated control regions, and produces informative graphical reports. CHANCE is available at https://github.com/songlab/chance.
Rationale
The foremost question that challenges an experimental-ist about their ChIP-seq is, ‘did my experiment work?’ CHANCE (CHip-seq ANalytics and Confidence Estima-tion) is a software package that provides quantitatively rigorous yet intuitive answers to this fundamental ques-tion in the following ways:
1. CHANCE assesses the strength of immunoprecipi-tation (IP) enrichment to identify potentially failed experiments. CHANCE identifies insufficient sequen-cing depth, PCR amplification bias in library pre-paration, and batch effects.
2. CHANCE identifies biases in sequence content and quality, as well as cell-type and laboratory-dependent biases in read density. Read-density bias reduces the statistical power to distinguish subtle but real enrich-ment from background noise [1-3]. CHANCE visua-lizes base-call quality and nucleotide frequency with heat maps. Furthermore, efficient techniques bor-rowed from signal processing uncover biases in read density caused by sonication, chemical digestion, and library preparation.
3. CHANCE cross-validates enrichment with pre-vious ChIP-qPCR results. Experimentalists frequently use ChIP-qPCR to check the enrichment of positive control regions and the background level of negative
control regions in their immunoprecipitation DNA (IP) relative to input DNA (Input). It is thus impor-tant to verify whether those select regions originally checked with PCR are captured correctly in the sequencing data. CHANCE’s spot-validation tool pro-vides a fast way to perform this verification. CHANCE also compares enrichment in the user’s experiment with enrichment in a large collection of experiments from public ChIP-seq databases.
Despite having different goals, some software packages partially overlap with CHANCE in functionality: htSeq-Tools [4] is an R package with routines for coverage esti-mation, peak calling, and downstream analysis of ChIP-seq data. Interestingly, its use of Lorenz curves to estimate sample coverage is similar in mathematical principle to the signal-to-noise ratios previously used by us and others to construct estimates of the size and quality of the back-ground fraction of IP [1,2]. By contrast, CHANCE pro-vides statistics on coverage, as well as percentage enrichment for signal and multi-sample scaling. Other software visualizes the distribution of quality scores and base calls that may be useful in choosing parameters for mapping reads to a reference genome [5-8]. Some pro-grams can also trim and filter reads based on base-call quality metrics [9-12]. These programs nevertheless do not address biases in read density that can affect the relia-bility of called peaks and do not estimate the strength of IP enrichment. CHANCE not only incorporates the func-tionality of other software, but also has novel features that * Correspondence: [email protected]
1
Institute for Human Genetics, UCSF, 513 Parnassus Avenue, Box 0794, San Francisco, CA 94143-0794, USA
Full list of author information is available at the end of the article
can significantly facilitate the quality control step of ChIP-seq analysis.
While Python scripts and Java applications are available for correcting read density for mappability and GC con-tent biases [3], to our knowledge, no publicly available software today identifies biases that may arise due to sonication, chemical digestion, or laboratory-specific pro-tocols. None of the aforementioned software has more than 1/4 of CHANCE’s features (see the feature compari-son table in Additional file 1). Of the ten software packages compared, seven require programming knowl-edge, and three are sequencing platform specific. In con-trast, CHANCE has an intuitive graphical interface and works with reads from any platform. CHANCE runs on Windows, Mac OS, and Linux and does not require any programming or knowledge of statistics. It is a compre-hensive, statistically rigorous application: it provides a bird’s-eye view of the quality of a ChIP-seq data set, it allows experimentalists to compute multiple quality metrics, and it generates informative images as output graphical reports and figures. Only CHANCE provides a comprehensive suite of ChIP-seq quality controls in a user-friendly graphical interface.
Results
Data sets CHANCE can analyze
CHANCE works with reads mapped to a reference gen-ome from IP and control (Input) samples. It can import reads in BED, tagAlign [13], SAM, and BAM [14] for-mats, as well as BOWTIE [15] output. Its interactive plots include a suite of plotting tools and an export uti-lity to produce informative graphics in most standard formats. In addition to interactive plots, CHANCE also generates a text log of the session containing a summary of the statistical tests performed.
Estimating the strength of IP enrichment
IP enrichment strength is important for calling robust peaks that correspond to transcription factor (TF) bind-ing sites or epigenetic modification sites. To estimate the IP strength, CHANCE attempts to decompose the population of IP reads into two distinct components: those pulled down by the antibody, and background. To accomplish this task, CHANCE uses signal extraction scaling (SES), which is based on order statistics [1]. SES estimates the percentage of the IP data enriched for bio-logical signal, the coverage of IP reads corresponding to DNA fragments pulled down by the antibody, and a scaling factor for properly normalizing IP and Input together. The level of IP enrichment can be used to classify whether an experiment was successful. We have trained CHANCE on thousands of ChIP-seq samples derived from the ENCODE repository (see Materials and methods). CHANCE reports a q-value for the IP
enrichment level based on this training data and uses theq-value to identify potentially failed experiments.
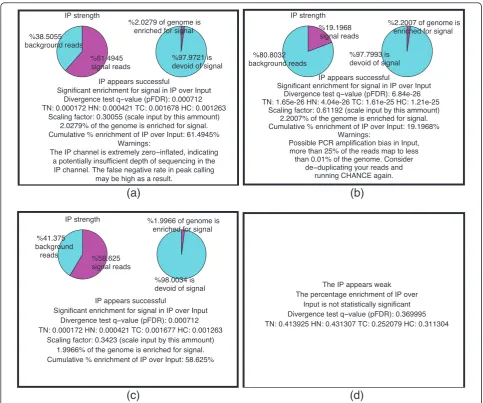
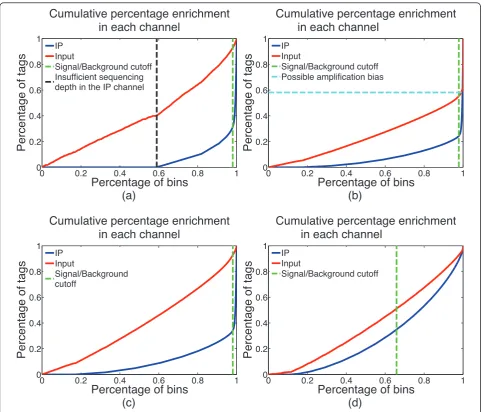
In addition to assessing the strength of IP, it is also important to monitor the levels and sources of different biases present in the data. Identifying these biases is useful for optimizing experimental protocols. During the estimation of IP strength, CHANCE thus also detects several forms of bias. Figure 1 shows typical summary statements, and Figure 2 shows graphical representa-tions of IP strength estimation for several samples, pro-duced by CHANCE. Figures 1a,b and 2a,b are samples with strong ChIP enrichment, but also with substantial biases; Figures 1c and 2c show a successful low bias ChIP; and, Figures 1d and 2d correspond to a very weak ChIP. Figures 1a and 2a show the CHANCE outputs for a H3K4me3 ChIP-seq in human embryonic stem cells (Gene Expression Omnibus (GEO) accession GSM727572). Although CHANCE finds significant enrichment in IP relative to Input, it also detects that almost 60% of the genome has zero coverage, indicating insufficient sequencing depth in the IP. Figures 1b,c and 2b,c show results for a H3K4me3 ChIP-seq in neural stem cells (NSCs) from the murine sub-ventricular zone obtained from the Lim lab at University of California, San Francisco (UCSF) [1]. In Figures 1b and 2b, CHANCE finds significant enrichment in the IP, but it also detects a significant bias in the Input channel - that is, it is found that almost 40% of the reads map to less than 0.001% of the genome. In this data set, the average read density is about 10 reads/kbp; however, for less than 0.001% of the genome, the read density reaches over 50,000 reads/kbp. This kind of outlier coverage often indicates a large number of duplicate reads, which can arise from PCR amplification bias during library preparation [16]. Indeed, after de-duplicating the set of reads and re-running CHANCE, we see a greater frac-tion of reads corresponding to biological signal, as shown in Figures 1c and 2c. In Figures 1d and 2d, we show an example of a ChIP-seq experiment for CARM1 in human embryonic stem cells (GEO accession GSM801064), where the IP sample is statistically indis-tinguishable from Input.
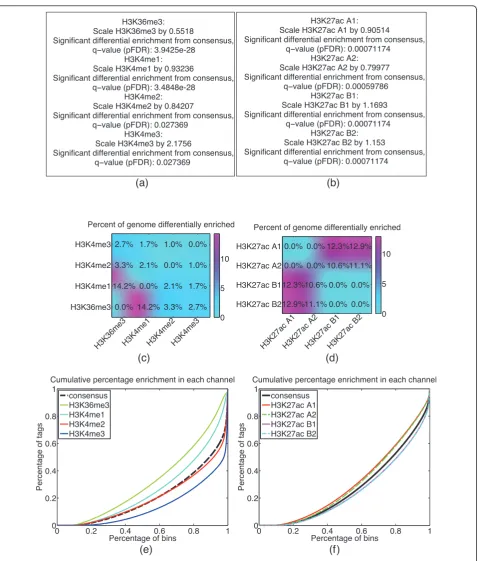
H3K4me3, and H3K36me3 in human embryonic stem cells (H1 HESCs), from Broad Institute tracks available in the ENCODE repository. Figure 3a is a summary statement of the statistical significance of the difference between a given sample and the consensus; Figure 3c provides a pairwise estimate of the fraction of the gen-ome differentially enriched for a given sample; and
Figure 3e gives a graphical representation of the multi-IP comparison.
It is well known that sending samples to a sequencing facility at different times can result in unwanted batch effects. To facilitate the detection of such variability, CHANCE automatically identifies potential batch effects in replicate data. For example, Figure 3b,d,f shows a
(a)
(b)
(c)
The IP appears weak The percentage enrichment of IP over
Input is not statistically significant
!"#$!"%&##%$&""!
(d)
'* background reads
'"!! signal reads IP strength
'%%#" devoid of signal
'##%+,+-enriched for signal
IP appears successful
Significant enrichment for signal in IP over Input %"#
. , + /01--+ ##%'+,1+- 12,+ &-' 1-+,34+3"!!'
5
134 16-07+,282 a potentially insufficient depth of sequencing in the
34 11,9 -0/11
"%#$!#"&"%*$&"#
'**# background reads
'""* signal reads IP strength
'%% devoid of signal
'##%+,+-enriched for signal
IP appears successful
Significant enrichment for signal in IP over Input
. , +""# /01--+ ##%'+,1+- 12,+ &-' 1-+,34+3""*'
5
4+/4&-, +/38 -+1#'+,12-+ 1"'+,1+-&+2
22 0+22 &$:&; *!<# "<#$!!<#&""<#$&"#"<#
'!"% background
reads '*#
signal reads IP strength
'*! devoid of signal
'"+,+-enriched for signal
IP appears successful
Significant enrichment for signal in IP over Input
. , +!# /01--+ "'+,1+- 12,+ &-' 1-+,34+3*#'
[image:3.595.56.540.87.490.2]%"# "%#$!#"&"%%$&"#
four-sample normalization of two batches (A and B) and two technical replicates (rep1 and rep2) for H3K27ac in murine whole limb from the Ahituv lab at UCSF (data not published). The batch effect can be seen in graphical form in Figure 3f, where batch A and batch B appear to cluster together. In Figure 3d, the batch effect is further quantified by the estimates for the percentage of the genome
differentially enriched amongst the four samples. In parti-cular, in Figure 3d, CHANCE was unable to detect statisti-cally significant differential enrichment between technical replicates; by contrast, it found 10 to 12% of the genome to be differentially enriched between the samples from dif-ferent batches, suggesting a non-negligible batch effect between A and B. CHANCE thus provides a powerful tool
0 0.2 0.4 0.6 0.8 1
0 0.2 0.4 0.6 0.8 1
Cumulative percentage enrichment
in each channel
Percentage of bins
Percentage of tags
IP Input
Signal/Background cutoff Insufficient sequencing depth in the IP channel
(a)
0 0.2 0.4 0.6 0.8 1
0 0.2 0.4 0.6 0.8 1
Cumulative percentage enrichment
in each channel
Percentage of bins
Percentage of tags
IP Input
Signal/Background cutoff Possible amplification bias
(b)
0 0.2 0.4 0.6 0.8 1
0 0.2 0.4 0.6 0.8 1
Cumulative percentage enrichment
in each channel
Percentage of bins
Percentage of tags
IP Input
Signal/Background cutoff
(c)
0 0.2 0.4 0.6 0.8 1
0 0.2 0.4 0.6 0.8 1
Cumulative percentage enrichment
in each channel
Percentage of bins
Percentage of tags
IP Input
Signal/Background cutoff
[image:4.595.57.542.87.499.2](d)
H3K36me3: Scale H3K36me3 by 0.5518
Significant differential enrichment from consensus, qvalue (pFDR): 3.9425e-28
H3K4me1: Scale H3K4me1 by 0.93236
Significant differential enrichment from consensus, qvalue (pFDR): 3.4848e-28
H3K4me2: Scale H3K4me2 by 0.84207
Significant differential enrichment from consensus, qvalue (pFDR): 0.027369
H3K4me3: Scale H3K4me3 by 2.1756
Significant differential enrichment from consensus, qvalue (pFDR): 0.027369
(a)
H3K27ac A1: Scale H3K27ac A1 by 0.90514
Significant differential enrichment from consensus, qvalue (pFDR): 0.00071174
H3K27ac A2: Scale H3K27ac A2 by 0.79977
Significant differential enrichment from consensus, qvalue (pFDR): 0.00059786
H3K27ac B1: Scale H3K27ac B1 by 1.1693
Significant differential enrichment from consensus, qvalue (pFDR): 0.00071174
H3K27ac B2: Scale H3K27ac B2 by 1.153
Significant differential enrichment from consensus, qvalue (pFDR): 0.00071174
(b)
0.0% 14.2% 3.3% 2.7% 14.2% 0.0% 2.1% 1.7% 3.3% 2.1% 0.0% 1.0% 2.7% 1.7% 1.0% 0.0%Percent of genome differentially enriched
H3K36me3H3K4me1H3K4me2H3K4me3 H3K36me3 H3K4me1 H3K4me2 H3K4me3 0 5 10
(c)
0.0% 0.0% 12.3% 12.9% 0.0% 0.0% 10.6% 11.1% 12.3% 10.6% 0.0% 0.0% 12.9% 11.1% 0.0% 0.0% Percent of genome differentially enrichedH3K27ac A1H3K27ac A2H3K27ac B1H3K27ac B2
H3K27ac A1 H3K27ac A2 H3K27ac B1 H3K27ac B2 0 5 10
(d)
0 0.2 0.4 0.6 0.8 1
0 0.2 0.4 0.6 0.8 1
Cumulative percentage enrichment in each channel
Percentage of bins
Percentage of tags
consensus H3K36me3 H3K4me1 H3K4me2 H3K4me3
(e)
0 0.2 0.4 0.6 0.8 1
0 0.2 0.4 0.6 0.8 1
Cumulative percentage enrichment in each channel
Percentage of bins
Percentage of tags
[image:5.595.61.540.84.646.2]consensus H3K27ac A1 H3K27ac A2 H3K27ac B1 H3K27ac B2
(f)
to aid scientists in optimizing their ChIP and library con-struction protocols by identifying biases and estimating the relative effectiveness of different methods.
Detecting bias in the library preparation and sequencing
ChIP-seq data may have many biases and artifacts that can significantly influence the interpretation of the data. CHANCE can rapidly assess the quality of ChIP-seq by detecting two types of bias: bias in base-call content and quality and bias in read density. Severe bias in base-call content and quality can indicate problems with the sequencing [7]. Moreover, the genome-wide distribution of reads is never uniform. Biases in read density for Input have been shown to occur at transcription start sites and internal gene exon boundaries [3] and can also be observed in a cell type-dependent fashion [1]. In addition to the aforementioned ability to detect PCR amplification bias, CHANCE provides several tools to analyze the sources of bias more completely, as described below. Analyzing nucleotide content and base-call quality
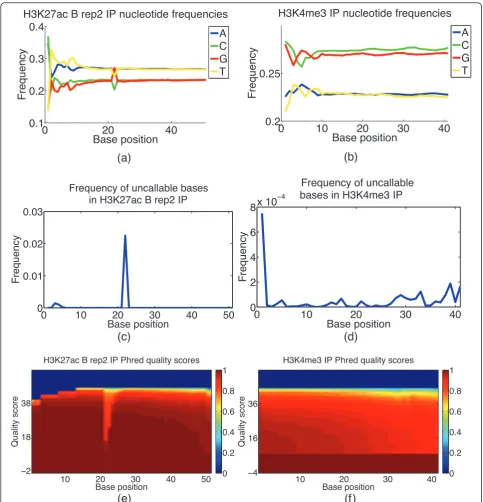
CHANCE displays nucleotide frequency plots as well as the frequency of uncallable bases. It shows the distribu-tion of Phred quality scores at each base. A stretch of uncallable bases, or a stretch of bases with unusual nucleotide content or unusually low base-call quality scores can indicate problems with the sequencing. In Figure 4, we compare the frequency of uncallable bases and nucleotide content at each sequenced base location between the sub-ventricular zone NSC H3K4me3 and whole-limb H3K27ac data sets. We see in the H3K27ac data a stretch of bases from positions 22 to 24 with a noticeable GC content bias and a high frequency of uncallable bases. Moreover, we see a dip in base-call quality scores over the same stretch of bases. This kind of analysis can provide quick, valuable feedback to the sequencing facility.
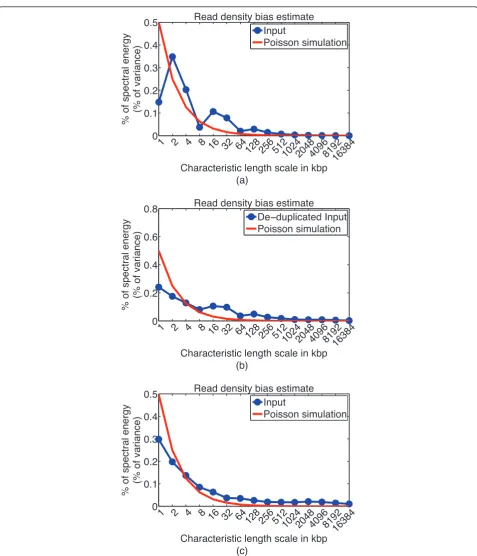
Detecting library preparation bias
Bias in Input read density might reflect copy number alterations in cancer cells, amplification bias in generat-ing duplicate reads, GC content and mappability bias, or inability to sonicate heterochromatin regions. These biases occur at different genomic length scales, and it can be useful to assess the characteristic length scales at which major biases occur, such as to obtain a rough pic-ture of amplified fragment sizes in cancer cells. CHANCE detects bias in read density by using a signal processing technique known as spectral analysis. This technique decomposes the variation in read density into variations on a set of characteristic length scales. CHANCE then compares this decomposition to idealized data, Poisson-simulated at the same depth and coverage as the user’s provided data set. Figure 5 shows a spectral analysis of the Input channels of the mouse sub-ventricular zone and whole limb data sets. On thex-axis is a set of length
scales, from 1 kbp to 16.384 Mbp. On they-axis is the percentage of variance in read density observed in the user’s data at each length scale. If the chromatin sonica-tion or digessonica-tion process were unbiased - or, if the library preparation, sequencing, and mapping were all done without bias or error - then the break points introduced in chromatin would be uniformly distributed genome-wide, and the number of reads mapping to a particular region would be approximately Poisson-distributed with a mean constant throughout the genome. This expected trend would appear in the spectral analysis plots (Figure 5) as a spectral energy distribution that was highest at 1 kbp, indicating a read density profile composed primarily of high frequency fluctuations about a global mean. The spectral energy distribution would then rapidly drop down as we increase the length scale along thex-axis. Figure 5a,b shows Input from mouse NSCs both before and after de-duplication (compare Figure 1b,c and Figure 2b,c). Note that the distribution more closely matches the ideal simulated data after de-duplication, indicating a decrease in bias. For comparison, Figure 5c demonstrates relatively low read density bias in the Input data from mouse whole limb.
Performing validation and comparison to known data sets
Spot validation of ChIP-seq peaks at sites knowna priori to be enriched can provide additional confirmation of the success of an experiment. Comparison with other experi-ments of the same type can also help assess the relative quality of the user’s data. These tests provide additional evidence that a ChIP-seq data set is reliable, as described below.
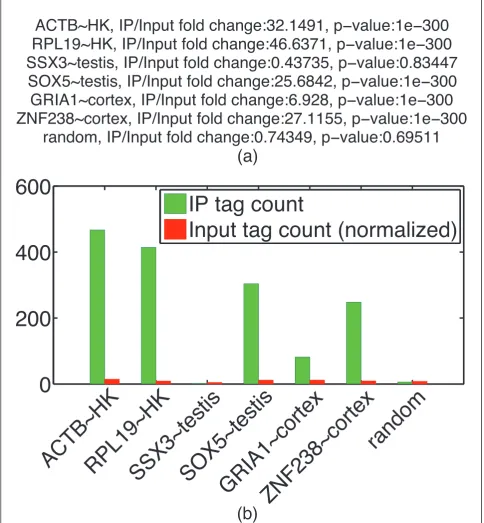
Validating ChIP enrichment on a candidate list of regions CHANCE allows the user to enter a list of candidate regions for spot validation. For example, experimentalists typically check positive control regions via ChIP-qPCR and would be interested in checking the enrichment of those regions in their ChIP-seq data. The spot-check routine returns the fold-change of IP over Input and an estimate of its statistical significance at each of the user-defined locations. Figure 6 shows an example of spot validation of the H3K4me3 H1 HESC data set.
Comparing user data to other experiments
all available ENCODE ChIP-seq data for the same TF or epigenetic mark. It then uses these ENCODE data sets to compute the probability that the user’s experiment is a
statistical outlier. Although agreement with ENCODE data does not guarantee an experiment was successful, a high probability of being an outlier may indicate a data
(a)
(b)
0 10 20 30 40 50
0 0.01 0.02 0.03
Frequency of uncallable bases in H3K27ac B rep2 IP
Base position
Frequency
(c)
0
10
20
30
40
0
2
4
6
8
x 10
4
Frequency of uncallable
bases in H3K4me3 IP
Base position
Frequency
(d)
H3K27ac B rep2 IP Phred quality scores
Base position
Quality score
10 20 30 40 50
38
18
2 0
0.2 0.4 0.6 0.8 1
(e)
H3K4me3 IP Phred quality scores
Base position
Quality score
10 20 30 40
36
16
4 0
0.2 0.4 0.6 0.8 1
(f)
0
20
40
0.1
0.2
0.3
0.4
H3K27ac B rep2 IP nucleotide frequencies
Base position
Frequency
A
C
G
T
0
10
20
30
40
0.2
0.25
H3K4me3 IP nucleotide frequencies
Base position
Frequency
[image:7.595.56.540.87.590.2]A
C
G
T
Figure 4Base call content and quality bias. This figure demonstrates CHANCE output for base call content and quality bias module.(a,b) Plot of nucleotide frequency as a function of base position.(c,d)Plot of the frequency of uncallable bases as a function of base position.(e,f) Heat maps of Phred quality scores, where thex-axis corresponds to base position and they-axis to Phred quality score. The color of a given (x,y) pair gives 1 minus the cumulative density of reads with a quality score ofyor less. That is, it gives the fraction of reads with a quality score ofy
0 0.1 0.2 0.3 0.4 0.5
Characteristic length scale in kbp
% o
f spectra
l energy
(% of variance)
Read density bias estimate
1 2 4 8 16 32 64
128 256 512102420484096819216384 Input
Poisson simulation
(a)
0 0.2 0.4 0.6 0.8
Characteristic length scale in kbp
%
o
f spectra
l energy
(% of variance)
Read density bias estimate
1 2 4 8 16 32 64
128 256 512102420484096819216384 Deduplicated Input Poisson simulation
(b)
0 0.1 0.2 0.3 0.4 0.5
Characteristic length scale in kbp
%
o
f spectra
l energy
(% of variance)
Read density bias estimate
1 2 4 8 16 32 64
128 256 512102420484096819216384 Input
Poisson simulation
[image:8.595.59.537.83.640.2](c)
Validation results:
ACTB~HK, IP/Input fold change:32.1491, pvalue:1e300
RPL19~HK, IP/Input fold change:46.6371, pvalue:1e300
SSX3~testis, IP/Input fold change:0.43735, pvalue:0.83447
SOX5~testis, IP/Input fold change:25.6842, pvalue:1e300
GRIA1~cortex, IP/Input fold change:6.928, pvalue:1e300
ZNF238~cortex, IP/Input fold change:27.1155, pvalue:1e300
random, IP/Input fold change:0.74349, pvalue:0.69511
(a)
0
200
400
600
ACTB~HK
RPL19~HK
SSX3~testis
SOX5~testis
GRIA1~cortex
ZNF238~cortex
random
IP tag count
Input tag count (normalized)
[image:9.595.56.541.114.638.2](b)
Figure 6Spot validation. This figure demonstrates CHANCE’s spot validation module. H3K4me3 in H1 HESCs from the Broad ENCODE data is spot validated for promoter regions of known housekeeping and tissue-specific genes.(a)The summary statement gives the IP over Input fold-change in read count as well as aP-value based on a Poisson null model (see Materials and methods). A random locus is added for comparison. The putative proximal promoter was estimated to 3 kbp upstream to 3 kbp downstream of the transcription start site.(b)Graphical
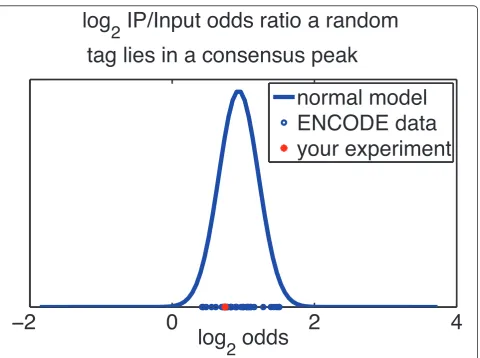
set has problems. Figure 7 shows an example of CHANCE comparison to known data sets for the H3K27me3 in H1 HESCs, also from Broad ENCODE data sets.
Discussion
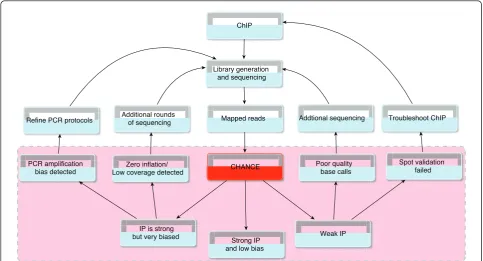
Although software exists for read-trimming and filtering prior to mapping reads to a reference genome and for downstream analysis such as peak calling, there is still a need for a software package designed specifically for ChIP-seq quality control that can provide immediate feedback to experimentalists. Moreover, as ChIP-seq becomes more widely used, there is a need for tools that do not require programming skills to use and that can produce high quality graphical reports. CHANCE fills that gap. Figure 8 illustrates how CHANCE might fit into a typical work flow. CHANCE takes mapped reads in commonly used formats and outputs useful statistical
summaries (for example, those shown in the pink shaded region in Figure 8), which can then provide immediate feedback to the experimentalist and sequencing facility. By serving as a key link between data generation and downstream analysis, CHANCE will help expedite the analysis and optimization of ChIP-seq experiments and will help maintain the high quality requisite for better reproducibility and consistency.
Materials and methods IP enrichment estimation
CHANCE uses SES [1] to compute the largest subset of the genome for which the distribution of reads in IP matches that in Input. This procedure partitions the genome into two sub-regions: a region of potential bio-logical signal and a background region. A scaling factor for IP-Input normalization can then be computed by
2
0
2
4
log
2
odds
log
2
IP/Input odds ratio a random
tag lies in a consensus peak
[image:10.595.60.541.307.665.2]normal model
ENCODE data
your experiment
mean normalizing the read density in IP background to the read density, in the same region, from the Input channel. As a byproduct of this process, an estimate of differential enrichment in the IP over Input (the percen-tage increase in mean tag density in IP compared to Input), as well as an estimate of the percentage of the genome enriched for signal (the relative size of the non-background region) can be obtained. As described in [1], we use a divergence test on the percentage allocation of reads in each channel to determine aP-value for statisti-cal significance.
In order to ascertain the precision and recall of the divergence test as a classifier of successful experiments, we calibrated CHANCE on a data set obtained from the ENCODE repository. We downloaded all ENCODE ChIP-seq data sets with replicate inputs (Additional file 2). We then re-sampled from the genomic distribution of reads in each dataset ten times; these re-sampled data were used to produce an empirical distribution of divergence statistic from all possible cell type-matched IP-Input or replicate Input-Input pairs. The divergence test statistic and asso-ciatedP-value were calculated for each pair. The positive tests derived from IP-Input comparisons were taken as true positives, and the positive tests for Input-Input com-parisons were assumed false positives. This is reasonable
under the assumption that the ENCODE repository is curated and the vast majority of IP-Input pairs represent successful experiments, while the vast majority of compar-isons between Input replicates should show no differential enrichment. In this fashion, we estimate aq-value (positive false discovery rate) for a given value of the divergence test statistic as the fraction of Input-Input pairs in the set all samples with divergence test values greater than or equal to the user’s divergence test value. Theq-value is thus interpreted as the fraction of comparisons from ENCODE that show differential enrichment at the level of the user’s data, but turn out to be technical replicates of the Input channel.
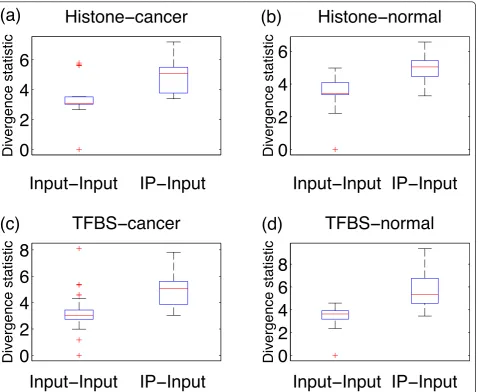
While the majority of histone mark ChIP-seq enrich-ment profiles tend to be spread out, profiles for TFs tend to be more punctate. This spreading can result in a reduc-tion in ChIP signal and lead to a stronger mixing between the distributions of Input versus Input and IP versus Input divergence test statistics for histone mark ChIP-seq, whereas the distributions are more separable for TF ChIP-seq, as shown in Figure 9. This bias might increase the q-value estimate for histone ChIP-seq. Furthermore, can-cer cells frequently suffer from genomic instability, and copy number alterations in background regions can artifi-cially increase the local read density. This bias is reflected
Mapped reads
CHANCE
Troubleshoot ChIP
Weak IP IP is strong
but very biased Strong IP and low bias Library generation
and sequencing
Refine PCR protocols
PCR amplification bias detected
Zero inflation/ Low coverage detected
Additional rounds of sequencing
ChIP
Spot validation failed Poor quality
[image:11.595.56.540.89.350.2]base calls Addtional sequencing
in the fact that the null distribution of divergence test values for Input versus Input comparisons has a heavier tail in cancer samples compared to normal tissues. In order to account for these potential biases, CHANCE reportsq-value estimates of enrichment separately for each of the following categories of training data: (a) his-tone mark in normal cells, (b) hishis-tone mark in cancer cells, (c) TF in normal cells, (d) TF in cancer cells, and (e) all samples. Figure 9 shows whisker-box plots of the diver-gence test statistic for the ENCODE training data sepa-rated into the above categories. We do indeed see a slightly stronger mixing of the IP-Input with the Input-Input distri-bution when comparing histone mark data in the top
panels (Figure 9a,b) with the TF data in the bottom panels (Figure 9c,d), as evidenced by a higher top whisker mark in the IP-Input distributions for the TF data compared to the histone data. Moreover, comparing the cancer data in the left panels (Figure 9a,c) with the normal data on the right panels (Figure 9b,d) shows that the cancer data distribution of Input-Input comparisons is indeed heavier tailed than the Input-Input distribution of the normal data. Conse-quently, one should expect higher false discovery rates in histone and cancer samples for the reasons mentioned pre-viously. CHANCE will alert the user to a possibly failed sample if all of theq-values are above 5%, but the user may also compare their experiment by category.
0
2
4
6
+LVWRQHïFDQFHU
0
2
4
6
+LVWRQHïQRUPDO
0
2
4
6
8
7)%6ïFDQFHU
0
2
4
6
8
7)%6ïQRUPDO
,QSXWï,QSX
t
,3ï,QSX
t
,QSXWï,QSX
t
,3ï,QSXW
,QSXWï,QSX
t
,3ï,QSX
t
,QSXWï,QSX
t
,3ï,QSXW
D
F
E
G
'LYHUJHQFHVWDWLVWLF
'LYHUJHQFHVWDWLVWLF
'LYHUJHQFHVWDWLVWLF
[image:12.595.62.541.88.480.2]'LYHUJHQFHVWDWLVWLF
Detection of insufficient sequencing depth in the Input channel
As in [1], letp(a) denote the percentage of reads in the IP channel contained in the firstapercent of 1 kb non-overlapping bins sorted in an increasing order of read density. Similarly, letq(a) denote the percentage of the matching tag counts in Input, reordered by the sorting induced by the sorting of the IP channel. If IP had suffi-cient enrichment, then we must have p(a)≤ q(a), since reads accumulate significantly in a small genomic subset targeted by IP, while the majority of sequences in the Input channel are more uniformly distributed through-out the genome. On the other hand, if there is insuffi-cient sequencing depth in the Input channel, then there will be abundant zero counts in Input tag bins; and for a sufficiently small, we will have q(a) ≤ p(a). If CHANCE detects this crossing of p(a) from below byq (a), it reports a warning of potential low coverage in the Input channel.
Detection of insufficient sequencing depth in the IP channel
Similarly, if there is insufficient sequencing depth in the IP channel, there will likewise be abundant zero counts in its tag bins. This implies thatp(a) will be zero fora ≤a0 for somea0> 0,a0 therefore being the percentage of the genome with zero coverage. In some extreme cases, the maximal percentage differential enrichment of IP over Input occurs at a0 (for example, Figure 2a), indicating that an insufficient coverage in the IP channel can create too many zero-count bins, which drive the background noise estimate to zero. In this case, CHANCE will excise the regions of zero coverage in the IP and re-compute the percentage enrichment; it will also report a warning of insufficient sequencing depth in the IP channel.
Detection of potential PCR amplification bias
If 25% or more of the reads from either channel map to less than 1% of the genome, then there tend to be severe point spikes in the enrichment profile, most likely corre-sponding to mapping or PCR biases. CHANCE reports a warning if this condition is satisfied.
Read density bias estimation
The read density bias estimation module has two com-ponents: a spectral analysis and an idealized Poisson simulation based on the user’s data. Spectral analysis is a tool that allows one to determine how much of the variance in local coverage in the Input channel occurs over a given genomic length scale. An ideal Input sam-ple would have only small fluctuations in coverage as we move along the genome and would have all of its variance at small length scales. In a more realistic
setting, the distribution of variance would be concen-trated at a small length scale and rapidly decrease as a function of increasing length scale, displaying some minor long-distance correlations in read density. A heavily biased sample will have systematic and reprodu-cible fluctuations in mapped read density at several length scales, corresponding to condensed chromatin fragments resistant to sonication, PCR amplification bias, or genomic amplification and deletion events in cancer cells. In the spectral analysis plot, this kind of fluctuation in read density will often appear as a local maximum. For example, in Figure 5a we have a sample with a large number of duplicate reads. Note the spike in percentage variance that occurs at a length scale 2 kbp, indicating a large number of‘point spikes’in the density plot that rise and fall over 2 kbp intervals. This fluctuation disappears after de-duplicating reads, as shown in Figure 5b, suggesting that spectral analysis provides an efficient way of detecting PCR amplification bias during library preparation. The spectral analysis was done by using a decimated Haar wavelet decompo-sition, as described in [1].
The second component is a Poisson simulation. The idea is to perform a spectral analysis on an idealized set of tag counts that is unbiased, but is none the less sampled to the same depth (the same genome-wide mean tag count) and distribution of coverage (the same genome-wide spread in tag count). The spectral energy landscape of a sample with minimal bias will be similar to that of the simulation (compare Figure 5a and Figure 5c). To generate an unbiased simulation, we used a Poisson-Gamma mixture model. We performed the simulation by fitting a Gamma distribution to the set of tag counts per 1 kbp observed in the Input channel, using maximum likelihood. We then generated a list of tag counts by first sampling from the Gamma distribu-tion and using this value as the mean of Poisson distri-bution. We then sampled from the Poisson distribution to obtain the tag count.
Normalizing multiple IPs for differential analysis
For multiple IP differential analysis, CHANCE first nor-malizes each sample to the mean read depth over all samples considered. CHANCE then forms a consensus sample using a multi-channel signal combiner described in [17-19]. Briefly, given nIP samples, alignments are first binned into 1 kbp non-overlapping windows. Then, if sij is the count in thej-th bin of thei-th sample, the
combiner chooses positive weights {w1,...,wn} to form the
consensus:
cj= n
i=1
The weights are chosen to maximize
n
k=1
n
l=1
Mklwkwl
such that
n
i=1
wi= 1, whereMklis the sample covariance
matrix ofsij. See [17-19] for the derivation. This has the effect of determining a consensus whose background component will be the largest possible subset of the genome of mutual background for allnoriginal samples. Lastly, SES is used to determine differential enrichment of each sample from the consensus, as well as the pair-wise differential comparisons between samples.
Spot validation
The user can provide CHANCE with a list of genomic loci to spot validate positive and negative control regions, such as those used in ChIP-qPCR prior to sequencing. The fold-change in tag count is reported. The reported P-value for each region is the probability of the tag count in the IP channel, under a Poisson null model with a mean equal to the observed tag count in the Input chan-nel. This is not intended for peak calling but rather for validation and confirmation of CHANCE’s other quality metrics. In other words, although a large fold-change and small PoissonP-value do not necessarily imply a success-ful IP, lack of enrichment in multiple positive control loci will suggest problems with sequencing.
Comparison with ENCODE
The ENCODE project provides representative transcrip-tional and epigenetic maps of the mammalian genomes. We thus reasoned that the ENCODE data can provide a rough landscape of TF binding and epigenetic modifica-tion sites that are applicable to multiple cell types. The ‘Comparison with ENCODE’module thus allows one to compare one’s own dataset with corresponding ENCODE datasets to determine if the user’s data show an accumula-tion of reads within ENCODE peaks. For each TF or epi-genetic mark for which ENCODE has called peaks (Additional file 2), we assembled a union peak set. The union peak set is the union of all peaks for the same TF or histone mark from multiple cell types. We then count the fractionpof user reads that map to the union set in the IP channel, and the fractionqof reads that map to the union set from the Input channel. The relative odds of observing a read from the IP channel in the union set, compared to Input, can then be expressed by the odds ratiop/(1 -p)/q/ (1 -q). We then compute the same odds ratio for each IP-Input pair, in ENCODE, for the same TF or histone mark. The distribution of odds ratios gives the user a sense of how cell type-specific enrichment for that particular mark is. If the user’s odds ratio is much less than one, this indi-cates that the user’s data set is somewhat of an outlier, compared to ENCODE. We compute the log of the odds
ratio, since the log odds is approximately normal. This allows us to fit a normal curve to the distribution of ENCODE log odds ratios. The cumulative distribution at the log odds of the user’s data then gives a probability indicating how much of an outlier the user’s data set is. Although not definitive of a failed experiment on its own, a small odds ratio provides additional evidence of a poten-tially failed experiment.
Software availability
CHANCE is open source, published under the GNU General Public License. The Matlab source code, User Guide, examples, and executables for Mac OS, Win-dows, and Linux are available at https://github.com/son-glab/chance.
Additional material
Additional file 1: CHANCE feature comparison table.
Additional file 2: CHANCE training data table. This file enumerates the experiment information and url for each ENCODE sample used in either the training data set for the false discovery rate computation in the“IP enrichment”module or the“Comparison with ENCODE module”.
Abbreviations
ChIP: chromatin immunoprecipitation; CHANCE: CHip-seq ANalytics and Confidence Estimation; GEO: Gene Expression Omnibus; GUI: graphical user interface; HESC: human embryonic stem cell; IP: immunoprecipitation; NSC: neural stem cell; qPCR: quantitative polymerase chain reaction; SES: signal extraction scaling; TF: transcription factor; UCSF: University of California: San Francisco.
Acknowledgements
We would like to thank Julia VanderMeer, Nadav Ahituv, Kiyoub Park, and Daniel Lim for sharing their data. We thank Brett Johnson, Robert Bell, and Joseph Costello for useful discussions. This project was in part supported by grants from the Sontag Foundation and the National Cancer Institute (R01CA163336). The content is solely the responsibility of the authors and does not necessarily represent the official views of the National Cancer Institute or the National Institutes of Health.
Author details
1Institute for Human Genetics, UCSF, 513 Parnassus Avenue, Box 0794, San
Francisco, CA 94143-0794, USA.2The Eli and Edythe Broad Center of Regeneration Medicine and Stem Cell Research, UCSF, 35 Medical Center Way, San Francisco, CA 94143-0525, USA.3Department of Epidemiology and
Biostatistics, UCSF, 185 Berry Street, Lobby 5, Suite 5700, San Francisco, CA 94107, USA.4Department of Bioengineering and Therapeutic Sciences, UCSF,
513 Parnassus Avenue, San Francisco, CA 94143-0912, USA.
Authors’contributions
AD and JSS designed the project and developed the underlying algorithms. AD designed and developed the software package. AN implemented the BAM/SAM file reader interface. AD and AN wrote the User Guide, and all authors together wrote the paper.
Received: 7 August 2012 Revised: 19 September 2012 Accepted: 15 October 2012 Published: 15 October 2012
References
2. Xu H, Handoko L, Wei X, Ye C, Sheng J, Wei CL, Lin F, Sung WK:A signal-noise model for significance analysis of ChIP-seq with negative control.
Bioinformatics2010,26:1199-204.
3. Cheung MS, Down Ta, Latorre I, Ahringer J:Systematic bias in high-throughput sequencing data and its correction by BEADS.Nucleic Acids Res2011,39:e103.
4. Planet E, Attolini CSO, Reina O, Flores O, Rossell D:htSeqTools: high-throughput sequencing quality control, processing and visualization in R.Bioinformatics2012,28:589-590.
5. Avardis NGS..[http://www.avadis-ngs.com/].
6. FastQC..[http://www.bioinformatics.babraham.ac.uk/projects/fastqc/]. 7. Lassmann T, Hayashizaki Y, Daub CO:SAMStat: monitoring biases in next
generation sequencing data.Bioinformatics2011,27:130-131. 8. Homer..[http://biowhat.ucsd.edu/homer/ngs/index.html]. 9. Solexa QA..[http://solexaqa.sourceforge.net/].
10. Smeds L, Künstner A:ConDeTri - a content dependent read trimmer for Illumina data.PLoS ONE2011,6:e26314.
11. Pandey RV, Nolte V, Schlötterer C:CANGS: a user-friendly utility for processing and analyzing 454 GS-FLX data in biodiversity studies.BMC Res Notes2010,3:3.
12. Giardine B, Riemer C, Hardison RC, Burhans R, Elnitski L, Shah P, Zhang Y, Blankenberg D, Albert I, Taylor J, Miller W, Kent WJ, Nekrutenko A:Galaxy: a platform for interactive large-scale genome analysis.Genome Res2005,
15:1451-1455.
13. BED/tagAlign file format..[http://genome.ucsc.edu/FAQ/FAQformat]. 14. SAM/BAM file format..[http://samtools.sourceforge.net/].
15. Langmead B, Trapnell C, Pop M, Salzberg SL:Ultrafast and memory-efficient alignment of short DNA sequences to the human genome.
Genome Biol2009,10:R25.
16. Aird D, Ross MG, Chen WS, Danielsson M, Fennell T, Russ C, Jaffe DB, Nusbaum C, Gnirke A:Analyzing and minimizing PCR amplification bias in Illumina sequencing libraries.Genome Biol2011,12:R18.
17. Cover TM, Thomas JA:Elements of Information TheoryNew York: John Wiley and Sons; 2006.
18. Cheung K, Vilnrotter V:Channel Capacity of an Array System for Gaussian Channels With Applications to Combining and Noise Cancellation. TDA Progress Report 42-124NASA Jet Propulsion Laboratory, Communications Systems and Research Section; 1996 [http://tmo.jpl.nasa.gov/
progress_report/42-124/124D.pdf].
19. Guo D:Gaussian channels: information, estimation and multiuser detection.PhD thesisPrinceton University; 2004.
doi:10.1186/gb-2012-13-10-r98
Cite this article as:Diazet al.:CHANCE: comprehensive software for quality control and validation of ChIP-seq data.Genome Biology201213: R98.
Submit your next manuscript to BioMed Central and take full advantage of:
• Convenient online submission
• Thorough peer review
• No space constraints or color figure charges
• Immediate publication on acceptance
• Inclusion in PubMed, CAS, Scopus and Google Scholar
• Research which is freely available for redistribution