2017 2nd International Conference on Artificial Intelligence and Engineering Applications (AIEA 2017) ISBN: 978-1-60595-485-1
Research on Quantitative Assessment of Cyberspace
Security Status, Based on AHP and Optimized ERM
Mix Algorithm
JIABIN LI and ZHI XUE
ABSTRACT
Since the concept of Cyberspace is becoming more important, the traditional security assessment that mainly aimed at the quantity and details of threats is not enough. Especially with the rapid growth of the scale of cyberspace, there should be a assessment method to cover both overall and detail vision. To meet the need, this paper put forwards a holistic trend oriented quantitative assessment system of cyberspace security status. The quantitative assessment process combines the traditional AHP and an Optimized method of ERM together to determine the weight values. The combination algorithm improves the bad performance of AHP under huge matrices situation, and also revises the result of ERM when the dispersion differs, so as to make the quantitative assessment more efficient, feasible and accurate.
KEYWORDS
Cyberspace Security, Cyberspace Security Status, Quantitative Assessment, AHP, Optimized Expert Ranking Method.
INTRODUCTION
The Definition of Cyber Security
Cyber security, or cyberspace security, different from traditional “network security” and “information security”, is defined as “preservation of confidentiality, integrity and availability of information in Cyberspace” in [1]. And, the word “Cyberspace” above means a “complex environment resulting from the interaction of people, software and services on the internet by means of technology devices and networks connected to it”. This means when saying cyber security, we not only consider of the security of a software or a network session alone, but should also take assets, humans and the interaction into consideration.
Since we have put forward the conception of cyber security, there’s still not an accepted international standard or methods of assessing the status of cyberspace security, which is exactly the most concerned matter for the managers.
_________________________________________
Corresponding Author: Jiabin Li, School of Cyber Security, Shanghai Jiao Tong University, 800 Rd. Dongchuan, Shanghai, China [email protected]
There are some methods and tools to judge whether a network node or system is secure or not indeed, such as some vulnerability mining tools and IDS, etc., but we need a more comprehensive, intuitional and, especially, non-IT friendly system, and that’s what this paper has researched: a quantitative assessment method on cyberspace security status.
The Quantitative Assessment of Cyberspace Security Status
To make a quantitative assessment is to calculate or forecast the status of the target system. In the past, Network Security Situation Assessment (NSSA) is often used by many researchers to judge the network security status. This assessment method mainly contains these three types of indicators: running state, vulnerability and threat events. To optimize the network security status assessment and prediction method, researchers at home and abroad have carried out many researches: Reference [2] put forward a quantitative assessment method, which is based on Naive Bayesian (NB) and is convenient to be used in dealing with uncertain information sources; Ref. [3] proposed to percept network security status by using neural network. With the help of RBF neural network, the mapping relation in the non-linear network can be identified, the network parameters can be optimized and the self-adaptive genetic algorithm can be used to assess network security status. Ref. [4] proposed a penetration test framework which aimed to reveal possible vulnerabilities in each network layer, and to reveal the side effect to the whole network security and its users resulting from the error configuration in public network. There exists lots of researches talking about assessment methods on network security status, but throughout all the researches, most of them were narrowly focused on network security itself, or just focusing on the quantity of threat events or the details. These researches ignored the entirety and interaction of the whole system, namely, the mutual relationship between human and system, the impact of threat events, the response to the threat from supporting systems and so on, all these are important to cyberspace security research.
Based on the ISO-27000 family standards, this article puts forward a new cyberspace security status assessment method, which collects data from assets and information sources more than from logs, and takes vulnerabilities discovery and remediation and threat events’ impact and response as evaluation basis. By optimizing the AHP and ERM algorithm, the weight value of indicators can be calculated more effectively.
This method makes up for the lack of response and feedback in cyberspace security status analysis. This paper analyses the whole system entirely and optimizes the AHP method so that a more efficient and accurate assessment framework can be built up.
ASSESSMENT METHOD OF CYBERSPACE SECURITY STATUS
Definition
Definition 1: Cyberspace Security Status Value (CSSV) is characterized by two dimensions: Cyberspace Vulnerability Index (Val) and Cyberspace Threat Index (Thru). Here exists the function: , , Function f is implemented by weighted addition.
capability to remediate vulnerabilities . Here exists the Function:
, , . Function g is implemented by weighted addition.
Definition 3: The cyberspace threat index (Thru) is calculated from these three dimensions: The scale of the threat in the system , the impact and the response to threats . Here exists the Function: , , . Function h is implemented by weighted addition.
Index System
In this paper, the assessment index system of the cyberspace security status is based on ISO-27000 family, and refers to the 20 control points from the CIS CSC standard developed by the SANS Institute [5].All the data sources in the system can be divided into two categories: the first one takes all the assets in cyberspace as direct information sources, which mainly contains the degrees of scale of vulnerability, the scale of threat, the impact range of threats, etc. The second type is provided by security departments, mainly including vulnerability details, vulnerability remediation, threat event response, etc.
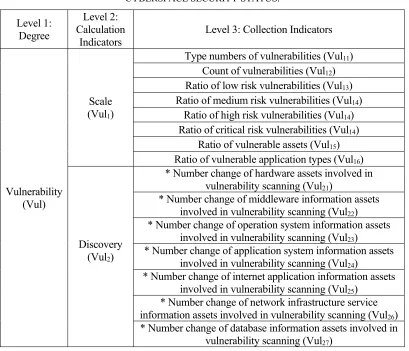
[image:3.612.95.504.375.726.2]This assessment system can be divided into two big dimensions: vulnerability and threat, and includes more than 6 level-2 calculation indicators, including the influence and response, and over 60 level-3 collection indicators. All the basic indicators are listed in the following Table 1.
TABLE 1. QUANTITATIVE ASSESSMENT INDEX SYSTEM OF CYBERSPACE SECURITY STATUS.
Level 1: Degree
Level 2: Calculation
Indicators
Level 3: Collection Indicators
Vulnerability (Vul)
Scale (Vul1)
Type numbers of vulnerabilities (Vul11)
Count of vulnerabilities (Vul12)
Ratio of low risk vulnerabilities (Vul13)
Ratio of medium risk vulnerabilities (Vul14)
Ratio of high risk vulnerabilities (Vul14)
Ratio of critical risk vulnerabilities (Vul14)
Ratio of vulnerable assets (Vul15)
Ratio of vulnerable application types (Vul16)
Discovery (Vul2)
* Number change of hardware assets involved in vulnerability scanning (Vul21)
* Number change of middleware information assets involved in vulnerability scanning (Vul22)
* Number change of operation system information assets involved in vulnerability scanning (Vul23)
* Number change of application system information assets involved in vulnerability scanning (Vul24)
* Number change of internet application information assets involved in vulnerability scanning (Vul25)
* Number change of network infrastructure service information assets involved in vulnerability scanning (Vul26)
* Number change of internal management application system involved in penetration test (Vul28)
* Number change of office automation application system involved in penetration test (Vul29)
* Number change of internet application system involved in penetration test (Vul210)
* Number change of applications implemented security evaluation before on-line (Vul211)
Count of vulnerabilities, whose discovery time is one year later than its CVE announced time (Vul212)
Count of vulnerabilities, whose discovery time is within one year after its CVE announced time (Vul213)
*Number change of information sources of each department and environment (Vul214~Vul2??)
Remediation (Vul3)
Average period of low risk vulnerability patching after found (Vul31)
Average period of medium risk vulnerability patching after found (Vul32)
Average period of high risk vulnerability patching after found (Vul33)
Average period of critical risk vulnerability patching after found (Vul34)
Ratio of patched vulnerabilities (Vul35)
Number of hosts, vulnerabilities all patched (Vul36)
Number of offline applications, vulnerabilities all patched (Vul36)
Number of online applications, vulnerabilities all patched (Vul37)
Ratio of low risk vulnerabilities patched (Vul38)
Ratio of medium risk vulnerabilities patched (Vul39)
Ratio of high risk vulnerabilities patched (Vul310)
Ratio of critical risk vulnerabilities patched (Vul311)
Threat Event (Thru)
Scale (Thr1)
Count of all events (Thr11)
Count of normal events (Thr12)
Count of important events (Thr13)
Count of scanning attack events(Thr14)
Count of malware events (Thr15)
Count of information destroy events (Thr16)
Count of network intrusion events (Thr17)
Count of internal violation events (Thr18)
Impact (Thr2)
Number of impacted IP address in production environment (Thr21)
Number of impacted IP address in office environment (Thr22)
Number of impacted IP address of Internet exit (Thr23)
Number of 3rd party information sources (Thr
24)
Number of impacted information sources of disaster
Number of impacted information sources of disaster
recovery environment (Thr25)
Response (Thr3)
Average process period of normal event: services interference (Thr31)
Average process period of normal event: denial of service (Thr32)
Average process period of normal event: scanning attack (Thr33)
Average process period of normal event: social engineering (Thr34)
Average process period of normal event: malware (Thr35)
Average process period of normal event: information destroy (Thr36)
Average process period of normal event: network intrusion (Thr37)
Average process period of normal event: internal violation (Thr38)
Average process period of important event: services interference (Thr39)
Average process period of important event: denial of service (Thr310)
Average process period of important event: scanning attack (Thr311)
Average process period of important event: social engineering (Thr312)
Average process period of important event: malware (Thr313)
Average process period of important event: information destroy (Thr314)
Average process period of important event: network intrusion (Thr315)
Average process period of important event: internal violation (Thr316)
* Contents listed in Table 1 only involves the minimum inspection indices of the assessment. In practical use, the characteristic features and indicators shall be added into this table. For example: in banking and insurance industries, stealing fund should be taken into consideration as kind of threat events.
** The ‘*’ marked indicators will do a subtraction with the number of that indicator during the past specific period (e.g., the past 30 days) as a pretreatment.
The system constitutes a hierarchical cyberspace security status assessment system from bottom to top, which integrates multi-source heterogeneous information into a quantified security value.
Assessment Characteristics
Threshold Uncertainty
As the weight values of collection points and dimensions vary from the belonging domains and industries, the expert evaluation standard and focus would be quite different. So, it is impractical to define a certain dangerous-state threshold value in advance. That means it is not necessarily correct to regard a system whose CSSV is below 60 (in hundred-mark system) dangerous. Of course, the evaluated departments can set a dangerous threshold in advance for the following circumstance: If the CSSV value or some sub-value has been lower than the pre-set threshold for a long time and the actual situation is safe (or acceptable), then it is necessary to rebuild the index system or to invite experts to correction the weight values, the proposed method on the determining the weight values will be detailed in Section 3 of this paper.
Spatial-Temporal Continuity
As what this system considers is more than an individual threat or threats occurs in a certain period, a single absolute evaluation value will not be a comprehensive reference. It is necessary to compare the security status value vertically with itself and horizontally with peer departments, so as to obtain the cyberspace security status variation of the evaluated department.
The evaluated departments can take first time or previous evaluation results as an initial reference value. The evaluated value in next assessment period can be compared with the previous one so as to find out in which part the security capacity improved or declined. At the same time, the evaluation results can also be used in comparison among departments in the same industry or subdivisions of a department. This will help to find out where the security weakness and vulnerability exist among the homogeneous organizations so that the departments can take measures in a timely manner.
In addition, scheduling problem involved in this system could be sequentially predicted with Hidden Markov Model (HMM). Possible risks in the future could then be avoided in advance. This kind of problems have already been studied by scholars, and few details would be repeated in this paper.
QUANTITATIVE ASSESSMENT METHODS
Analytic Hierarchy Process
Analytic Hierarchy Process (AHP), developed by Prof. Thomas L. Saaty in 1971, is a hierarchical, qualitative and quantitative method of multiple criteria decision-making, and mainly applied to decision-making problems with multiple evaluation criteria. Its characteristic is to systemize and hierarchize the problem, thus to help the decider quantitatively analysis the whole assessment of the target system.
Expert Ranking Method
The Expert Ranking Method (ERM) put forward in Ref. [7] is based on the Delphi Method. The Delphi Method solicit the views of experts in the field on the way by anonymous to determine the weight factor of n indicators in the evaluation system. It finished until have convergence of views of experts, then the mean of weight can be seen as the weight of the corresponding indicator [8].” On this basis, ERM requests experts to rank the indicators according to importance. The most important one is ranked 1, the second one is marked 2, and so on.
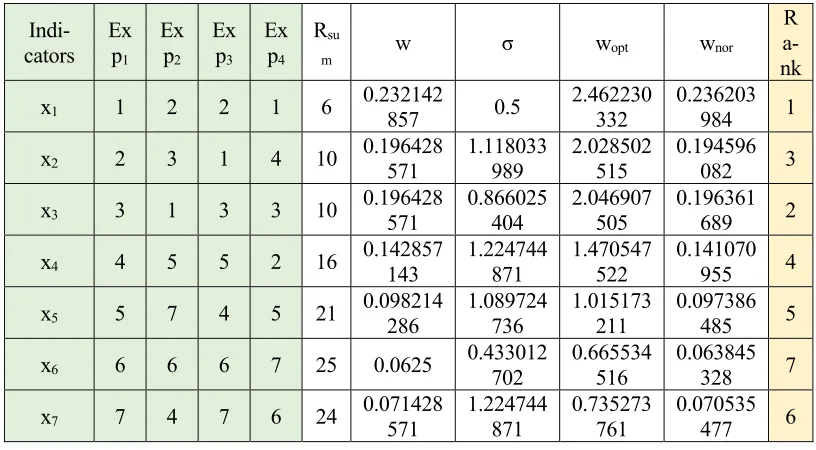
Suppose there are n indicators and m experts in the ERM process, then there will be a positive integer matrix (as Table 2).
Names the serial number of each indicator as its Rank (R), and the sum of ranks given by all the experts as its Rank Sum (Rs). The Rs of the jst indicator is marked as Rsj, then:
∑ , , ∈ (1)
Let wj be the weight of the jst indicator, then:
2 , , , ∈ (2)
The Rs and w values can be calculated with Formula (1) and (2), as Table 3.
TABLE 2. A N=7, M=4 RANKING MATRIX USING ERM.
Indicators Exp1 Exp2 Exp3 Exp4
x1 1 2 2 1
x2 2 3 1 4
x3 3 1 3 3
x4 4 5 5 2
x5 5 7 4 5
x6 6 6 6 7
x7 7 4 7 6
TABLE 3. RS AND W CALCULATED FROM TABLE 2.
Indicators Exp1 Exp2 Exp3 Exp4 Rsum w Rank
x1 1 2 2 1 6 0.232142857 1
x2 2 3 1 4 10 0.196428571 3
x3 3 1 3 3 10 0.196428571 3
x4 4 5 5 2 16 0.142857143 4
x5 5 7 4 5 21 0.098214286 5
x6 6 6 6 7 25 0.0625 7
TABLE 4. STANDARD DEVIATION OPTIMIZED WEIGHT TABLE.
Indi-cators
Ex p1
Ex p2
Ex p3
Ex p4
Rsu
m w σ wopt wnor
R a-nk
x1 1 2 2 1 6 0.232142857 0.5 2.462230332 0.236203984 1
x2 2 3 1 4 10 0.196428571 1.118033989 2.028502515 0.194596082 3
x3 3 1 3 3 10 0.196428571 0.866025404 2.046907505 0.196361689 2
x4 4 5 5 2 16 0.142857143 1.224744871 1.470547522 0.141070955 4
x5 5 7 4 5 21 0.098214286 1.089724736 1.015173211 0.097386485 5
x6 6 6 6 7 25 0.0625 0.433012702 0.665534516 0.063845328 7
x7 7 4 7 6 24 0.071428571 1.224744871 0.735273761 0.070535477 6
Optimization of Expert Ranking Method
ERM aggregates the experts’ opinions by figuring out Rs values, and uses the iterative investigations to improve the accuracy. However, a lot of details will be lost if rank values are simply added up, and errors will occur. In Table 3, although the 4 experts’ ranks of the two indicators x2 and x3 are different, the results of their Rs value are unexpectedly the same. Therefore, the author considers introducing the standard deviation to correct the weights, the revised formula is:
∆ (3)
The standard deviation reflects the degree of dispersion. In ERM, the larger the standard deviation σ of a indicator is, the more inconsistent the experts’ opinions are, the less convincing Rs and w values are, and the smaller the scaling effect on the origin weight should be. Thus, the correction should be :
∆
(4)In consideration of that the weight value w ranges within the interval of 0,1 , has too much interference, so revise Formula (3) into the following Formula (5):
10 ∙
∆
∙ 10
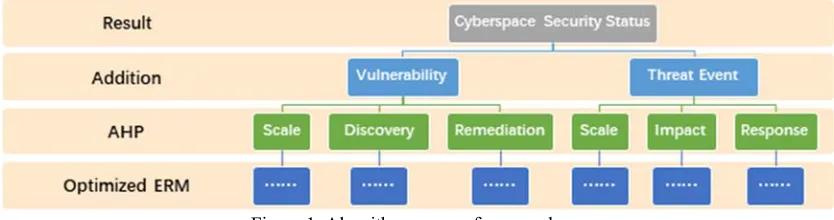
(5)Figure 1. Algorithm process framework.
AHP-OERM Mixed Method
For there are over 60 collection indicators in the index system, and most level-2 indicators are related to 10 more collection indicators, using AHP alone to get the comparison matrices and calculate the weight values would be an incredibly big job; Along with that the comparison matrices are decided by experts artificially, the unavoidable subjectivity and unilateralism will be even amplified, which is doomed to fail to pass the consistency test. Even worse, then the experts have to argue to revise the huge comparison matrices again and again.
Considering the problems above, although AHP fits the hierarchical demands in this assessment system, it doesn’t work well in the calculation phase for those levels that have too many indicators. Therefore, this article puts forward an algorithm that applies AHP to the 2nd level of calculation indicators, and the Optimized ERM to the 3rd level of collection indicators, which can get the Cyberspace Security Status Value more efficiently and accurately.
As shown in Figure 1, the calculation process of Cyberspace Security Status Value is as following:
Data collection. Collect and briefly handle all the 3rd level indicators.
Experts Rank. Invite the experts to rank all the 3rd level indicators, act the ERM
process, and calculate the weight values of those indicators according to the Optimized ERM.
Calculate the 2nd level indicator values.
AHP process. Invite experts to complete the comparison matrices of the 2nd level
indicators and calculate the weight values. Calculate the 1st level indicator values.
Calculate the Cyberspace Security Status Value, and the process ends.
CONCLUSION
Different from the present threat-event-only aimed security assessment, this paper firstly puts forwards a holistic trend oriented quantitative assessment system of cyberspace security status, which has a 3-level hierarchy and over 60 indicators. The system takes the vulnerability discovery and remediation as well as the threat event’s impact and response as main consideration around the core of the information assets.
The quantitative assessment process combines the traditional AHP and the optimized ERM together to determine the weight values. With the insurance of ERM converges, the combination of the two algorithm improves the bad performance of AHP under huge matrices situation, and also revises the result of ERM when the dispersion differs, so as to make the quantitative assessment more efficient, feasible and accurate.
ACKNOWLEDGEMENTS
I would like to express my gratitude to all those who have helped me during the writing of this paper. I gratefully acknowledge the help of my supervisor Professor Xue Zhi. I do appreciate his patience and professional instructions during my paper writing. Also, I would like to thank my wife Shao Yue, who gave me encouragement and helped to proofread this paper.
Last but not the least, my gratitude also extends to my family who have been assisting, supporting and caring for me all of my life.
This work was supported by the Key Program of the Natural Science Foundation of China (No. 61332010).
Corresponding Author: Jiabin Li, School of Cyber Security, Shanghai Jiao Tong University, 800 Rd. Dongchuan, Shanghai, China [email protected].
REFERENCES
1. ISO/IEC 27032:2012, Information technology – Security techniques – Guidelines for cybersecurity [S].
2. Wen Z., Chen Z., Tang J. Assessing network security situation quantitatively based on information fusion[J]. Journal of Beijing University of Aeronautics & Astronautics, 2016.
3. Xie L., Wang Y., Jinbo Y.U. Network security situation awareness based on neural networks [J]. Journal of Tsinghua University, 2013, 53(12): 1750-1760.
4. Bechtsoudis A., Sklavos N. Aiming at Higher Network Security through Extensive Penetration Tests [J]. IEEE Latin America Transactions, 2012, 10(3): 1752-1756.
5. SANS, CIS. The Critical Security Controls for Effective Cyber Defense Ver. 6.0 [S].
6. Shuxiang Yao. A Research on Information Security Risk Assessment Method Based on AHP [J]. Jiangsu Science & Technology Information, 2015(3): 63-65.
7. Zhonglai Li. Expert Survey Method of Factor Weight Determination [J]. Subject Education. 1991(2): 35-38.