University of Huddersfield Repository
Pislaru, Crinela
Parameter identification and hybrid mathematical modelling techniques applied to nonlinear control systems
Original Citation
Pislaru, Crinela (2001) Parameter identification and hybrid mathematical modelling techniques applied to nonlinear control systems. Doctoral thesis, University of Huddersfield.
This version is available at http://eprints.hud.ac.uk/id/eprint/4616/
The University Repository is a digital collection of the research output of the University, available on Open Access. Copyright and Moral Rights for the items on this site are retained by the individual author and/or other copyright owners. Users may access full items free of charge; copies of full text items generally can be reproduced, displayed or performed and given to third parties in any format or medium for personal research or study, educational or notforprofit purposes without prior permission or charge, provided:
• The authors, title and full bibliographic details is credited in any copy; • A hyperlink and/or URL is included for the original metadata page; and • The content is not changed in any way.
For more information, including our policy and submission procedure, please contact the Repository Team at: [email protected].
PARAMETER IDENTIFICATION AND HYBRID
MATHEMATICAL MODELLING TECHNIQUES APPLIED TO
NON-LINEAR CONTROL SYSTEMS
CRINELA PISLARU
A thesis submitted to the University of Huddersfield in partial fulfilment
of the requirements for the degree of Doctor of Philosophy
November 2001
To my parents, Inna and Emanuel
ABSTRACT
The study is concerned with the mathematical modelling and parameter identification of non-linear motion control systems. The control systems under review are the axis motion control systems for a 3-axis CNC machine tool.
The modelling process commences with lumped parameter methods applied to each element and then to each axis in turn. Comparing the dynamic performance of the simulated axis drive with the machine tool axis performance identifies the need for a modular load and the introduction of measured non-linear effects.
In order to achieve a realistic dynamic performance, a hybrid model incorporating a distributed load, explicit damping factors and measured non-linear effects was developed. The influence of factors like damping coefficients, the moving mass, velocity and positional gains, time constants of the servo control system on the servo characteristics of machine tool has been determined. Different friction models have been investigated and an effective simulation method has been developed for simulation purposes. This model represents to a large extent the dynamic behaviour of the drives from the actual machine, a fact proven by the comparison between the simulated and measured results.
For multi-axis control, measured geometric errors at the machine were needed to be included in the model in order to achieve realistic contouring performance. The models were validated by comparison with measurements at the machine.
ACKNOWLEDGEMENTS
I would like to thank to my Director of studies Professor Derek G. Ford for giving me the opportunity to join the Engineering Control and Machine Performance research group within Precision Engineering Centre at University of Huddersfield. It is a pleasure to express my profoundest gratitude for his tremendous enthusiasm in all phases, kind encouragement and willingness to devote time and energy to my work. This thesis owes much to his meticulous and enlightening supervision as well as encouragement.
I would like to thank Dr. J. M. Freeman for his advice with the software and helpful discussions, for his painstaking efforts in reading the entire manuscript and making constructive suggestions.
The support of my home university (Universitatea "Transilvania" din Brasov, Romania) which granted me leave and my fellow colleagues in the Department of Electrical Drives and Automation is gratefully acknowledged.
I am indebted to Mr. Geoff Hoiroyd for his help and constructive discussions during my research programme. Mr. Geoff Hoiroyd undertook a MSc project of two months duration carrying out measurement trials under my guidance and developing the initial model of the ball-screw. He later joined the research team to model ball-screws and we worked jointly to optimise the simulation of the model (see section 6.1.2) over another two months period.
I am grateful to my friends for their boundless hospitality, for their endless encouragement in all aspects towards my research work and future career.
Last and by no means least, my sublimest thanks and appreciation to my parents Irma and Emanuel for the love and support they have given me throughout my entire career. Their great moral support has been propelling me to overcome all possible barriers towards noble goals, with the help of almighty God.
CONTENTS
Abstract I
Acknowledgements II
Contents III
List of Figures vifi
List of Tables XII
1. INTRODUCTION
1. 1. Machine tool performance 1
1.2. CNC machine tool motion control systems 4
1.3. Aims and objectives 7
1. 4. Thesis outline 8
2. LITERATURE SURVEY
2.1. Modelling and simulation of CNC machine tool axis drives 11
2.2. Errors in CNC machine tools 14
2.3. Parameter identification methods for non-linear systems
2.3.1. General 19
2.3.2. Parameter identification methods suitable for use with machine tools 26 2.3.3. Previous work at the University of Huddersfield 29 2.3.4. Input signals for parameter identification 30
2.4. Conclusions 34
2.5. Project plan 35
3. MODELLING THE COMPONENTS OF CNC MACHINE TOOL AXIS DRIVES
3. 1. Introduction to CNC machine tool axis drives 37
3.2. Controller model 38
3.3. Pre-amplifier and amplifier models 41
3.4. Permanent magnet motor model 43
3.5. Models for mechanical transmission components
3.5.1. The drive-ball-screw coupling 47
3.5.2. Bearings 52
3.5.4. Guideways and slides 59
3.6. Transducers
3.6.1. Tachometer 61
3.6.2. Rotary incremental encoder (pulse generator) 62
3.6.3. Linear encoder 63
4. MATHEMATICAL MODELS FOR CNC MACHINE TOOL AXIS DRIVES 64
4.1. Mathematical block diagram model of the CNC machine tool axis drives 65 4. 2. Lumped parameter model for Beaver VC35 CNC machine tool axis drive with load
inertia reflected to the motor, without backlash, friction and geometric errors 68 4. 3. Modular approach to modelling of CNC machine tool axis drives 75
4.3.1. Lumped parameter model of CNC machine tool axis drive using modular
load with backlash and friction 76
4.3.2. Two-axis and 3D model of CNC machine tool axis drives using modular
load with backlash and friction 79
4.3.3. The hybrid model of CNC machine tool axis drive with distributed load,
explicit damping coefficients, backlash and friction 80
5. MEASUREMENT TECHNIQUES APPLIED TO BEAVER CNC MACHINE TOOL
AXIS DRIVES
5.1. Geometric errors measurements 88
5.1.1. Machine tool geometric errors 88
5.1.2. Geometric errors measurement techniques 91
5.2. Load induced (non-rigid) error measurements 93
5.3. Modal analysis 96
5.3.1. Theoretical approach to modal analysis 96
5.3.2. Modal analysis and frequency response measurements of a
Beaver VC35 milling machine 97
5.3.3. Measurement of belt drive system vibrations using piezo-electric
accelerometers 109
5.3.3.1. Vibration measurements for closed-loop position control 112 5.3.3.2. Vibration measurements for open-loop position control 115 5.4. Transfer functions derivations for three axes
5.4.2. Measurement technique
5.4.2.1. Closed-loop position control 117
5.4.2.2. Open ioop for position control 120
5.5. System response to step and trapezoidal inputs 125
5.6. System response to white noise
5.6.1. Theoretical approach 129
5.6.2. Measurement technique 130
5.7. Ball bar plot for two axes 137
6. SIMULATION OF PROPOSED MODELS FOR ONE AXIS SYSTEM AND
TWO AXES SYSTEM 141
6.1. Implementation of the modular systems in SIMULINK 142 6.1.1. Lumped parameter model with modular load, backlash and friction 142 6.1.2. Hybrid model with distributed load, explicit damping factors, backlash
and friction 145
6.2. Testing the models to deterministic (step and trapezoidal) inputs 164 6.2.1. Lumped parameter model with modular load, backlash and friction 164 6.2.2. Hybrid model with distributed load, explicit damping factors, backlash
and friction 167
6.3. Simulation of frequency response using swept sine and white noise inputs
6.3.1. Lumped parameter model with modular load, backlash and friction 170 6.3.2. Hybrid model with explicit damping coefficients for one axis drive 174
6.4. Two-axis simulation including geometric errors 177
6.4.1. Geometric errors integration into two-axis model 178 6.5. Ball bar plot simulation and comparison with measured results 183
7. PARAMETER IDENTIFICATION AND PERFORMANCE OPTIMISATION
TECHNIQUES APPLIED TO CNC MACHINE TOOL AXIS DRIVES
7.1. Introduction 187
7.2. Parameter identification methods suitable for use with machine tools 188 7.2.1. Control performance of CNC machine tools drives 188 7.3.2. Identification of bandwidths, gains and phases of different loops
of the system 190
7.3.1. Basic modelling and identification concepts from modal analysis 195 7.3.2. State of the art for modal analysis techniques 196 7.3.3. Classical methods for measurement of damping 201 7.3.4. Wavelets used for modal parameters identification 203 7.3.4.1. Brief theoretical basis of wavelet analysis 206 7.3.4.2. Identification of damping parameters using wavelets 209
216 216 218 218
8. CONCLUSIONS AND SUGGESTIONS FOR FURTHER WORK
8.1. Conclusions
8.2. Contribution to knowledge 8.3. Suggestions for further work
References 220
APPENDIX A
Al Data for CNC Machine Tool BEAVER VC35 sited at the
University of Huddersfield 230
A2 The MATLAB source code used to determine the optimised coefficients
for the P1 compensator which is equivalent with initial transfer function H preampl 230 A3 Data for permanent magnet motor Siemens 1HU3 074 - OACO1 231
A4 Data for mechanical transmission elements 232
AS Transducers fitted on Beaver VC35 CNC machine tool sited at the
University of Huddersfield 237
APPENDIX B
B 1 Analysis of zero order-hold element 238
B2 Data for lumped parameter model 238
B3 Data for distributed parameters models 240
B4 Belt drive stiffness preliminary estimation 241
B5 Coefficients for the model using explicit damping coefficients determined
considering the experimental data for the closed-loop position control 243
APPENDIX C
C2 Measurement results using accelerometers attached to the drive systems
for X-axis respectively Y-axis 252
C3 Measurement results using accelerometers to determine the source
of resonance frequency at 35 Hz 255
C4 Theoretical calculations of the stiffness considering the system: ballscrew
-bearings - nut 260
C5 Measurement results for closed-loop position control 262
C6 Brief description of the General Data Logging Software (GDLS)
developed at the University of Huddersfield 266
C7 Calculation of the coefficients of the high pass digital filter 267 C8 CNC machine tool part program for a trapezoidal rate contour 267
APPENDIX D
Dl Configuration of the subsystem "Ballscrew" for the linear encoder 269 D2 Simulation results using SIMULINK 1 and a simplified model with
explicit damping coefficients 269
D3 MATLAB programs for plotting Bode diagrams in the case of swept sine input 270 D4 Simulation procedure for plotting Bode diagrams using white noise 273 D5 Values for look-up tables extracted from laser measurement data 275
D6 CNC machine tool part program for circular contouring test of XY plane using
ball bar (length 150 mm) 273
D7 MATLAB programs used in the simulation of ball bar plots 274 D8 Simulation results using 3D model with distributed parameters 274
APPENDIX E
Generalised eigenvalue method used to determine undamped and damped
natural frequencies 277
APPENDIX F
MATLAB programs for identification of modal parameters from I / 0 data
FIGURES
CHAPTER 1 - INTRODUCTION .
No figures
CHAPTER 2- LITERATURE SURVEY
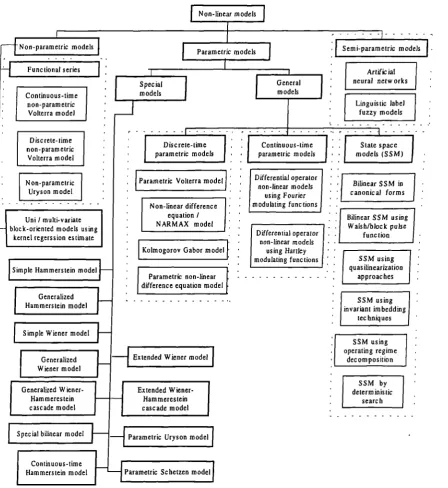
Figure 2. 1. - Major structure of non-linear system identification models ...25
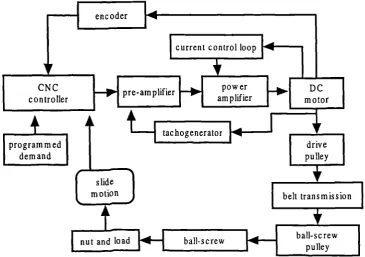
CHAPTER 3- MODELLING THE COMPONENTS OF CNC MACHINE TOOL AXIS DRIVES Figure3. 1. - Block diagram of CNC machine tool Beaver VC35 ... 38
Figure3. 2. - Block diagram of an analogue controller ... 39
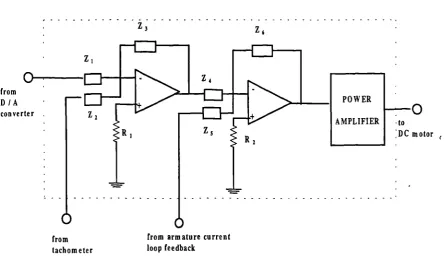
Figure 3. 3. - Possible diagram of the servo amplifier considering the connections with other components ofthe DC drive ... 41
Figure3. 4. - D. C. motor block diagram ... 44
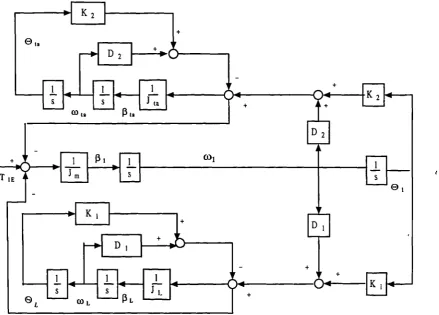
Figure3. 5. - Three-body model for load-motor-tachometer system ... 45
Figure 3. 6.- Mathematical model block diagram of DC motor showing the dynamical characteristics ... 47
Figure3. 7. - Mechanical transmission components ... 48
Figure3. 8. - Location of belt slackness when pulley rotates ... 49
Figure3. 9 - The belt drive ... 50
Figure 3. 10. - Axial and radial loading upon the ball-screw bearings ... 53
Figure3. 11. - Basic assembly of a ball-screw ... 56
Figure3. 12. - The complete ball-screw model ... 57
Figure3. 13. - Guideway arrangement for Beaver VC35 ... 59
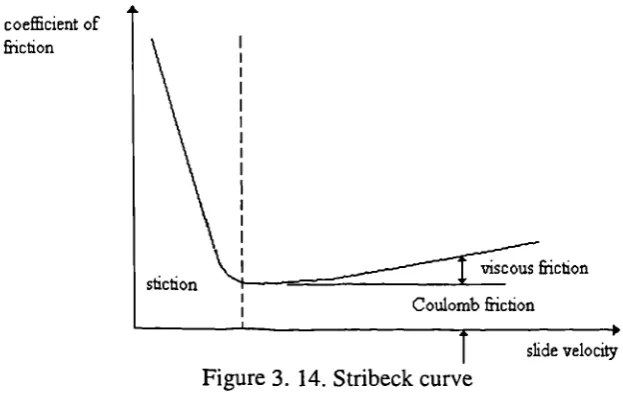
Figure3. 14. - Stribeck curve ... 60
Figure. 3. 15. - Extreme X-axis positions ... 60
Figure3. 16. - Y-axis yaw during reversal ... 61
Figure3. 17. - Additional slideway friction ... 61
Figure 3. 18. Pulse trains corresponding to bi-directional rotation of an encoder ... 62
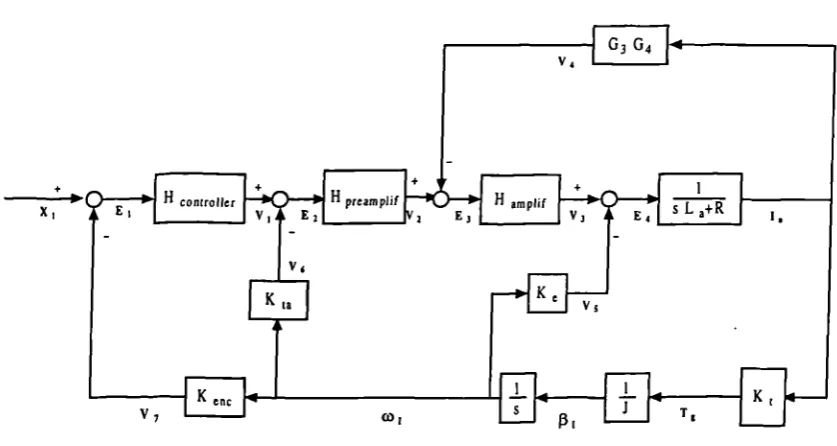
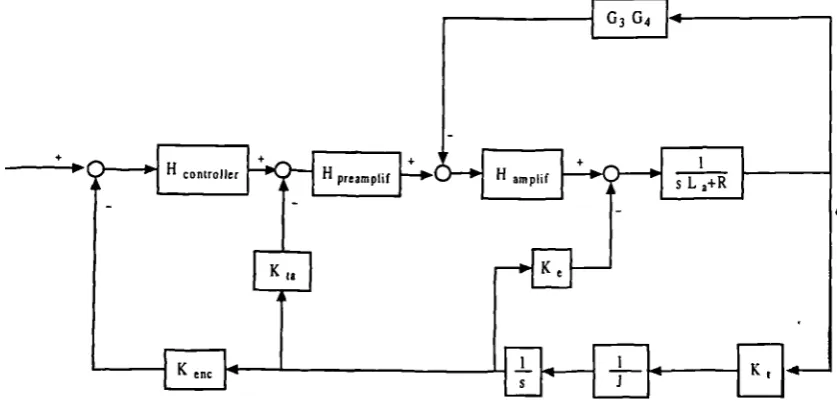
CHAPTER 4- MATHEMATICAL MODELS FOR CNC MACHINE TOOL AXIS DRIVES Figure 4. 1. - General mathematical model block diagram of the CNC machine tool axis drive ... 65
Figure 4. 2. -Lumped parameter model of CNC machine tool axis drive ... 68
Figure4. 3. - The armature voltage - motor rate control loop ... 69
Figure4. 4. - The equivalent armature voltage - motor rate control loop ... 70
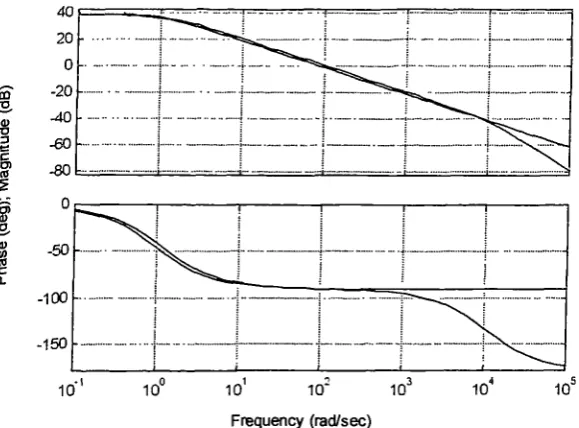
Figure 4. 5. - Bode diagrams for the calculated armature voltage - motor rate control loop and the equivalentfirst order element ... 71
Figure4. 6. - Velocity loop ... 72
Figure4. 7 . - Bode diagrams for the calculated velocity control loop ... Figure4. 8. - The position loop ... 73
Figure 4. 9. - Bode diagrams for the calculated transfer function of position control loop (blue) andthe equivalent transfer function (red) ... 74
Figure4. 10. - Forces for one model element ... 76
Figure4. 11. - The elements of the Z-axis drive ... 79
Figure 4. 12. - The five major modules of the structure of the Beaver VC35 ... 81
Figure4. 13. - The spring/damper element ... 82
Figure4. 14. - Forces acting between two moving surfaces ... 83
Figure 4. 15. - Schematic representation of the mechanical elements of the model ... 86
CHAPTER 5 - MEASUREMENT TECHNIQUES APPLIED TO BEAVER CNC MACHINE TOOL AXIS DRIVES Figure 5. 1.- Geometric sources of error for a single axis of a machine tool ...89
Figure 5. 2. - Schematic diagram of the machine configuration ...92
Figure 5. 3. - Amplitude and frequency content of vibration measured on spindle nose during cutting trials (X-axisdirection and Y-axis direction) ...98
Figure 5. 4. Amplitude and frequency content of vibration measured on spindle nose during cutting trials (Z-axis direction) ...99
Figure 5. 5. Amplitude and frequency content of vibration measured on table during cutting trials (X-axis direction and Y-axis direction) ...99
Figure 5. 8. - Frequency response in X, Y and Z axes with spindle head in lowest position ... 101
Figure 5. 9. - Frequency response in X, Y and Z axes with spindle head in mid-height positio ... 102
Figure 5. 10. 3-D representation of the structure used for modal analysis ... 103
Figure5. 11. - Mode shape of structure at 51 Hz ... 104
Figure 5. 12. - Mode shape of structure at 64 Hz... 104
FigureS. 13. - Mode shape of structure at 112 Hz... 105
Figure5. 14 - Mode shape of structure at 133 Hz ... 105
Figure 5. 15. - Mode shape of structure at 180 Hz ... 105
Figure 5. 16. Frequency response measurements of X-axis drive motor ... 106
Figure 5. 17. - Frequency response measurements of Y-axis drive motor... 107
Figure 5. 18. - Frequency response measurements of Z-axis drive motor ... 107
Figure 5. 19. - Frequency response measurements of X-axis ball-screw ... 108
Figure 5. 20. - Frequency response measurements of Y-axis ball-screw ... 108
FigureS. 21. - Electrical diagram of the connection between accelerometer and charge amplifier ... 110
Figure5. 22. - Experimental set up for the comparison method ... 111
Figure 5. 23. - Experimental arrangement of the four accelerometers for X-axis drive... 113
Figure 5. 24.- Schematic representation of the experimental arrangement of the four accelerometers ... 114
Figure 5. 25. - Experimental arrangement of two accelerometers ... 114
Figure 5. 26. - Experimental setup for measurements on closed-loop position control ... 118
Figure 5. 27. - Supplementary electronic circuit permitting the introduction of the signal generated bysignal analyzer ... 118
Figure 5. 28. - Controller error when a sinusoidal signal of 250 mY and 50 Hz is introduced as a disturbanceinto the pre-amplifier ... 120
Figure 5 29. - Experimental setup for measurements in open-loop position control and closed-loop velocity control ... 121
Figure 5. 30. - Implementation of functional diagram for data acquisition in the case of open-loop position control ... 121
Figure 5. 31. - Experimental results for measurements in open-loop position control using differentiation anda swept sine input ... 122
Figure 5. 32. - Experimental results for measurements in open-loop position control without differentiation 124. Figure5. 33.- (a) Step function for the control of a machine tool slide ... 125
(b) Time lag of the slide reaching the desired position Figure 5. 34. - Measured step input and step response for open-loop position control ... 126
Figure5. 35. - Trapezoidal velocity profile ... 126
Figure 5. 36. - Measured controller error for trapezoidal velocity demand with acceleration time 140 ms.. 127
Figure 5. 37. - Measured controller error for trapezoidal velocity demand with acceleration time 10 ms 128 Figure 5. 38. - Response to a ramp input ... 128
Figure 5. 39. - Experimental set up for measurements in open-loop position control and closed-loop velocity control considering white noise as input ... 131
Figure 5. 40. - Experimental results for measurements in open-loop position control considering differentiation and white noise input generated by GDLS ... 132
Figure 5. 41. -Experimental results for measurements in open-loop position control for white noise inputgenerated by GDLS and without differentiation ... 133
Figure 5. 42. - Experimental results for measurements considering differentiation, white noise input generatedby GDLS and 2 ms sampling time ... 134
Figure 5. 43. - Experimental results for measurements in open-loop position control considering differentiation and white noise input from HP3566A ... 135
Figure 5. 44. - Experimental results for measurements in open-loop position control for white noise inputfrom HP3566A and without differentiation ... 136
Figure 5. 45. - Experimental results for measurements in open-loop position control with swept sine and white noise input from HP3566A or GDLS considering differentiation ... 137
Figure 5. 46. - Experimental ball bar plot for CNC machine tool Beaver VC35 ... 140
6. SIMULATION OF PROPOSED MODELS FOR ONE AXIS SYSTEM AND TWO AXES SYSTEM Figure 6. 1. - The relationship between simulation and the real world ... 141
Figure6. 2. - SIMULINK implementation of Coulomb friction model ... 143
Figure 6. 3. - Implementation in SIMULINK 2. 0. of the model with distributed parameters for Y-axis drive (rotary encoder attached to DC motor) ... 143
Figure 6. 4. - Block diagram of FANUC 6M controller in SIMULINK 2. 0 ... 143
Figure 6. 6. - Block diagram of subsystem calculating the torque due to slide reaction ... 145
Figure 6. 7. - Implementation of the model with explicit damping coefficients in SIMULINK 2 (rotary encoder attached to DC motor) ... 147
Figure6. 8. - Elements of the subsystem "Explicit " ... 147
Figure6. 9. - Elements of the subsystem "Baliscrew " ... 149
Figure6. 10. - Elements of the block "Motor (mechanical)" ... 151
Figure6. 11. - Elements of the block " Friction " ... 152
Figure6. 12. - Elements of the block" Force feedback " ... 153
Figure6. 13. - Elements of the block" Variable limiter" ... 153
Figure6. 14. - Elements of the block "Tolerance adjuster" ... 154
Figure6. 15. - Elements of the block " Belt" ... 155
Figure6. 16. - Elements of the block" Beltfriction" ... 156
Figure6. 17. - Elements of the block "Baliscrew middle" ... 157
Figure6. 18. - Elements of the block "Ballscrew end" ... 159
Figure6. 19. - Elements of the block "Ballscrew nut" ... 160
Figure6. 20. - Elements of the block "Nut forces" ... 161
Figure 6. 21. - The causes of worktable and saddle tilting around X-axis when the movement is inthe Y-axis direction ... 162
Figure 6. 22.- Elements of the block " Explicit" when the rocking of the worktable and saddle is considered 162 Figure 6. 23.- Elements of the block " Table" when the rotation of the worktable and saddle is considered 164 Figure 6. 24. - SIMULINK 2. 0. model with distributed parameters corresponding to the experimental setupfor measurements in open-loop position control ... 165
Figure 6. 25. - Simulated and measured worktable velocity for a step input considering themodel with distributed parameters ... 165
Figure 6. 26. - SIMULINK 2. 0. model with distributed parameters corresponding to the experimental setupfor measurements in closed -loop position control ... 166
Figure 6. 27. - Simulated and measured worktable velocity for trapezoidal input considering themodel with distributed parameters ... 166
Figure 6. 28. - SIMULINK 2. 0. model with explicit damping coefficients corresponding to the experimental setup for measurements in open -loop position control ... 167
Figure 6. 29. - Simulated values for worktable velocity using the solver ode 45 ... 168
Figure 6. 30. - Simulated step input and step response for open-loop position control considering themodel with explicit damping coefficients ... 169
Figure 6. 31. - (a) Sinusoidal rate demand (green) and response of Y-axis model (blue) ... 171
(b) Difference between rate demand and model response Figure 6. 32. - SIMULINK 2. 0. model with distributed parameters corresponding to the experimental setup for measurements in open -loop position control using a swept sine input ... 172
Figure 6. 33. - Simulated results for the open-loop position control using LTI viewer ... 172
Figure 6. 34. - SIMULINK 2. 0. model with distributed parameters corresponding to the experimental setup for measurements in open -ioop position control for random white noise input ... 173
Figure 6. 35. - Simulated results for the open-loop position control using the model with distributedparameters for white noise input ... 174
Figure 6. 36. - SIMULINK 2. 0. model with explicit damping coefficients corresponding to the experimental setup for measurements in open -loop position control for swept sine input ... 174
Figure 6. 37. - Simulated results for the open-loop position control using the model withexplicit damping coefficients for swept sine input ... 175
Figure 6. 38. - Simulated results for the open-loop position control using a white noise input and optimalvalues for damping coefficients ... 176
Figure 6. 39. - Two-axis model for CNC machine tool axis drives considering velocity demands ... 177
Figure 6. 40. - Two-axis model for CNC machine tool axis drives considering position demands ... 178
Figure6. 41. - X-axis positional error calculation ... 179
Figure6. 42. - Y-axis positional error calculation ... 180
Figure 6. 43. - Worktable position relative to spindle for X-axis measurements ... 180
Figure 6. 44. - Worktable position relative to spindle for Y-axis measurements ... 181
Figure 6. 45. - Worktable position relative to spindle for ball bar test ... 181
Figure 6. 46. - The co-ordinates of points for the circle prescribed during ball bar test ... 182
Figure 6. 47. - The logic diagrams connecting the laser system measurements with co-ordinates of points from the circle prescribed during ball bar test ... 182
Figure 6. 48. - SIMULINK logic diagram connecting laser and ball bar measurements ... 183
Figure 6. 50. - Determination of the errors between the trace obtained from two models and the circle
withthe radius 83. 33mm ... 184
Figure 6. 51. - Simulation plot showing purely axis drives positional errors ... 184
Figure 6. 52. - Ball bar plot simulation considering position demand ... 185
Figure6. 53. - Simulation plot ... 186
Figure6. 54. - Measured ball bar plot ... 186
7. PARAMETER IDENTIFICATION AND PERFORMANCE OPTIMISATION TECHNIQUES APPLIED TO CNC MACHINE TOOL AXIS AND SPINDLE DRIVES Figure 7. 1. - Simulated (blue) and experimental (magenta) Bode diagrams considering the lumped parametermodel and swept sine as input ... 191
Figure 7. 2. - Simulated (blue) and experimental (magenta) Bode diagrams considering the hybrid model andswept sine as input ... 192
Figure7. 3. - The stages in elaborating a modal model ... 194
Figure 7. 4. - The relationships between modal testing and modal analysis ... 200
Figure7. 5. - The Morlet wavelet ... 208
Figure 7. 6. - The CWT for the impulse response of the actual control system ... 212
Figure 7. 7. - Cross-section through 3D graph corresponding to the maximum value of the CWT ... 213
Figure7. 8. - FF1' of the cross-section presented in Figure 7. 7... 214
REFERENCES No figures APPENDIX A No figures APPENDIX B FigureB1.1. Output of ZOH with sampling time T=10 ms ... 238
FigureB4.1. Diagram of timing belt drive ... 241
APPENDIX C FigureCl.1. X-axis linear positioning error ... 246
FigureCl .2. Y-axis linear positioning error ... 246
FigureC 1.3. Z-axis linear positioning error ... 246
FigureC 1.4. X-axis angular error about the X axis ... 247
FigureC 1.5. X-axis angular error about the Y axis ... 247
FigureC 1.6. X-axis angular error about the Z axis ... 247
FigureC1.7. Y-axis angular error about the Y-axis ... 248
FigureC1.8. Y-axis angular error about the X axis ... 248
FigureC 1.9. X-axis straightness in theY axis direction ... 248
FigureC 1.10. X-axis straightness in the Z-axis direction ... 249
FigureC 1.11. Y-axis straightness in the X axis direction ... 249
FigureC 1.12. Y-axis straightness in the Z axis direction ... 249
FigureC 1.13. Z-axis straightness in the Y axis direction ... 250
FigureC 1.14. Z-axis straightness in the X axis direction ... 250
FigureC 1.15. Y axis angular error about the Z axis ... 250
FigureC 1.16. Z-axis angular error about the X axis ... 251
FigureC 1. 17. Z-axis angular error about theY axis ... 251
APPENDIX D Figure D1.1. Configuration of"Ballscrew" subsystem for the linear encoder ...269
FigureD1.2. SIMTJLINK 1 implementation of the simplified model ... 270
LIST OF TABLES
1. INTRODUCTION
Table 1.1. Factors to consider in the design of high performance machine tools ...4
2. LITERATURE SURVEY No tables 3. MODELLING THE COMPONENTS OF THE CNC MACHINE TOOL AXIS DRIVE Table 3.1. Main characteristics of one of the drives studied by Ford [12] and BeaverVC35 X-axis drive ...42
Table 3.2. Friction coefficient p. for various rolling bearings types ...53
4. MATHEMATICAL MODELS FOR CNC MACHINE TOOL AXIS DRIVES No tables 5. MEASUREMENT TECHNIQUES APPLIED TO BEAVER CNC MACHINE TOOL AXIS DRIVES Table 5.1. Sources of geometric errors in a three-axis CNC machine tool ...90
Table 5.2. Machining volume for the Beaver VC35 CNC machine tool ...92
Table 5.3. Summary of measurements from the machine [31 ...94
Table 5.4. Technical characteristics of accelerometers used in measurements ...109
6. SIMULATION OF PROPOSED MODELS FOR ONE AXIS SYSTEM AND TWO AXES SYSTEM Table6.1. Variables for the subsystem "Explicit" ...148
Table 6.2. Variables for the subsystem "Ballscrew" ...150
Table 6.3. Variables from the blocks "Ballscrew", "Table" and "Bed stiffness" when the rocking of the worktable and saddle is considered ...163
7. PARAMETER IDENTIFICATION AND PERFORMANCE OPTIMISATION TECHNIQUES APPLIED TO CNC MACHINE TOOL AXIS DRIVES
axis drive . 189
Table 7.2. Parameters intended to be identified and stimuli used for this purpose ... 189
Table 7.3. Classical damping measurement methods ...202
Table 7.4. Identified values for resonant frequencies and damping ratios usingBode diagrams and wavelet analysis ...214
8. CONCLUSIONS AND SUGGESTIONS FOR FURTHER WORK No tables APPENDIX A Table Al. Characteristics of Beaver VC35 CNC machine tool ...230
Table A2. Technical data for DC permanent magnet motor [14] ...232
TableA3. Components of the belt drive ...232
TableA4. Technical data for bearings [134], [135] ... 235
APPENDIX B Table B 1. Calculated geometrical data regarding the toothed belt drives ...242
Table B2. Calculated mechanical data regarding the toothed belt drives ...243
APPENDIX C No tables
APPENDIX D
Table Dl. Values for lookup tables extracted from the laser measurement data (X axis) 275 Table D2. Values for lookup tables extracted from the laser measurement data (X axis) 276
APPENDIX E
1. INTRODUCTION
1. 1. Machine tool performance
The ability to produce accurate components has many advantages; some of the most important ones are listed below:
• Tolerances can be reduced allowing the production of more accurate assemblies. Greater component accuracy often results in performance improvements.
• A reduction in hand fitting or selective assembly, resulting in shorter build times and greater interchangeability.
• A reduction in the costs incurred by re-manufacturing or scrapping out of tolerance components.
• An increased possibility of a part being roughed and finished on the same machine, resulting in reduced set-up time.
The three main areas of concern affecting component accuracy are environmental effects, user effects and machine accuracy. Temperature, humidity, pressure and external vibration are the variables contributing to environmental effects. Temperature change, the frequency of change, temperature gradients and radiation effects greatly influence the magnitude of the error. The user effects are those resulting from the work-piece, the tooling and the machining process. Work-piece considerations include its weight, stiffness, stress levels and distortion, datum surface quality, temperature coefficient and the way it is clamped. Tooling considerations include tool geometry, swarf build-up on the cutting edge, tool stiffness and wear, while machining considerations include the effects of speed and feed, chatter and coolant.
The environment in which a CNC machine tool operates and the user effects form part of the manufacturing process and they are the responsibility of the end user. The machine accuracy is the responsibility of the machine tool builder, and it is a particularly complex matter that depends on a large number of factors. The volume builder of machine tools cannot possibly provide specific operating criteria for the range of products likely to be manufactured using his machines, so a detailed understanding of the sources of error and how to counter them is imperative.
correction. Careful measurement of the repeatable time and spatial errors can allow compensation methods to be applied for the correction of those errors provided sufficient resolution and good repeatability has been allowed for in the design. The ultimate accuracy limit for a particular machine is set by its measured repeatability figures. There is a need to review all design practices concerning the structural elements in order to meet high performance specifications.
Research is currently underway to investigate current methodology applied to the design, assembly, error measurement, and error correction practices of CNC machine tools [1]. Also to investigate "state of the art" practices and provide a generic guide to the machine tool builders and end users on techniques to improve high performance by applying volumetric accuracy correction. In order to achieve this there is the need to investigate the static and dynamic performance, and quantify the constituent errors for each structural element of the CNC machine tool.
Machine tool accuracy depends on its resolution, repeatability, quasi-static errors, dynamic errors and external vibration [2]. Quasi—static errors influence displacement/planar/volumetric accuracy and are caused by static deflections (static stiffness), thermal stability (thermal stiffness), spindle accuracy, and software limitations. Dynamic errors are influenced by control system velocity/acceleration lags, dynamic deflections, dynamic stiffness/damping, contour interpolation, and operating errors. External vibrations can be ground borne or acoustic vibrations.
There is a need with all CNC machine tools seeking high performance to quantify and understand systematic and random error content. Pre-calibrated correction practices are dependent on the machine tool error components being systematic. A correction practice is dependent on precise methodologies for the measurement and identification of the geometric, load and thermal errors.
The motion control system of the CNC machine tool is one of the major structural elements which, can be subdivided into its constituent elements such as controller, electrical drives, transmission, transducers and guide-ways. It is the key to the introduction of correction practices and is the major influence on the machine tool dynamic performance and clearly needs to be more fully understood, hence the need for this research activity.
The movement of the machine tool axes result in changes in position of machine masses, which can further affect the error components of individual axes (such as yaw, pitch, roll and straightness). The level of each axis coupling is dependent on the machine tool configuration and the rigidity of the machine tool structure. If the structure of a machine tool is loaded then it will distort. If the loading is changed then the distortion of the structure will change and machining errors will result. Sources of loading are the moving weight of the slides, work-piece weight and cutting forces. At the University of Huddersfield (UoH), measurements have been taken over a wide range of machines and significant effects on accuracy were seen on circa half of the sample of machines under review [3]. For example it was shown that a moving slide and work-piece weight generally caused a change in angular error components.
Machine tools are inevitably subject to temperature changes. Thermal errors are produced by distortion occurring due to changes in the temperature of the machine tool structure. The two main causes of structural temperature change are internal heat generation (friction in spindle bearings and slide-ways, fluid losses in hydraulic systems etc.) and environmental temperature variation. The operating conditions of most machine tools means that the heat generated internally will vary significantly as the machine is used. This combined with the complexity of the structure and environmental temperature variations will give rise to complex, transient temperature distributions, making the resultant thermal errors difficult to quantify or predict.
Machine tool manufacturers and users will be well versed in the determination of geometric accuracy under no load, accuracy and repeatability of positioning axes, thermal distortion, and circular dynamic tests for their machines according to the major national and international performance standards [4-8]. These standards are used in the type testing of specific machines, acceptance testing of newly installed machines, comparison testing of a range of machines, periodic verification (i.e. annual re-calibration), and axis positioning compensation through the machine tool controller to ensure continuing accuracy.
STRUCTURES FACTORS TO CONSIDER FOR HIGH PERFORMANCE
Foundations: High mass, stiff support, time dependent stability, good damping
Beds: High stiffness, good thermal & time dependent stability, high damping, heat transfer capability, high humidity stability, levelling and alignment "of little significance" to "most important" dependent on machine type.
Columns: High stiffness, high heat transfer, thermal stability, time dependent stability, alignment capability, low mass, low centre of gravity.
Heads: High stiffness, high heat transfer, thermal stability, fatigue strength, time dependent stability, low mass, high damping, humidity stability, alignment capability "of little significance" to "most important" dependent on machine type. Tables: High stiffness, time dependent stability, alignment capability, static strength,
fatigue strength, low mass, high damping.
Saddles: High stiffness, thermal stability, humidity stability, time dependent stability, alignment capability, low mass, static strength, high damping.
Pallets: High stiffness, time dependent stability. Tooling: Stiffness, balancing, damping.
Motion control Resolution, stiffness, and noise rejection are general requirements.
Controller: Sampling time, servo update, quantisation, avoid saturation limits, interpolation Drives/transmission Dead-band, backlash, friction , inertia matching, heat generationlcooling, velocity/
acceleration capability, mechanical stiffness.
Rotary/linear transducers Intrinsic: laser wavelength, electronics, optical non-linearity, misalignment,
spatial, mechanical set-up and interpolation.
Environmental: atmospheric, material thermal expansion, optical thermal drift.
Installation: dead-path, Abbe', misalignment, cosine, and acceleration/velocity
capability.
Kinematics design High load carrying capabilities without undue distortion surface fatigue and wear. Guide-ways Stiffness (static/dynamic), wear resistance, friction (coulomb/viscous), damping,
heat (input/extraction), protection (covers/seals).
Rotary axes Relative motion between work-piece and cutting: structural loop and thermal drift.
Table 1.1. Factors to consider in the design of high performance machine tools
1.2 CNC machine tool motion control systems
The increasing requirements of industrial applications for higher performance, better reliability and lower cost have imposed the necessity to produce realistic models of the motion control systems.
cases, humans cannot perform sufficiently well. Modern sensors and controls coupled with diverse and precise linear and rotary motion actuators, combine to fill the needs. They are elements of a dynamic system, which require continual development to be made in order to satisfy rapid changes in requirements.
A CNC machine tool is an example of such a dynamic system. The forces experienced by the motion control systems have different values depending on the duty cycles: acceleration, steady state, deceleration, cutting etc.
CNC machine tool control systems have errors due to geometric, non-rigid, thermal and dynamic effects. Previously work has largely concentrated on simulation methods based on
"lumped parameters" methods and the assumption that it behaves as a linear system. The real
system has non-linear control elements and the need is to move from the 'lumped
parameters" methods to a consideration of distributive elements if the structural dynamic
effects are to be more deeply understood.
The behaviour of a lumped dynamic system is governed by a set of differential equations. Similarly, a set of partial differential equations can represent the dynamic behaviour of a distributed system. Physically all systems are distributed in nature. For practical modelling purposes they can be approximated by ordinary differential equations or by a combination of distributed and lumped elements as shown by Bartlett and Whalley [11]. For hybrid modelled systems represented by distributed —lumped parameter modelling, it is normal practice to treat the energy conversion and dissipating elements by a lumped approach, while energy -transporting elements are treated as distributed. Therefore in hybrid mechanical systems, such elements as long shafts (ball-screws) need to be analysed as distributed realisations, whereas the lumped parameter models are normally adequate for gears, bearings etc.
contrasted to the reductionist perspective which focuses, in detail, on the individually deconstructed parts.
An intuitive grasp of how such a system will behave, in total, is further obscured in the presence of delays, inertia and non-linearity. Hence in practice, simulation has often come to provide the most realistic means of understanding, controlling and improving such systems.
Simulation is arguably more than just science because judgement is required, particularly when the scope of the system and the requisite level of modelling detail are defined, matching the need to produce a representative, efficient and economic model of the real system. A range of human attributes is necessary to translate the physical world into a mathematical one, decide which experiments to perform, analyse results and map them back from graphical and tabulated simulation outputs into natural language.
The CNC machine tool has to be considered as a non-linear system because of friction, backlash and other non-linearities existent in it. The non-linear interactions are difficult to identify due to the immense number of possible combinations. The solution in this case is to structure the approach around a specific class of functions (such as a polynomial for example) that can be used to approximate arbitrarily the behaviour of a dynamical system.
Parameter estimation of linear continuous-time systems using stimuli techniques is well understood. Unfortunately these methods cannot be applied for the identification of non-linear continuous-time systems. The use of standard linear techniques has been mostly restricted to very special classes of non-linear systems only. Application to non-linear systems has been hindered by lack of computing power and suitable algorithms that can be implemented in real time. But the recent development of computers and real-time techniques provides the basis for an improved parameter estimation of non-linear systems.
The ideal situation for the improvement of CNC machine tools performance is to develop an intelligence-based system, which allows parameter identification adjustment on-line by utilising a fast and robust identifier for non-linear systems. To accomplish partially this requirement, the research carried out in this investigation is to develop an intelligence-based system for optimisation off-line by utilising a fast and efficient robust identifier for non-linear systems. The intelligence of the system will come from the ability to predict model parameters and check the system stability. The parameter identification of CNC machine tools or other non-linear continuous-time systems will later be possible to perform on-line on the basis of the intelligence-based system created for off-line application.
the systems have been reduced using different methods to first or second order elements. This is not reflecting very accurately the behaviour of the real systems because a lot of them are non-linear systems with order number bigger than two (sometimes the order can go up to twenty). This thesis is focused on the development of a methodology for modelling and physical-based parameter identification for non-linear continuous-time systems of this kind.
Many researchers have studied the estimation of the modal parameters of a vibrating system using the wavelet transform of the systems free response. However reports, which include detailed technical know-how in determining the natural frequencies and damping factors of the machine tool by using wavelet transform are difficult to find in literature. This report represents an important contribution to the study of the wavelet transform used as parameter identification technique for machine tools.
The thesis extends the application of the wavelet transform by novel investigations aimed at producing a generic approach suitable for a large number of CNC machine tools and other Cartesian motion applications where non-linear control systems are in use.
The presented method increases the global performance of a modelled and simulated dynamic system. Because the shortcomings of traditional methods are overcome, this method is an important contribution to the motion control of CNC machine tool axis drives.
This new approach is useful for deriving a universal modular mathematical model of CNC machine tool axis drives from the diagnostic, condition monitoring and performance point of view. The errors in machine tools such as geometric, thermally induced and non-rigid errors are considered.
The method is applicable to robotics and other type of Cartesian motion control systems (where the equations of motion for every link are written, the algebraic equations representing the kinematics constraints are established, and the solution comes from solving the set of simultaneous algebraic and differential equations). A similar method could be applied to non-Cartesian machines in the future to extend the field of application.
1. 3. Aims and objectives
The present study is focused on the parameter identification and the mathematical modelling of a non-linear control system. The motion control of the Beaver 3-axis machining centre based at the University is the system under investigation.
• Develop a universal 3D mathematical model for a Cartesian CNC machine tool using
three different methods: classical lumped parameter method, modular "lumped parameter
approach" and hybrid modelling.
. Simulate the functioning of the models by implementing them into SIMULINK within the
MATLAB environment.
• Carry out modal analysis measurements to determine significant structural resonance's. • Identify the control loop coefficients and non-linear parameters of the universal model. • Peiform physically-based parameter identification for CNC machine tool axis drives. • Develop a robust identifier for modal parameter estimation of non-linear continuous-time
systems using wavelet transform.
• Validate the robust identjfier with respect to the parameter estimation of control model.
The strength of the thesis lies in the building of an accurate model of the CNC machine tool by good analytical and proven measurement techniques. Then by simulation and practical application demonstrate that the identification technique developed can verify the model by the use of perturbation stimuli and optimisation routines. A feature of this project work is the development of an algorithm and a novel application of wavelet transform for the parameter identification of the CNC machine tools.
The successful outcome will help the machine tool industry to achieve or retain global competitiveness by cutting costs, increasing product and process quality and providing flexibility at the same time. As well as achieving time and spatial accuracy for the motion system the developed model and parameter identification technique is the first step towards producing a universal condition monitoring system
The scope of this research is to investigate an intelligence-based system for optimisation off-line by utilising a fast and efficient robust identifier for non-linear systems. Parameter identification of CNC machine tools or other non-linear continuous-time systems will later be possible to perform on-line on the basis of the intelligence-based system created for off-line application. Thermal effects although studied under this research program were also considered to be outside the scope of the project because of the long time constants involved.
1. 4. Thesis outline
Chapter 2 concentrates on a critical appraisal of the extensive literature and contains a brief
historical perspective of modelling and simulation of CNC machine tool axis drives, errors in CNC machine tools and parameter identification methods for non-linear systems. The emphasis for the last aspect is on parameter identification and performance optimisation techniques applied to machine tool drives.
Chapter 3 describes briefly the motion control system of the CNC machine tool under
review. A clear, simple yet relatively complete view about the elements of CNC machine tool axis drives and their characteristics is outlined.
Chapter 4 is the first of the four chapters that present original contributions. The lumped
parameter model with load inertia reflected to the motor without backlash, friction and geometric errors is detailed using control system analysis techniques.
Then the lumped parameter model with modular load for one axis drive of a CNC machine tool is developed. The model includes non-linear effects such as backlash, friction and saturation. Two further models for the additional two axes are built by the same method. The three axis models were combined to demonstrate volumetric dynamic response.
The rigid body errors are included into the 2D model for the CNC machine tool axis drives. The combination of lumped and distributed parameters converts the system to a hybrid model. The final model develops one axis only and introduces a combination of lumped and distributed modelling for investigating the damping factors and stiffness of the different elements. These parameters are to be determined and validated using modal analysis techniques.
Chapter 5 describes the measurement techniques applied to a Beaver CNC machine tool for
determining geometric and non-rigid errors using laser interferometer, precision electronic levels and ball-bar. Also it relates the measurement methods to determine:
• Transfer functions for the three- axis drives using HP3566A PC Spectrum / Network analyzer;
• System response to step, trapezoidal, swept sine inputs or white noise; • Modal parameters for the structure and the drive.
The design of the experimental set-up and the formulation of tests to be performed are specified and the measurement data is analysed.
Chapter 6 presents the implementation of the modular systems for Beaver VC35 CNC
to match the machine parameters. The frequency responses to swept sine and white noise signals are also simulated.
The two-axis model built on the modular approach is used to simulate the ball-bar plot and the results are compared with those obtained from ball-bar tests. The comparison between the simulation results and the measured results is used to validate the models. The hybrid model with distributed load, explicit damping factors, backlash and friction proved to be the most accurate in reflecting the dynamic behaviour of the system.
Chapter 7 analyses the identification methods with regard to: control performance of CNC
machine tools drives; bandwidths, gains and phases of different loops of the motion control system; resonance states of transmission (stiffness, damping factors).
The current state of the art of modal analysis is reviewed and some of the current limitations facing the application of modal parameter identification in practical situations are analysed. Finally, the identification of the resonance states of transmission (stiffness, damping factors) using one of the advanced signal processing techniques - continuous linear wavelet transform - is treated in this thesis. A comprehensive study of evolutive time-frequency analysis using an advanced signal processing technique such as wavelet transform is given.
The critical appraisal of the different parameter identification methods highlights the novelty and advantages of the proposed method against the methods used previously.
2. LITERATURE SURVEY
2. 1. Modelling and simulation of CNC machine tool axis drives
Modelling and simulation are important aspects of engineering design for continuous dynamic systems. The design method usually applies several stages such as formulating the specification, building a mathematical model, preparing a good initial design, and simulating the systems to gather data then finalising the design.
Simulation is particularly important for complex systems where exact analytical approaches, especially with the existence of non-linearities, may not be possible.
In the design of a high performance motion system, the choice of the most adequate system structure is a key issue since normally each application presents specific requirements. Besides basic motor technology selection, a multitude of other factors, such as the interdependence of the functionality of the different elements, affects global performance.
This aspect has been illustrated very well by Ford [12], who developed a series of programs (in Enhanced Basic) and algorithms for the optimal design of the axis drives for use with the majority of machine tool configurations, types and sizes. The aim was to commence from the knowledge of the component shape prior to / after machining and the type of material, etc. and proceed through to the machine layout configuration.
The author noticed that" mathematical models have apparently not been used extensively in machine tool design" until that period (1987). Also, he demonstrated the effectiveness of
using the lumped parameter models for analysis of the CNC (Computer Numerical Controlled) machine tool axis drives and for improvement of machine performance.
The axis drive simulation software developed by Ford was implemented in a high-level language (Turbo Pascal) by Green [13]. The central theme of this project was to produce two simulation programs that would operate on a PC of average specification:
• The first program generated the output of the mathematical model for a single axis drive system when a trapezoidal rate demand signal was introduced as an input signal.
Green used improved graphical routines allowing the user to enter values for the mathematical models and quickly assess the dynamic performance of the drives. The understanding of the system has therefore been increased because the user was able to simulate the effect of changing the values for system factors. However, the geometric, load and thermal errors from CNC machine tools were not introduced into the models and their effect was not examined in subsequent simulations.
Siemens AG sponsored special research studies centered on position control and feed drives at the University of Stuttgart. The scientific work for position control optimisation using frequency response methods has been summarized by Gross [14]. The author presents the theoretical treatment of the position control ioop design and deals with different mechanical transmission elements and various proposed feed drive measurement methods for application with CNC machine tools. In this way the theoretical technical approach is successfully combined with the practical experience.
Leonhard [15] demonstrates that the most effective control scheme for drives is a cascade with a fast inner current ioop, a superimposed speed control ioop and an outer superimposed position loop. This control scheme has significant advantages: the stability problem can be broken down into several smaller sub-problems, design is done step-by-step beginning with the innermost loop, load disturbances (representing the mechanical parts of the machine) are suppressed by the integral part of the speed controller as fast as possible etc.
All the above-mentioned references analyse only the lumped-parameter models for CNC machine tool axis drives where the load inertia is referred to the motor. One of the significant shortcomings of this approach is the lost opportunity for examining the behaviour of individual mechanical transmission components and how they interact.
Classical CNC machine tool design utilises high efficiency switching power transistors, and high speed digital control technology to provide high performance servo systems. However, in the modern digital control environment, the analogue control interface does have some major drawbacks:
• The analogue signal is susceptible to electrical interference.
• The analogue interface at the CNC and drive ends is susceptible to drift.
All these factors limit the performance potential of the CNC servo system. Today, the capabilities of the modern 32-bit microprocessor based CNC have combined the improvements in mechanical and process technology to yield outstanding improvements in available productivity. The technology of the computer numerical control is advancing at an exceptional rate, such that it is the CNC that is pushing forward the capabilities of modern machine tools. A modern CNC is expected to provide an on-line multi-dimensional graphical interface to the operator, communicate part program and statistical process data via the cell controller. It needs to track tool locations and conditions, and concurrently maintain precise control over one or more multi-axis machining andlor part handling tasks. It operates with 5 times the resolution and 5 to 10 times the speed of previous machines.
Continued growth in CNC technology can be maintained only if it is accompanied by a parallel evolution in axis drive technology. The most significant development in this area over recent years has been the digital communications interface which led to the fully digital drive. SERCOS (Serial, Real-Time Communications System) represents a standard for a serial communications interface in motion control systems with high performance and is based on a fibre optic ring.
With the decreasing cost of computation, the trend toward a broad application of digital control will certainly continue into the future. A permanently increasing number of modern CNC machine tools contain digital drives. This is the reason why controller producers (such as Siemens, Osai etc.) have supported research projects on digital controllers. Some major advantages of digital controllers are:
• Capability of making logical and conditional decisions on the basis of real-time data. • Very easy reconfiguration through software.
• Implementation of filtering or non-linear conversion on data. • Storage of operational data for later analysis etc.
Referring to digital drives Papiernik [16] shows that the quality of the machining pfocess is mainly determined by:
• The tracking behaviour of the control / converter system - due to feasible path profiles generated from the programmed contour, time-optimised smooth motion control and a central feed forward control of acceleration and speed and the response to disturbances; • The optimum response to disturbances - achieved by axial feed forward strategies for
In another paper [17], the same author represents the CNC machine tool axis drive as a system of masses that vibrate. Because in practice it is very difficult to reduce the vibrations due to resonance frequencies of each element, the author considers only a two-mass-system and applies the frequency analysis as an identification method. Also Papiernik designs a state-space controller for the simplified model. The main shortcoming of this approach consists of the simplification of the real machine to only a two-mass-system.
By analysing the literature on the modelling of CNC machine tools, it is evident that the requirement for a detailed model of a CNC machine tool is very important with a need not previously recognised. All authors have derived lumped parameter models, even in the case of digital drives, which are components of the most recently produced CNC machine tools.
2. 2. Errors in CNC machine tools
In order to achieve high performance specification for CNC machine tools it is essential that all the axis drives have good dynamic performance. The motion control accuracy is a function of the dynamic performance of the control system and the effects of machine time and spatial errors.
The design process of CNC machine tools must embrace error avoidance, error measurement and error correction techniques in order to meet an increasing demand for performance. But first of all, it is necessary to identify the basic types of errors that influence the CNC machine tool performance.
Error avoidance attempts to eliminate the effect of the source of error on the machine
tool or work-piece. Some methods for minimising the effects of the errors in machine tools are described by McKeown [18]. The author mentions that better mechanical design, machine tool construction techniques and the choice of better materials (from mechanical and thermal points of view) could improve the machine tool accuracy. Another way of improvement is by using more sophisticated controllers and transducers. However, these manufacturing solutions are extremely expensive to implement.
Error compensation consists of canceling or correcting the effect of the error. First of
all, the errors are measured and after that, the correction is applied. There are two basic categories of error compensation techniques:
• Active compensation - when the measurement of the error is done at the same time as the
Calibration data can be captured dynamically due to recent advances in laser interferometry. Static calibration is time consuming because the machine axis is moved to targeted positions, stopped and a measurement is taken. To overcome these inherent problems, Postlethwaite et al [24] presents a dynamic calibration method. Data is captured on a time basis at a high sampling frequency while the machine axis moves at a constant feed rate. The measured data is processed using a conversion software package and the results can be analysed using the conventional calibration software. To prove the efficiency of the proposed method, experimental results are compared with those obtained from static compensation technique.
Chen et al [25] shows significant improvements by introducing compensation from the results of a static test method and applies correction whilst undertaking aluminium cutting trials. The proposed model comprises 32 error values (instead of 21 individual geometric error components presented by Postlethwaite) because space domain and time domain errors are taken into consideration. The additional 11 components represent thermal effects of the machine tool as drifts in the workpiece and spindle. The model contains load-induced errors introduced by the method of fitting curves to experimental data. To obtain this model it is necessary to perform extensive measurements and data fitting.
The study of thermal errors includes measuring temperature at various points on the machine structure. Hardwick [26] presents the variant of placing the thermal sensors intuitively around the machine structure. This method does not allow for the sensors to be in their optimum positions and the training period for coefficient identification is prohibitive.
A thermal error compensation system was implemented on a machine tool more quickly and practically by Allen [27]. He developed a thermal model which " relates temperature
measurements made at selected points on the machine structure to the overall temperature distribution". The temperature distribution along a line is calculated from temperature
measurements using a curve-fitting method applied between pairs of sensors. The position of thermal sensors is optimised by using a thermal imaging camera and associated cost function analysis software. The temperature model is then used to produce a distortion model that
"calculates the distortion of a structural element from the temperature distribution". The
system is able to determine the required amount of correction and apply it on-line.
The application of this technique to the head slide of a vertical machining centre is shown by Postlethwaite et al [28]. The software package performs two important functions:
estimation (off-line) for the temperature model is performed with special software written in MATLAB.
• The distortion corrections necessary to modify the rigid and non-rigid kinematics models are derived from the readings of thermal sensors. The software is written using Borland Turbo C V2.O in the DOS environment. The main advantage of this novel technique for reducing work-piece errors caused by the machine's thermal distortion consists of cost and time effectiveness because the data is measured during short heating and cooling tests. Chen et al [29] regards the identification of load induced effects as an integral part of a complete error compensation package. Collecting this data requires significant time for pre-calibration compensation when thermal effects can introduce errors to this measurement, so it is necessary to elaborate a clear and structured strategy for measurement. The effects of work-piece weight and the overall coupling of errors are not examined.
Blake [30] identifies a method for isolating load effects so that individual components can be predicted in the future. From tests done on a wide range of machines, he finds that the moving slide and work-piece weight generally cause a change in angular error components. Those changes, measured on-line, are introduced into the geometric model developed by Postlethwaite [21].
Ford et al [3] describes measurement strategies for the separation of the geometric and non-rigid errors, which will be used in a correction algorithm. The accent is on the angular error components which are the main geometric error components exhibiting a non-rigid effect. The effects of thermal errors on linear measurements are minimised by running the axes used during machining through a warm-up cycle.
The three categories of errors are discussed by Ford et al [2], who proposes various methods to compensate for these errors. The conclusion is that the best approach to reduce the errors in machine tools is a compromise between good design and compensation techniques.
achieved is 10:1 and the thermal error improvement is 9.3:1 for a CNC vertical milling machine Beaver VC 35 and 7:1 for other types of machines on industrial sites.
The effectiveness of a volumetric error compensation scheme relies on a calibration methodology that can measure accurately the volumetric errors. Popular calibration techniques for acceptance testing and periodic checking of overall volumetric errors are the artefact inspection, telescoping ball bar and laser interferometer methods.
Kirkham [32] calculates the positioning errors using spheres of measurement (within the machine's working volume) provided by a machine-checking gauge. Many unknown set-up errors are likely to occur due to the large number of necessary measurements. The overall accuracy of the data is reduced in this way. To minimise the effect of the errors, the author uses statistical analysis techniques. The final model obtained is a compromise between static and dynamic performance.
Kakino et al [33] develops the double ball bar method for the measurement of 2-dimensional and 3-2-dimensional accuracy. The geometric deviations and those caused by numerical control can be recorded and analysed in a relatively simple way. The principle of error origin diagnosis by the circular interpolation test is explained. In order to optimise this method for motion error and accuracy evaluation it is necessary to obtain as much measuring data as possible.
Some experimental results obtained by using the telescopic ball bar, for a wide range of machining and turning centre configurations, are analysed by Smith et al [34]. The influence of different designs of machine tools and their axis configurations upon the profile-error plot of the ball bar must be appreciated. When error compensation is applied to the CNC controller from data provided by laser, precision levels etc. the ball bar system demonstrates that th contouring performance of the machine is improved.
The laser interferometer system is considered to be the most reliable and accurate calibration tool because the noise effects are minimised. The laser is largely a static method but it could be used in a dynamic way as was shown by Postlethwaite et al [24]. Blackshaw et al [36] describes the use of a laser interferometer to measure the linear positioning accuracy of one axis of a high precision lathe. On the basis of the measured data, the compensation was applied through the machine tool controller.
Okafor et al [37] determined the accuracy of a vertical machining centre motion control systems using a laser interferometer and other precision instrumentation. The X-axis (top table axis) was found to have the worst linear displacement accuracy and the X-axis pitch and the Y-axis yaw have the highest values among all the angular errors. The laser interferometer system has a lot of advantages such as its ruggedness portability, compatibility, high resolution and automatic data capture. The main shortcoming is that the optic set-up and laser-path alignment is time-consuming. To overcome this, Chen et al [38] has developed an auto-alignment laser interferometer capable of a diagonal measurement (when multiple machine axes are moved simultaneously) with automatic optic alignment. The complete calibration of a 3-axis machine can be achieved in one hour instead of several days using the conventional laser interferometer system. Again, the accuracy and reliability of the straightness errors are arguable when the machine produces significant noise during measurement. An averaging technique is proposed to overcome this problem. It is a method that is useful for comparative checking against similar machine types and configurations. Absolute volumetric error detail cannot readily be obtained by this method. Also the 21 sources of error that make up the volumetric error figure cannot be completely separated.
All of the above methods are to determine geometric, non-rigid or dynamic contourink effects, but the measurement practices try to keep the thermal effects to a minimum.
Thermal errors have been investigated by Allen [27] and White [39] and their effects demonstrated to be significant in terms of machine performance, but the changes are relatively slow and are outside of the scope of this research proposal. Ford et al [31] demonstrated that a geometric and thermal model can be combined to achieve compensation.
2. 3. Parameter identification methods for non-linear systems 2. 3. 1. General
within. There is therefore a need for good identification practices and stringent hardware testing procedures in order to determine the relevant parameters.
There is a strong link between identification, modelling and estimation. Modelling represents the process of setting up the mathematical model of the system, based on data relying on physical principles, empirical relations or other a priori information. Estimation refers to the process of obtaining the parameters of a given model, normally from stochastic linear differential or difference equations. Identification is the process of selecting a parameterised model and then obtaining its parameters. Hence identification refers to modelling followed by estimation. The modelling stage associated with process identification
is often referred to as "model structure determination".
Ljung et al [40] formulated a sequence of questions that any user of identification methods must answer:
• Has system identification anything to offer to my problem? • How should I design the identification experiment?
• Within which set of models should I look for a suitable description of the system? • What criterion should I use for selecting that model set that best describes the data? • Is the model obtained an adequate represen