© 2018, IRJET | Impact Factor value: 6.171 | ISO 9001:2008 Certified Journal | Page 4397 Study the effects of Solid and Liquid Contamination in Ball Bearing through Vibration Analysis
Akhilesh Soni1, Ambuj Pateriya2, Surendra singh Dewada3
1Assistant Professor, Dept. Of Mechanical Engineering, MANIT Bhopal, Madhya Pradesh, INDIA
2,3M. Tech. Scholar, Dept. Of Mechanical Engineering, MANIT Bhopal, Madhya Pradesh, INDIA
---***---Abstract - Ball bearings are widely used mechanical parts in Rotating Machinery, Automobiles and Aerospace etc, Bearings are Lubricated with Grease to Reduce Friction So that It Can Run Smoothly.Greasess are often contaminated with Different Contaminants like Solid contaminants and Liquid Contaminants and these contaminations are prime Factors for Bearing Failure,Here we study the influence of both solid and liquid contamination in bearings. It is difficult to study the combined effect of solid and Liquid contamination but it can be done with the help of Vibration analysis Technique,The Data of clean bearing and the contaminated bearing were compared.Greases were contaminated with different size quartz particle with variable concentration and with different types of water form like salt water,Soap Water,Rain Municipal Water,Rain water of various concentration.The data were obtained by the Accelerometer and the vibrations were interpreted in the form of root mean square(RMS) values of amplitudes in term of acceleration and acceleration at particular defect frequencies ,compared the data with healthy Bearing which revealed that due to contaminations there were sudden increment in Vibrations which reduced the life of Bearing
Keywords: Deep groove ball bearing, solid contaminant, liquid contaminant, greases, vibration
1. INTRODUCTION
Bearings are the main component of the rotating parts in the machines and their proper functioning depend upon smooth and quiet Running of bearings. Bearings are critical mechanical part in industrial applications any fault in the bearing can cause failure of machine thus the condition based maintenance are necessary for detecting the fault in order to increase the effectiveness of bearing used in the machine .Detection of fault in early stage can prevent failure thus save cost imposed due to it.There are various condition based monitoring Techniques for the detection and diagnosis of the bearing faults which predicts current and future condition of Bearing.These techniques are vibration and acoustic measurements[1], temperature measurements and wear debris analysis.Among the vibration based fault detection[2] most commonly used because vibration based condition monitoring is more reliable compared to other analysis Greases are contaminated due to environmental condition, mistake by human, direct metal to metal contact etc and
these Greases are used for lubrication in almost 90% of bearings which can cause damage to bearing [3]
The Life of Bearing is strongly influenced by the contaminations and these contaminations can be solid and liquid ,Noise and vibration is produced by the solid contaminations, Analysis and study of vibration due to solid contamination is easily available[4,5,6] and few studies on vibration due to liquid contamination[7] In This Article the objective is to study the effect of combined solid and liquid contaminations in Grease by Vibration signature analysis. Solid contaminants were taken in form of sand particles of different sizes and of different concentration .The liquid contaminants were water of different form like Salt Water, Soap Water, Municipal Water, Rain Water, There are not many literature available related to water contamination in Grease but some studies showed that only 1% of water in grease can have influenced the life of Bearing [].water also Intiated Rusting phenomenon ,Texture and Adhesiveness can also be effected by the water in grease probably is an inferior lubricant Vibration Signals were analyzed in the form of RMS values and after analyzing the results some useful results were found
2. METHODOLOGY AND SAMPLE PREPARATION
2.1 Bearing Selection-The Bearing Selected for this experiment is Deep Groove Ball Bearing SKF 6303 whose outside diameter is 47 mm, bore diameter 17 mm and 7 number of balls .The Deep groove Ball Bearings are used because of High Load carrying Capacity and can run appropriately at high running speed. The size and Number of balls in bearing decides the load carrying capacity 2.2 Grease -The Grease used in this Experiment was Lithium complex soap based Grease and its amount were 5gms.
2.3 Solid contaminants-The solid contaminants were in form of Sand particles of 5 different sizes 75 micron,90 micron,100 micron,300 micron and 425 micron with 3 concentrations, 0.75gm,1gm,1.25gm
© 2018, IRJET | Impact Factor value: 6.171 | ISO 9001:2008 Certified Journal | Page 4398 2.5 Mixing solid and liquid contaminants with
Grease-The Sand particles of different sizes and concentration and water of different types in variable % of grease weight were mixed with the grease in the speed mixer ,The speed of the mixer was 1000 RPM for 8 minutes to made homogenous mixture, The mixed air was removed before any sample preparation by rotating mixer at 1200 for 2 minutes, from different variations of solid and liquid contaminations Total 120 samples can be prepared .and
[image:2.612.328.574.357.620.2]from that 20 samples were used for the Experiment TABLE-1: Samples constitute
3. EXPERIMENTAL SETUP
The setup which was used for the experiment was Machine Fault Simulator rotor dynamics simulator (MFS-RDS).Figure 2 shows the actual setup on which Experiment was carried out. The specifications of the setup are provided below. The setup was free from structure vibrations. The setup consists of a motor, shaft, Flexible coupling, bearing, tachometer, SKF FFT Analyzer, accelerometer etc.The software used for analyzing vibrations was Smart office.
Figure MFS-RDS Setup
4.TEST AND DATA COLLECTION
In this Experiment speed remained constant at 1200 RPM and the Tests were performed on 20 prepared samples. Test performed on 6303 Deep Groove Ball Bearing .Each Test followed the sequence of steps .First the bearing running in Healthy grease to stabilize the temperature of grease. In second step Test was continued with Healthy grease and vibration data were collected. In the next step contaminated bearing fixed in the shaft after which vibration data were collected for the contaminated bearings.
This Procedure was repeated for the remaining samples, The data of both healthy Bearing and Contaminated bearings were recorded and analyzed with respect to peak values, Root mean square values related to specific defect frequencies by the FFT analyzer, some of the results and comparisons are specified below
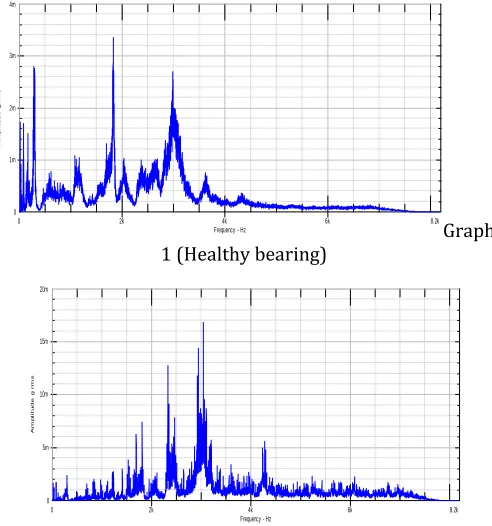
The following 3 Graphs between Amplitude (in mm) vs. frequency Shows the comparison between Healthy and contaminated Bearings
Graph 1 (Healthy bearing)
Graph 2 (Sample 2) (mineral water, 10%, 75microns, 0.75gm
Frequency - Hz
Am
p
li
t
u
d
e
g
rm
s
0 2k 4k 6k 8.2k
0 4m
3m
2m
1m
Frequency - Hz
Am
p
li
t
u
d
e
g
rm
s
0 2k 4k 6k 8.2k
0 20m
15m
10m
[image:2.612.55.268.538.696.2]© 2018, IRJET | Impact Factor value: 6.171 | ISO 9001:2008 Certified Journal | Page 4399 Graph 3 (sample 3) (salt water, 10%, 75microns, 0.75gm)
Graph 4(sample 4) (Rain water, 15%, 75microns, 1gm
Graph 5 (Sample 5) (Rain water, 15%, 100micron, 1gm)
5. Results
To show the effect of water, comparison between sample 2 and sample 3 which are shown in graph 2 and graph 3 is done. Sample 1 (mineral water, 10%, 75microns, 0.75gm) and sample 3 (salt water, 10%, 75microns, 0.75gm) have same constituent except the water type. In the former one mineral water was used and in latter one salt water. By analyzing the vibration signatures of graph 2 and graph 3, it can be inferred that peak value or amplitude remain nearly same in both the cases because Particle size and concentration remains unchanged. There is waviness in graph 3 compared to the graph 2, this is because in the sample 2 mineral water was used and in sample 3 salt water was used. From this comparison it is possible to say that salt water causes more damage than mineral water to bearings
Sand particle effect shown in graph 4 and graph 5.The sample which are used for comparisons are sample 4 and sample 5.
Sample 4 (Rain water, 15%, 75microns, 1gm) and sample 5 (Rain water, 15%, 100micron, 1gm) have same constituent except the different particle size i.e. 75 micron and 100 microns respectively.
By analyzing the vibration trends, it is clearly visible that amplitude in graph 4 is around 20 mm and amplitude in graph 5 is around 70 mm which shows the particle size effect.
Waviness remains same as the same type of water was used in both the sample. It can be deduced that as particle size increase vibration trends also increases.
Vibration signature trends according to particle size shown in line graph below
Bearing most affected by the following water types shown in figure below
Frequency - Hz
A
m
p
li
t
u
d
e
g
rm
s
0 2k 4k 6k 8.2k
0 40m
30m
20m
10m
Frequency - Hz
Am
p
li
tu
d
e
g
rm
s
0 2k 4k 6k 8.2k
0 20m
15m
10m
5m
Frequency - Hz
Am
p
li
t
u
d
e
g
rm
s
0 2k 4k 6k 8.2k
0 80m
60m
40m
20m
© 2018, IRJET | Impact Factor value: 6.171 | ISO 9001:2008 Certified Journal | Page 4400
6. CONCLUSIONS
1. It is observed that with the increase in particle size vibration level first increases and then after certain size it decreases the most likely factor for vibration level decrement is particle settling effect.
2. Water of different types cause significant damage in the Bearing, because of water waviness produced in the graphs, multiple time peak amplitude came which causes the wear in the Bearing i.e. corrosion wear, abrasive wear and it is visible in the Bearings after the test.
3. Particle concentrations have similar effect as particle size when both combined then up to certain limit vibration level increases.
4. The waviness in the graphs and the corrosion wear are more significant in Bearing with salt water and least with mineral water. Soap water comes before the rain water.
7. FUTURE SCOPE
1. Finite Element Analysis of this Experiment
2. Study the combined Effect of solid and liquid contamination by Acoustic emission method, Stator current Method, Shock pulse method
3. Test can be performed on other Bearings like Hydrodynamic Bearings etc
ACKNOWLEDGMENTS
I would like to thank Mr.Rohit Tamrakar and Members of Vibration Lab. of Maulana Azad National Institute of Technology for giving me all their support & cooperation for my project work.
REFERENCES
[1] Juha Miettinen& Peter Anderson, “Acoustic emission of rolling bearings lubricated with contaminated grease.” Tribology International 33 (2000) 777–787.
[2] Reza golafshan, (2015) “VIBRATION-BASED FAULT DETECTION FOR BALL BEARINGS”, page no.1-8.
[3] Lugt PM. “Grease lubrication in rolling bearings”, John Wiley & Sons, Ltd.; 2013 (Tribology series).
[4] M.M. Maru, R.S. Castillo, “Study of solid contamination in ball bearings through vibration and wear analyses”, Tribology International 40 (2007) 433–440.
[5] Onkar L. Mahajan &Abhay A. Utpat“study of effect of solid contaminants in the lubricant on ball bearings vibration”International Journal of Instrumentation, Control and Automation (IJICA) ISSN: 2231-1890, Vol-1 Iss-3, 4, 2012.
[6]YogesharaoY.More,Dr.D.Y.Patil&.A.P.Deshmukh “study of effect of solid contaminants in grease on performance of ball bearing by vibration analysis “international journal of innovations in engineering research and technology [IJIERT]ISSN: 2394-3696Volume 2, ISSUE 5, May-2015. [7] Johan Leckner “effects of water contamination on greases” Axel Christiernsson International AB Nol, Sweden 25th ELGI Annual General Meeting the Netherlands 20th – 23rd April 2013.
[8]Su.Y.-T, Lin. M.-H. and Lee. M.-S (1993), “The effect of surface irregularities on roller bearing vibrations”, Journal of Sound and Vibration, Vol 165(3), pp.455-466.
[9] Timken Automotive TechTips Vol.3 Issue 5 2009. [10] SKF Tech tip TT 09-004, March 2009.
[11] B. S. Nagarkoti, “Water resistance properties of grease- An outlook.” Paper from NLGI-India 12th Lubricating grease conference, January 28-30, 2010. [12] Abhay Utpat, R.B. Ingle, M.R. Nandgaonkar, “Study of vibration response characteristics of deep groove Ball Bearings with localized defect on its races”, Journal of Mechanical Engineering,(ISSN-0039-2472), ), 62, 5-6 ,2011,pp-311.
[13] N. Tandon, G.S. Yadava, K.M. Ramakrishna, “A comparison of some condition monitoring techniques for the detection of defect in induction motor ball bearings”, Mechanical Systems and Signal Processing 21 (2007) 244– 256
[14] V Hariharan, P S S Srinivasan, “Condition monitoring studies on ball bearings considering solid contaminants in the lubricant”, Journal of Mechanical Engineering Science 2010 224: 1727, DOI: 10.1243/09544062JMES1885 [15] Elbestawi, M. A. and H. J. Tait “A Comparative Study of Vibration Monitoring Techniques for Rolling Element Bearings”, Proceedings of the International Modal Analysis Conference, pp. 1510-1517, (1986).
© 2018, IRJET | Impact Factor value: 6.171 | ISO 9001:2008 Certified Journal | Page 4401 [17] Bhandari V.B., “Machine Design”, Tata McGraw-Hill,
3rd edition, 2010.
[18] Attel Manjunath,D.V.Girish “Defect detection in deep groove polymer ball bearing using vibration analysis”, International Journal of Recent Advance in Mechanical Engineering (IJMECH) Vol.2, No.3, August 2013.
[19] Mangesh Dhavlikar, Dr.S.B.Wadkar “Condition Monitoring of ball bearing usingstatistical analysis”, International Journal of Scientific Advance Engineering and Technology Vol.3, Issue No.2, pp: 186-192.
[20] Prasad H, Ghosh M, Biswas S. Early detection of defects in anti-friction bearings. In: Proceedings of National Conference on Industrial Tribology, Hyderabad, India, July, 1984. p.1.1–0.
[21] Prasad H. Condition monitoring of anti-friction bearings. J Instn Engrs (India) — Mech Eng Div 1988;69:65–74.
[22] Ghosh M, Rajamani A. Diagnostic monitoring of antifriction bearings. In: Proceedings of International Conference on Noise Control Engineering, Cambridge, MA, July, 1986. p.1187–90.
[23] Brown DN. Envelope analysis detects bearing faults before major damage occurs. Pulp & Paper 1989; 63(13):113–7.
[24] Burgess PFJ. Antifriction bearing fault detection using envelope detection. Trans Instn Prof Engrs, New Zealand 1988; 15(2):77–82.