© 2017, IRJET | Impact Factor value: 5.181 | ISO 9001:2008 Certified Journal | Page 980
Optimization of Thermal Performance of Double Pipe Heat Exchanger
using Mechanical Turbulators
Jashanjot Singh Cheema
1, Sandeep Salodkar
2, Gurjeet Singh
3, S K Soni
41
M.E. Scholar, Department of Mechanical engineering, PEC University of Technology, Chandigarh
23Assistant Professor, Department of Mechanical engineering, PEC University of Technology, Chandigarh
4
Associate Professor, Department of Mechanical engineering, PEC University of Technology, Chandigarh
---***---Abstract -
This research work is focused on Optimization ofDouble Pipe Counter Flow Heat Exchanger. The Coiled Mechanical Turbulators are inserted in pipe of Heat exchanger and experiments are performed by varying Spacing between Turbulators, Mass flow rates of Hot and cold waters. Values of Overall Heat Transfer coefficient and pressure drop are obtained. Taguchi Method was used to optimize Overall Heat Transfer coefficient & Pressure drop individually and later Grey Relation Analysis (GRA) has been employed for simultaneous optimization of multi-response characteristics i.e. Overall Heat Transfer coefficient and Pressure Drop. Research provided the optimum values for individually of Overall Heat Transfer coefficient and Pressure drop and also optimum values for both simultaneously. For the Overall Heat Transfer Coefficient, it was observed that optimal combination of process parameters are mc is 1500lph, mh is 2000lph, pitch
is 2cm and optimum value for Overall Heat Transfer coefficient is 7486.57 w/m2k and pressure drop at these
parameters is 3014.78N/m2.For the Pressure Drop it was
observed that Optimal combination of process parameters are mc is 1500lph, mh is 1500lph, pitch is 10cm and optimum value
for pressure drop is 1785.17 N/m2 and Overall Heat Transfer
coefficient at these parameters is 4682.17 w/m2k. Using GRA,
optimization of the multi response has been converted into single response called grey relation grade and the optimal combination of the process parameters for multiple performance optimization has been found to be mc is 1500lph,
mh is 1700lph, pitch is 6cm and the optimal value for Overall
Heat Transfer coefficient s 5803.994 w/m2k and Pressure drop
is 2408.8N/m2.
Key Words
:
Heat Enhancement, Mechanical Turbulators, Optimization, Taguchi, Grey AnalysisAbbreviations and Symbols
Abbreviation Description
SN Signal to Noise
lph Litre Per Hour
HP Horse Power
KW Kilowatt
mc Mass flow Rate of cold
water
mh Mass flow rate of Hot water
Symbol Description
▲P Pressure Drop
U Overall Heat Transfer
coefficient
Q Heat
m Meter
cm Centimetre
N SN Normalized SN ratio
ξ Grey Relation Coefficient
ἠ Grey Relation Grade
1. INTRODUCTION
1.1 Heat Transfer Enhancement Techniques
The augmentation of heat transfer is defined as the process to increase the heat transfer rate in heat exchanger. This process also helps to redesign the heat exchanger by reducing the size of heat exchanger but also high initial investment. Broadly the devices which are used to enhance the heat transfer rate in pipe of heat exchanger are called turbulators. And these turbulators are divided into two categories Active and Passive.
Active Techniques for Heat Transfer Enhancement-Active techniques of heat transfer enhancement are those which require external power ex. surface vibration, fluid vibration, injection, suction, and electric or acoustic fields.
© 2017, IRJET | Impact Factor value: 5.181 | ISO 9001:2008 Certified Journal | Page 981
and tapes, the insertion of coil wire and helical wire coil andthe installation of turbulators in the heat exchangers. The results of these types of turbulators are studied by many authors showing increase in heat transfer rate and also increase in friction factor leading to pressure drop in pipe.
1.2 Optimization
Optimization is process or a methodology which is used to obtain the best results to any problem. This is a process to maximize or minimize any objective function. Objective function is defined as the response which is required from the problem example it can be heat transfer rate, pressure drop, heat transfer coefficient. In present work my objective functions are defined as the maximization of overall heat transfer coefficient and minimization of pressure drop. There are many optimization techniques which are used depending upon the formulation of problem like Response Surface Methodology, Taguchi SN analysis, Grey Analysis. Taguchi process and Grey analysis is used in present work for optimization of objective function. To make optimization process easy Minitab software is used to make calculations for SN ratios and to obtain graphs of SN ratios.
MINITAB: Minitab is a software which is used to analyse the data. It provides a simple, effective way to input the statistical data, manipulate that data, identify trends and patterns, and then extrapolate answers to the current issues. This is most widely used software for business of all sizes - small, medium and large. Minitab is also an effective tool for analysing DOE problem, Response surface optimization, Taguchi Analysis, Making of graphs etc.
Taguchi Optimization Analysis-Taguchi Method is an optimization method that is based on 8-steps of planning, conducting and evaluating results of experiments to determine the best levels of control/input factors. The primary goal is to keep the variance in the output very low even in the presence of noise inputs.
There are 3 Signal-to-Noise ratios of common interest for optimization of Static Problems;
(I) Smaller-The-Better
n = -10 Log10 [mean of sum of squares of measured data]
This S/N ratio is used for all undesirable characteristics like "defects" etc. for which the ideal value is zero. (II) Larger-The-Better
n = -10 Log10 [mean of sum squares of reciprocal of
measured data]
This S/N ratio is used when our objective function is to be maximized like Heat transfer rate in heat exchanger, MRR in machining process etc. This case has been converted to Smaller-The-Better by taking the reciprocals of measured data and then taking the S/N ratio as in the smaller-the-better case.
(III) Nominal-The-Best
This s/n ratio is used when objective function is to be optimized in between of two limits.
n = 10 Log10 [square of mean variance]
Grey Analysis-The Grey system theory, was proposed by Deng in 1982, is mainly used to study the effect of control/Input parameters on multi response system. In present work, there are 2 responses and 3 control factors. In GRA, experimental data are first normalized in the range of zero to one, called grey relational generation. Based on that normalized data the grey relational coefficient is calculated to represent the correlation between desired and actual experimental data. Then overall grey relational grade is calculated by averaging the grey relational coefficient for the respective responses. So, the multi response problem can be converted into a single response process optimization problem with overall grey relational grade (GRG) as objective function.
2. METHODOLOGY
• Selection of type of Heat exchanger
Counter flow heat exchanger is selected for experiment over the Parallel flow heat exchanger because effectiveness of counter flow heat exchanger is more than the parallel flow heat exchanger. For same area of heat transfer counter flow will give more heat transfer rate than the parallel flow
• Selection of Turbulators
There are many types of turbulators available but in present work I used constant Crossection coil spring because of easy manufacturing and less costly than the others.
• Selection of Input Parameters
There are many input factors that can be controlled in experiment example length of turbulators, inlet temperature of hot and cold fluid, spacing between turbulators, mass flow rates of both fluids, from these all I have selected mane three parameters whose effect is studied on the pressure drop and overall heat transfer rate i.e. Mass flow rate of both fluids and spacing between turbulators.
• Selection of Values of Parameters
After studying the previous year papers [4], [13] it is concluded that heat transfer rate increases with increase in mass flow rate of fluid that is why I selected the values of mass flow rates near to maximum that can be provided by rotameter.
• Design of experiment
In this step experiment is designed levels of all three factors are selected total number of experiments are calculated and all are arranged on L27 Array.
• Execution of Experiment
© 2017, IRJET | Impact Factor value: 5.181 | ISO 9001:2008 Certified Journal | Page 982
• Analysis to obtain Results
Results are analysed obtained from experimentation and graphs are obtained for overall heat transfer coefficient and pressure drop against the input parameters
• Optimization Analysis
Taguchi and Grey analysis is performed to get the optimum values of input parameters of overall heat transfer coefficient, Pressure drop and combination of both.
[image:3.595.39.288.258.481.2]3. EXPERIMENTAL SETUP
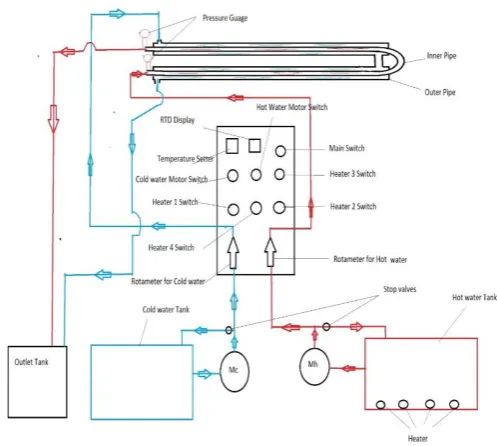
[image:3.595.39.555.517.733.2]Figure:1 Line Diagram of Double Pipe Heat Exchanger
Figure 2: Double Pipe Heat Exchanger
The Heat exchanger used for study is concentric double pipe single pass counter flow whose Line diagram is shown in Figure 1 and picture of experiment setup is shown in Figure 2. Heat Exchanger used consist MS water tank having capacity of 260 litres which contains hot water and Two tanks of capacity 600 litre and 300 litre one for collecting outlet warm water and one for supplying in the cold water. Hot water tank contains four heaters of capacity 2KW each that are used to maintain a constant temperature of 75 degree Celsius in hot water tank. Hot water motor pump has power of 1HP and for cold water has power of 0.5 HP. Heat exchanger contains two pipes,
Inner pipe is made of copper with inner diameter
2.15 cm and thickness 7mm and of 4m length and its U-bend is of length 0.232m which make total test section length 4.232m
Outer pipe is made of Galvanized Iron with inner
diameter 4.5cm and thickness 25mm and has length equal to inner pipe approximately.
Two rotameters were used to monitor the flow rate of hot water and cold water in heat exchanger where hot water rotameters range is 0-2000lph and cold-water rotameter has range of 0-1500lph.
Two pressure gauges were used for calculating pressure drop along test section both of 0-15 Lb./inch2 range
Passive Mechanical Turbulators
Constant Crossection coils are used as turbulators which will create turbulence in fluid flow and enhance heat transfer rate. Shape and dimensions of coil is shown in Table 1 and fig 3 shows how coil is installed inside of copper tube of Double Pipe Heat Exchanger. Coil Turbulators are made of high carbon spring steel with 9 cm of length and an external diameter of 1.8cm. The Turbulators are mounted at regular intervals in inner pipe of Heat exchanger.
Table: 1 Turbulator dimensions
Figure: 3 Coil Turbulator and Pitch
Lenght Diameter Thickness Number of coils
© 2017, IRJET | Impact Factor value: 5.181 | ISO 9001:2008 Certified Journal | Page 983
Formulation of ExperimentInput Parameters Output Parameters 1.Mass flow rate of Hot
water 1. Overall Heat Transfer Coefficient
2.Mass flow rate of hot water 2.Pressure Drop 3. Pitch – Spacing between
turbulators
Table: 2 Process Parameters
All three input parameters have three different levels i.e. different values as shown in table 3
Factors/Levels 1 2 3 Units
mc 1000 1300 1500 lph
mh 1500 1700 2000 lph
[image:4.595.39.560.51.532.2]Pitch 10 6 2 cm
Table: 3 Level of Process Parameters
4. RESULTS AND DISCUSSION
Overall Heat Transfer Coefficient Analysis
Overall heat transfer coefficient is calculated by equating heat transfer by LMTD equation and Heat Drop by Hot water.
Figure: 4 Variation of U with mh at mc=1000 lph
Graph in Figure 4 Shows Variation of overall Heat transfer coefficient with Mass flow rate of Hot water at different pitches at fixed Mass flow rate of cold water i.e. mc=1000 lph.
Value of U increases with increase in mass flow rate of hot water and with decrease in pitch.U is maximum when mh=2000 lph and spacing between Spring is 2cm. U is
[image:4.595.309.555.318.492.2]minimum when Mass flow rate of Hot water is 1500 lph and spacing is 10 cm.
Figure: 5 Variation of U with mh at mc=1300 lph
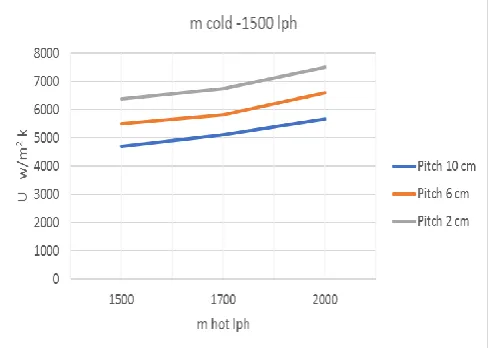
Figure: 6 Variation of U with mh at mc=1500 lph
Similar results are obtained when Mass flow rate of cold water is 1300lph and 1500 lph as shown by Graph in Figure 5 and graph in Figure 6.
Variation on U due to Mass flow rate of cold water can be analysed by observing all three graphs at same time, if we look value of U at mh=1500 and Spacing=10 cm it can be
observed value of U increases when Mass flow rate of cold water increases.
Optimization Analysis of Overall Heat Transfer Coefficient Graph shown below are obtained from MATLAB software. These are the optimum values of input parameter for maximization of overall heat transfer coefficient. Taguchi S/N ratio analysis is done to obtained results. Larger is better S/N formulation is used for Overall heat transfer coefficient and its values are shown in Table A3
Figure: 7 SN ratio curves for U
Optimum value of U is 7486.57 w/m2k at Pitch 2 cm, mc
1500 lph, mh 2000 lph at these Parameters Heat Drop is
[image:4.595.35.288.436.631.2]© 2017, IRJET | Impact Factor value: 5.181 | ISO 9001:2008 Certified Journal | Page 984
Pressure Drop AnalysisValues of Pressure Drop along the length of inner pipe are obtained from pressure gauges and are converted into SI units. With insertion of Turbulators in pipe will offer resistance and obstruction to flow of Hot water, therefore pressure drop is noted only for inner pipe.
Figure: 8 Pressure Drop Variation with mh
Graph in Fig. 8 shows the pressure drop variation along the inner pipe with pitch and Mass flow rate of hot fluid. It can be easily observed that pressure drop is increases when flow rate of hot fluid increases and pressure drop increases with decrease in pitch of turbulators. The pressure drop is maximum when Mass flow rate of hot water is maximum i.e. mh=2000lph and spacing between springs is minimum i.e. 2
cm.
Optimization Analysis of Pressure Drop
This Graph in Figure 9 shows the optimum values of input parameter for minimization of Pressure Drop. Taguchi S/N ratio analysis is done to obtained results and values are shown in Table A3. Smaller is better S/N formulation is used for Pressure Drop.
Figure: 9 SN ratio curves for Pressure Drop
Optimum value of ∆P is 1785.96 N/m2 at Pitch 10 cm, mc
1500 lph, mh 1500 lph at these Parameters Heat Drop is
35.33 kw and Heat gain by cold water is 33.39 kw and 1.94 kw of heat is lost to environment.
Optimization Analysis by Grey Analysis when both responses U and ∆P considered
Graph in Figure 10 shows optimum value of parameters when both pressure drop and overall heat transfer cofficient are considered. This analysis is very important because from results of previos graphs it can be noted that results of pressure drop and overall heat transfer cofficient are opposite to each other.The parameter values which increases the U also increases the pressure drop.This thing is not dersired.Therefore this analysis is done to know the optimum parameters forwhich heat transfer rate is increased but not at the cost of high pressure drop.
© 2017, IRJET | Impact Factor value: 5.181 | ISO 9001:2008 Certified Journal | Page 985
Optimum value of ∆P is 2408.8 N/m2 and of U is 5803.993 at
Pitch 6 cm, mc 1500 lph, mh 1700 lph at these Parameters
Heat Drop is 40.32 kw and Heat gain by cold water is 38.27 kw and 2.05 kw of heat is lost to environment.
5. CONCLUSION
The objectives mentioned were successfully performed in the range of cold water varying from 500 lph to 1500 lph and hot water ranging from 1500 lph to 2000 lph, and pitch between turbulators from 2 cm to 10 cm. The most significant conclusions that were drawn after performing this experiment were as:
a) Keeping the experimentation conditions approximately
identical, Optimum value for overall heat transfer coefficient is obtained when mass flow rate of hot water and cold water is maximum and pitch is minimum. At the same time with increases in overall heat transfer coefficient it may also be noted that pressure drop also increases in that manner. Table shows the optimum values of overall heat transfer coefficient.
Pitch cm mc lph mh lph U w/m2k
2 1500 2000 7486.57
b) Optimum analysis for pressure drop is performed and it
may be concluded that effect of mass flow rate of cold water is nil on pressure drop because we have studied pressure drop only for pipe which contains turbulators. The Pressure drop is minimum when pitch is maximum and mass flow rate of hot water is minimum. Its values are shown in table
Pitch
cm lph mc lph mh ∆P N/m
2
10 1500 1500 1785.96
c) Grey Analysis performed to find optimum value of
overall heat transfer coefficient and pressure drop considering both. The optimum values are shown in table
Pitch
cm lph mc lph mh U w/m
2k ∆P
N/m2
6 1500 1700 5803.994 2408.8
Grey Analysis optimum solution decreased overall heat transfer coefficient by 22.47 % optimum solution of alone overall heat transfer coefficient given by Taguchi analysis. And increased the pressure drop by 34.87% than the optimum solution of pressure drop alone by Taguchi analysis.
REFERENCES
1. A Klaczak, “Heat transfer by laminar flow in a vertical pipe with twisted-tape inserts”, Heat and Mass Transfer, Vol. 36, 2000, pp. 195-199
2. A. Kumar, B.N. Prasad, “Investigation of twisted tape inserted solar Water heater heat transfer, friction factor and thermal performance results”, Renewable Energy, Vol. 19, No. 3, 2000, pp. 379-398
3. Alberto Garcia, Pedro G. Vicente, Antonio Viedma,
“Experimental study of heat transfer enhancement with wire coil inserts in laminar-transition-turbulent regimes at different Prandtl numbers”, International Journal of Heat and Mass Transfer, Vol. 48, No. 21-22, 2005, pp. 4640-4651.
4. Archit Sharma, Gurjeet Singh “Experimental Investigation
of Heat Transfer Enhancement Using U-Cut Semicircular Ring Turbulators in Double Pipe Heat Exchanger”
5. Bodius Salam*, Sumana Biswas, Shuvra Saha, Muhammad
Mostafa K Bhuiya ,“Heat transfer enhancement in a tube using rectangular-cut twisted tape insert”, 5th BSME
International Conference on Thermal Engineering Procedia Engineering, Vol. 56, 2013, pp. 96-103.
6. Chinaruk Thianpong, Petpices Eiamsa-ard, Khwanchit Wongcharee, Smith Eiamsa-ard, “Compound heat transfer enhancement of a dimpled tube with a twisted tape swirl generator”, International Communications in Heat and Mass Transfer, Vol. 36, No. 7, 2009, pp. 698-704.
7. CUI Yong-zhang and TIAN Mao-cheng , “Three-dimensional
numerical simulation of thermal hydraulic Performance of a circular tube with edge fold-twisted-tape inserts”, Journal of Hydrodynamics, Vol. 22, No. 5, 2010, pp. 662-670 8. Emre Turget, Gulsak Casmak, Cengiz yildiz “Optimization of
the concentric heat exchanger with injector turbulators by Taguchi method” 2011
9. Halit Bas, Veysel Ozceyhan “Optimization of Parameters for
Heat Transfer and Pressure Drop in a Tube with Twisted Tape Inserts by Using Taguchi Method”
10. J.L. Bhagoria, J.S. Saini, S.C. Solanki, “Heat transfer coefficient and friction factor correlations for rectangular solar air heater duct having transverse wedge shaped rib roughness on the absorber plate”, Renewable Energy, Vol. 25, No. 3, 2002, pp. 341–369
11. Juin Chen,Hans Muller-Steinhagen, Geoffrey G. Duffy, “Heat transfer enhancement in dimpled tubes”, Applied Thermal Engineering, Vol. 21, No. 5, 2001, pp. 535-547.
12. Kenan Yakut, Bayram Sahin, Suat Canbazoglu, “Performance and flow-induced vibration characteristics for conical-ring turbulators”, Applied Energy, Vol. 79, No. 1, 2004, pp. 65-76
13. Kushal Kamboj, Gurjeet Singh, Rohit Sharma, Dilbagh
Panchal, Jaspreet Hira “Heat transfer augmentation in double pipe heat exchanger using mechanical turbulators”
14. Liang-Bi Wang, Wen-Quan Tao, Qiu-Wang Wang, Ya-Ling
© 2017, IRJET | Impact Factor value: 5.181 | ISO 9001:2008 Certified Journal | Page 986
15. Mr. Kumbhar D.G.', Dr. Sane N.K, heat transfer behavior ina tube with conical wire coil inserts. The 3rd International Conference on Advances in Mechanical Engineering, January 4-6, 2010 S.V. National Institute of Technology, Surat - 395 007, Gujarat, India
16. P. Bharadwaj, A.D. Khondge, A.W. Date, “Heat transfer and pressure drop in a spirally grooved tube with twisted tape insert”, International Journal of Heat and Mass Transfer,Vol. 52, No. 7-8, 2009, pp. 1938-1944.
17. P. Murugesan, K. Mayilsamy, S. Suresh, P.S.S. Srinivasan,“Heat transfer and pressure drop characteristics in a circular tube fitted with and without v-cut twisted tape insert”, International Communications in Heat and Mass Transfer , Vol. 38, No. 3, 2011, pp. 329-334.
18. P. Promvonge, S. Eiamsa-ard, “Heat transfer behaviours
in a tube with combined conical-ring and twisted-tape insert”, International Communications in Heat and Mass Transfer, Vol. 34, No. 7, 2007, pp. 849-859.
19. P.Naphon, “Heat transfer and pressure drop in the horizontal double pipes with and without twisted tape insert”, International Communications in Heat and Mass Transfer , Vol. 33, 2006, pp. No. 33, 166-175.
20. Paisarn Naphon and Parkpoom Sriromruln, “Single-phase heat transfer and pressure drop in the micro-fin tubes with coiled wire insert”, International Communications in Heat and Mass Transfer, Vol. 33, No. 2, 2006, pp. 176-183.
21. Pongjet Promvonge, Teerapat Chompookham, Sutapat
Kwankaomeng, Chinaruk Thianpong, “Enhanced heat transfer in a triangular ribbed channel with longitudinal vortex generators”, Energy Conversion and Management, Vol. 51, No. 6, 2010, pp. 1242-1249
22. S. Ray, A.W. Date, “Friction and heat transfer
characteristics of flow through square duct with twisted tape insert”, International Journal of Heat and Mass Transfer, Vol. 46, No. 5, 2003, pp. 889-902.
23. Sami D. Salman, Abdul Amir H. Kadhum, Mohd S. Takriff, Abu Bakar Mohamad,“CFD simulation of heat transfer and friction factor augmentation in a circular tube fitted with elliptic-cut twisted tape inserts”, Mathematical Problems in Engineering, Article ID 163839, 2013, 7 pages.
24. Shou-Shing Hsieh, Feng-Yu Wu, Huang-Hsiu Tsai, “Turbulent heat transfer and flow characteristics in a horizontal circular tube with strip-type insert. Part I Fluid mechanics”, International Journal of Heat and Mass Transfer, Vol. 46, No. 5, 2003, pp. 823-835.
25. Shyy Woei Chang, Tsun Lirng Yang, Jin Shuen Liou,“Heat
transfer and pressure drop in tube with broken twisted tape insert”, Experimental Thermal and Fluid Science , Vol. 32, No. 2, 2007, pp. 489-501
26. Smith Eiamsa-ard and Pongjet Promvonge “Performance
assessment in a heat exchanger tube with alternate clockwise and counter-clockwise twisted-tape inserts”, International Journal of Heat and Mass Transfer, Vol. 53, No. 7-8, 2010, pp. 1364-1372.
27. Smith Eiamsa-ard , Chinaruk Thianpong , Petpices
Eiamsa-ard, Pongjet Promvonge, “Convective heat transfer in a circular tube with short-length twisted tape insert”, International Communications in Heat and Mass Transfer , Vol. 36, No. 4, 2009, pp. 365-371.
28. V. Zimparov, “Enhancement of heat transfer by a