How to cite this paper: Mbuthia, M.G. and Thaddaeus, E. (2015) Validating Customer Loyalty Model Using Structural Equa-tion Modelling in a Kenyan Hospital. Open Access Library Journal, 2: e1213. http://dx.doi.org/10.4236/oalib.1101213
Validating Customer Loyalty Model Using
Structural Equation Modelling in a
Kenyan Hospital
Mahuro G. Mbuthia1, Egondi Thaddaeus21Education Research Program, African Population and Heath Research Center (APHRC), Nairobi, Kenya 2Health Challenges and Systems, African Population and Heath Research Center (APHRC), Nairobi, Kenya
Email: [email protected], [email protected], [email protected]
Received 12 March 2015; accepted 27 March 2015; published 1 April 2015
Copyright © 2015 by authors and OALib.
This work is licensed under the Creative Commons Attribution International License (CC BY). http://creativecommons.org/licenses/by/4.0/
Abstract
In healthcare services, customer satisfaction measurement is increasingly gaining emphasis due to researchers’ and clinicians’ desire which is to get outcomes that reflect varying unique patient perceptions. Ultimately, the main aim of every patient is to have their disease or health problem alleviated. These parameters alienate healthcare service from other service contexts. The study sought to assess quality levels and examine drivers of patients’ loyalty in Aga Khan University Hospital, Nairobi (AKUHN) in Kenya. Semi-structured questionnaire was used to collect data through face-to-face interviews. The contextual measures mainly used in social, business and education fields were adopted and customized to fit healthcare environment. The 251 respon-dents were randomly selected and were proportional to the cluster of the services they sought. The causal relationship between service quality and customer loyalty as mediated by customer satisfaction and trust was analyzed using structural equation modeling. The model converged with good fit statistics. Both trust and customer satisfaction exhibited significantly strong mediating effects between quality of service and patients’ loyalty. This implies that customer satisfaction and trust are key parameters in explaining the strength of the significant relationship between quality of service and customer loyalty.
Keywords
Customer Satisfaction, Loyalty, Quality Service, Trust
Subject Areas: Consumer Behavior
1. Introduction
OALibJ | DOI:10.4236/oalib.1101213 2 April 2015 | Volume 2 | e1213 facility and increase the staff satisfaction [1]. This in return will encourage the patients to return to the health-care facility and accept the medical treatment services. The healthhealth-care industry is highly competitive and this intensity has forced private hospitals to scramble for and gain as much of the market share through rigorous marketing strategies. Thus it is imperative that the management of healthcare providers needs to understand the crucial issues that lead to brand loyalty among customers.
Aaker [2] discussed the role of loyalty in the brand equity process and specifically noted that brand loyalty leads to certain marketing advantages such as reduced marketing costs, more new customers and greater trade leverage. Winning market share and developing competitive advantage in an increasingly competitive market can be achieved by building customer loyalty. In a competitive environment, certain attributes such as customer satisfaction, trust, quality service and customer loyalty help service providers to enjoy a competitive edge against their rivals. While the importance of brand loyalty has been recognized in the marketing literature for at least three decades [3], the conceptualization and empirical validation of a loyalty model for healthcare context have not been addressed. The business to customer success is partly determined by whether the customer devel-ops loyalty to a particular service provider and this complements why more research should be done to focus on development and validation of loyalty model in the healthcare service environment and context.
At the same time, trust may also affect customer loyalty and satisfaction. In varying contexts, many authors describe trust as a basis for successful human interaction. However, in the business context, trust is perceived as a focal point for cooperation. Trust has been shown to facilitate efficient business transactions [4] and increase customer satisfaction [5]. Trust also helps organizations to reduce the risks associated with opportunism in ex-change relationships. More generally, trust promotes cooperative behaviour within organizations and between organizational stakeholder groups such as clients [5]; as such, trust can also serve as a source of competitive ad-vantage for the organization.
Recognizing that trust and customer satisfaction are vital factors in retaining customers, in a healthcare indus-try, this study investigates them as mediating factors between quality service and customer loyalty. In addition, this study will investigate which measures have the highest variance in explaining the factors of quality service, customer satisfaction, trust and purchase loyalty.
1.1. Context
The Aga Khan University Hospital Nairobi (AKUHN) has set the standards for comprehensive health care and modern medical education in East Africa. The dedicated staff, advanced facilities and state of the art technolo-gies have earned her a reputation as a leading medical institution and teaching hospital in the region, and beyond. With these elements, the public demand has forced her to spread her wings and on the other hand, the manage-ment have not ignored this great opportunity. Over 50 satellite clinics have been opened in major towns in Kenya within the last two years. Also over seven diagnostic centres offering either pathological, pharmacologi-cal or radiologipharmacologi-cal services have been opened to reduce patient load at the main hospital.
Patients at AKUHN benefit from the unique team-based approach to care, which enables patients to benefit from the diverse expertise of the entire team of medical professionals. As a teaching and referral hospital, evi-dence based approach to medicine is practiced which is driven by the cutting edge research conducted by the experienced faculty members. This has led to drastic budding up of patients to over 1500 inpatients and over 60,000 outpatients monthly. This has translated into increased staff strength both in the support and in medical fields. With this strength in both infrastructure and personnel, maintaining a high quality in healthcare services and fostering patient satisfaction and loyalty is key to the success of the AKUHN expansion strategy.
1.2. Theory of Change
OALibJ | DOI:10.4236/oalib.1101213 3 April 2015 | Volume 2 | e1213 Not only patient satisfaction but also patient trust with healthcare service providers is regarded as important to the patients. Despite all this, the principal goal of every patient is to have their ill-health alleviated or have their health improved or better still feel more comfortable after management. Therefore, any other perceived satisfy-ing approach by the healthcare service providers without accomplishsatisfy-ing the patient’s expectation will be deemed fruitless. These points differentiate the model in healthcare service from other general services in field of busi-ness, education or behaviour science.
1.3. Research Questions
The goal of this study was to evaluate the impact of the customer satisfaction and trust as mediating factors on the relationship between quality service and patient loyalty in AKUHN using structural equation modelling. Specifically, the study will examine the following research questions:
1) What are the causal effects of relationship of customer satisfaction and trust as mediators of the relation-ship between quality service and customers’ loyalty in a healthcare facility?
2) Can a previously used structural equation model mainly in social, business sand education context “fit” in a healthcare environment?
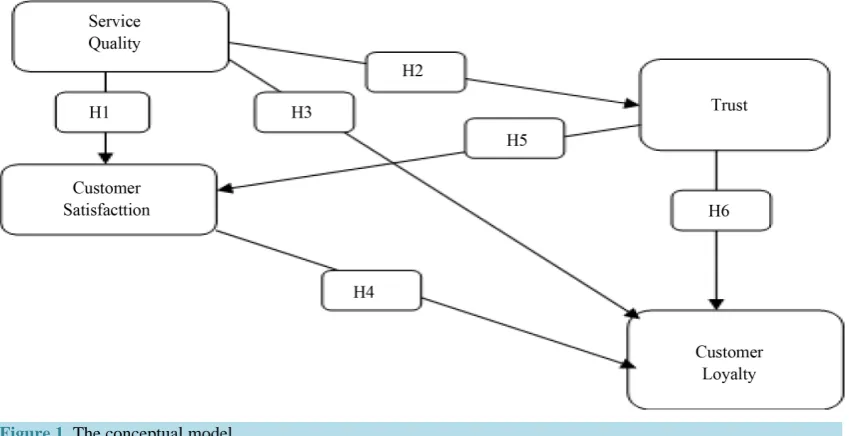
3) What are the key items that explain a lot of variation in quality service in a healthcare environment? To answer the aforementioned research questions, the casual relationships of the formative model shown in Figure 1. From the cause and effect as shown by the paths, a set of hypotheses can be formulated and tested empirically.
1.4. Hypothesis
1) Healthcare provider’s quality service has positive effect on the customer’s satisfaction, trust and loyalty. 2) Customer satisfaction has positive effect on the customer loyalty.
3) Customer’s trust in healthcare service provider has a positive effect on their satisfaction. 4) A high level of customer’s trust leads to a higher level of customer loyalty.
2. Literature Review
2.1. Service Quality
[image:3.595.87.512.499.717.2]In this study service quality and quality service will be used interchangeably and we define it as the extent to which a service meets customer’s needs and expectations. From literature, it has been defined as excellence [6], fitness for use [7], conformance to requirement [8] and meeting and/or exceeding customers’ expectations [9].
OALibJ | DOI:10.4236/oalib.1101213 4 April 2015 | Volume 2 | e1213 The focus of service quality is the improvement of the products and/or services that the customer needs and expects. Service quality should therefore measure the gap between the level of customer’s expectation and their rating of the services. Most often, customers will demand to experience quality of the service they are seeking for.
Services are produced and consumed simultaneously since customers are present, and therefore, affect or shape the performance and quality of the service. With this, there are instances where some disruption may arise leading to increased waiting time and consequently lower customer satisfaction [10]. The association between the two has made the researchers and analysts to regard quality with the might it deserves in the survival and success of the business.
2.2. Customer Satisfaction
Generally, when the customer’s expectation have been exceeded, met or not met, then we can estimate the level of customer satisfaction. Satisfaction is a consumer’s purchase perception of the difference between the ex-pected and received value of a transaction. Zeithaml and Bitner [11] defined customer satisfaction as the cus-tomers’ evaluation of a product/service in terms of whether that product/service has met their needs and expec-tations. The post-purchase evaluation by the customer and the response of the overall product or service experi-ence implies satisfaction. In a service context, [12] concluded that customer satisfaction was the key factor af-fecting service loyalty. Zairi [13] found that satisfied customers possibly share their experiences with five or six people while dissatisfied clients might inform another ten.
To obtain a high score in customer satisfaction, the service provider is expected to do as per customer’s ex-pectations. The service provider should not sit back and relax and hold it true that if you satisfy your customers, you will win their loyalty and translate to increased revenues. Increased profitability and growth in business is not barely based on customer satisfaction but originates from customer loyalty.
2.3. Trust
Successful human interaction forms the basis of trust whereas when in business context as many authors have cited, trust becomes the lubricant for cooperation. In the social phenomenon, trust forms a resource that pro-motes coordination and responsibility. In the circumstances of virtual anonymity, trust serves as a substitute for function of knowledge of the other actors within similar context.
Most researchers define trust in terms of positive expectations and a willingness to be vulnerable [14] such that party A confidently believes that party B will deliver expected results. The vulnerability arises because party A believes that party B will experienced, reliable, truthful and caring in its undertakings to deliver the positive expected results.
Similarly, trust is seen as a behavioural outcome based on the evaluation of trustworthiness of an actor [15]. Trust was also distinguished into two by McAllister [16] as either affection-based when openness and benevo-lence are overriding and cognition-based when competence and reliability of the involved parties are incorpo-rated.
2.4. Customer Loyalty
From many research, literature defines customer loyalty as the behaviour of repeat customers seeking for the product/service, giving good evaluations or testimonials on past experience. By using positive word of mouth publicly regarding a product or a service, these customers does the company or the service provider a great ser-vice by adding them more loyal and new customers. Accordingly, Oliver [17] defined customer loyalty as deeply held commitment to re-buy or re-patronize a preferred product/service consistently in the future and this ignites a repurchasing behaviour of the same-product/service despite situational market influences.
OALibJ | DOI:10.4236/oalib.1101213 5 April 2015 | Volume 2 | e1213 products/services offered by the company. This is not in vain as it equates to profitability, expansion and overall happy stakeholders.
The repeat customers develop emotional relationship with the company or service provider thereby elevating the loyalty levels. The same customers will positively speak of the company’s product/service and therefore in-crease the market-share. Definitely, the loyal customers are easy to maintain in the market share as opposed to new ones, they spend more on the products/ service of companies and tolerant when they feel a little dissatisfied with the product/service.
3. Methodology
3.1. Research Design
This study adopted a case study design in which, according to Bromley [18], it is a “systematic inquiry into an event or a set of related events which aims at describing and explaining the phenomenon of interest”. By carry-ing out this case study, we wish to demystify the questions of “how” and “why”, understand why we cannot ma-nipulate the re-purchase behaviour of the AKUHN customers and clarify the phenomenon under this context.
This study will offer detailed evidence that will justify the AKUHN tremendous expansion in Kenya despite its cost being higher than the government led healthcare facilities. This will also build a case why myriad of customers flock into this healthcare facility and distinguish whether the customers are blindly following the brand name or is it because of top-notch services offered.
3.2. Population, Sampling and Sample Size
Population. In this study, the population included all individuals who visited the AKUHN with an aim of seek-ing any healthcare related services in terms of diagnostic, curative or rehabilitative services and thereby referred to as patients. Parents accompanying their children (below age 15 years) were also considered as respondents to represent the views of their children since they are in one way the decision makers as pertains to seeking health-care service.
Sampling. The main point of patients’ entry into AKUHN are the Accident and Emergency, Casualty, Con-sulting Clinics and support departments such as Radiology, Pathology, Pharmacy and Physiotherapy. The popu-lation was divided into non-overlapping clusters dependent on point of entry and services sought. The number of respondents sampled in each cluster was proportional to the size of each cluster which was calculated from cen-sus data from the hospital records. Three days in a week in the month of April and June were purposively se-lected in order to capture respondent during peak times.
Sample size. A sample size of 288 respondents was required considering a significance level of 5%, power of 80% and intra class correlation coefficient (ICC) of 50%. The research assistants randomly select respondents without bias of gender, age, education level or race. Ultimately, a random sample of 251 respondents was ob-tained resulting to 87% response rate. About half of the participants who are not included in the survey, decided to post their responses later while the rest did not fill in enough responses to meet the threshold of a complete and valid questionnaire.
3.3. Measures and Tools
Measures. The items selected for the constructs were mainly adapted from prior studies to ensure content valid-ity. Three items were used to measure service quality and were adapted from “measuring customer-based brand equity” by Lassar, Mittal [19]. Four items for the trust construct were adapted from “trust and TAM in online shopping: An integrated model” by Gefen, Karahanna [20]. Three items to measure customer satisfaction were adapted from “web customer satisfaction” by Wang, Wang [21]. Items for the loyalty were taken from the vali-dated inventory “the chain of effects from brand trust and brand affect to brand performance” by Chaudhuri and Holbrook [22] and modified to fit the healthcare context.
Accord-OALibJ | DOI:10.4236/oalib.1101213 6 April 2015 | Volume 2 | e1213 ing to the need of each research constructs and hypotheses, Predictive Analytics Software (PASW) version 17.0.1 was used to label, clean and analyse data while Analysis of Moment Structures (AMOS) version 17.0.2 was used for model fitting.
3.4. Analytical Strategy: Exploratory Data Analysis and Model Building
Exploratory data analysis. Prior to any data analysis, exploratory data analysis is mandatory. The data was sub-jected to descriptive screening in order to check for completeness (not missing at random), by identifying out-liers and influential statistics using Mahalanobis distance. The tests for normality, linearity, multi-colinearity, reliability and validity were performed in-order to eliminate the blame of non-conformance with normalised and good quality data for extra analysis. The clean and analysed data was exported to AMOS engine for model building and fitting. The data was then subjected to extraneous regression analysis to either accept or fail to ac-cept the posited hypothesis within the set criteria.
Model building. Structural Equation Model (SEM) are used in a deductive mode to fit the formative construct, to calculate the unmeasured sources of variability responsible for the commonality among a set of scores and to verify the factor structure of a set of observed variables. SEM helps the researcher to use the knowledge of the theory, empirical research, or both, to postulate the relationship pattern a priori and then tests the hypotheses sta-tistically. Unlike the more traditional multivariate linear model, the response variable in one regression equation in SEM may appear as a predictor in another equation. These structural equations are meant to represent causal relationships among the variables in the model.
It is common practice to display SEM as path diagrams where squares represent observed variables and cir-cles represent the latent/unobserved variables (common factors of the observed variables). Factor loadings rep-resented by λij are the effects (regression slope) of latent variable j on the observed variable i. The squared factor loading λij2; referred to as a communality represents the proportion of variance in the ith
ob-served variable that is explained by the jth latent variable. The circles labelled δi represent unique factors
because they affect only a single observed variable. The δi incorporates all the variance in each xi, such as
measurement error, which is not captured by the common factors. When observed and latent variables are mean-cantered to have deviations from their means, the confirmatory factor model can be summarized by the equation;
Λ
ξ = Χ +δ
(1)
where ξ is the vector of common factors
( )
ξi , X is the vector of observed variables,( )
xi , Λ is the matrixof factor loadings
( )
λij connecting the ξj to xi and δ is the vector of unique factors. It is assumed that the error terms have a mean of zero, E( )
δ =0, and that the common and unique factors are uncorrelated,( )
0E ξδ′ = . The general formative equation 1 can be rewritten after decomposition as Equation (2) below,
(
,)
, 1
n
i j i j j i j= λ x +δ =ξ
∑
(2)
A very crucial step in SEM is determining whether the specified model is identified. If the number of the un-known parameters to be estimated is smaller than the number of pieces of information provided, the model is under-identified. A model is identified if all of the unknown parameters can be rewritten in terms of the vari-ances and co-varivari-ances of the x variables. Lack of introducing some constraints in any structural equation model renders it to be unidentified. This is brought about by the fact that the latent variables are unobserved and hence their scales are unknown. This model was constrained by setting the variance of the latent variable to one as conventionally agreed.
OALibJ | DOI:10.4236/oalib.1101213 7 April 2015 | Volume 2 | e1213
4. Results
Demographic Profiling, Exploratory Analysis, SEM and Hypothesis Testing Results
Demographic profiling. The data results indicate that, the respondents were on a 54:46 male to female gender split. About 45% of the respondents met their own bills while the rest were covered by the insurance companies. The respondents comprised of 24% paediatric (0 - 15 years) cases, 44% between the ages 16 to 40 years and 32% who were aged 41 years and above. Majority, 55% of the respondents had visited the facility to seek medical in-tervention at the casualty while 22% were seeking appointment either afresh or attending a previous one, about 14% had gone to seek support services whereas only 8% were on emergencies cases. Two in every ten patients preferred the facility owing to its accessibility and location while other reasons such as doctor of choice and recommendations by family members were preferred by one in every ten patients.
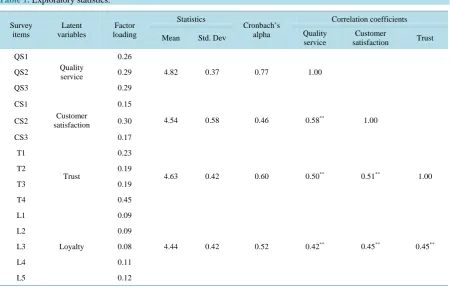
Exploratory analysis. The data screening indicated that no data was missing at random, absence of influential statistics, conformance to linearity and normality tests and no multi-collinearity between variables. The data was reliable as per the Cronbach’s Alpha and the correlation coefficients were all significant at α = 0.01 as can be seen on Table 1.
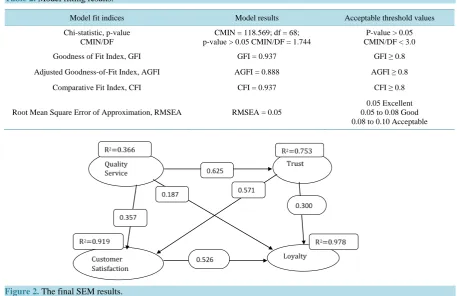
SEM results. The Table 2 shows goodness-of-fit statistics for the fully identified model depicted alongside the conventional criteria for the cut-off points. The fit statistics are far above the rule of thumb cut-off criteria depicting an excellent model.
[image:7.595.88.539.421.708.2]The results of the final model as illustrated in Figure 2 suggests that, quality service will have more casual effect on trust (22%) than on satisfied (13%) or loyal customers (7%), implying that a customer will first de-velop trust on quality product/service prior to being satisfied or loyal to it. Additionally, trust will have a causal effect of almost half (43%) on customer satisfaction unlike almost a quarter on loyalty (23%). This implies that after customers consumes/receives quality products/services, they develop trust on them and becomes satisfied prior to being loyal. Ultimately, customer satisfaction will have double causal effect of 48 percent on loyalty unlike on trust. The cause and effect path of this model therefore suggests that a customer who receives/con- sumes quality product/service develops trust first, then becomes satisfied and eventually develops loyalty to the
Table 1. Exploratory statistics.
Survey items Latent variables Factor loading Statistics Cronbach’s alpha Correlation coefficients
Mean Std. Dev Quality
service
Customer
satisfaction Trust
QS1
Quality service
0.26
4.82 0.37 0.77 1.00
QS2 0.29
QS3 0.29
CS1
Customer satisfaction
0.15
4.54 0.58 0.46 0.58** 1.00
CS2 0.30
CS3 0.17
T1
Trust
0.23
4.63 0.42 0.60 0.50** 0.51** 1.00
T2 0.19
T3 0.19
T4 0.45
L1
Loyalty
0.09
4.44 0.42 0.52 0.42** 0.45** 0.45**
L2 0.09
L3 0.08
L4 0.11
L5 0.12
OALibJ | DOI:10.4236/oalib.1101213 8 April 2015 | Volume 2 | e1213
Table 2. Model fitting results.
Model fit indices Model results Acceptable threshold values
Chi-statistic, p-value CMIN/DF
CMIN = 118.569; df = 68; p-value > 0.05 CMIN/DF = 1.744
P-value > 0.05 CMIN/DF < 3.0
Goodness of Fit Index, GFI GFI = 0.937 GFI ≥ 0.8
Adjusted Goodness-of-Fit Index, AGFI AGFI = 0.888 AGFI ≥ 0.8
Comparative Fit Index, CFI CFI = 0.937 CFI ≥ 0.8
Root Mean Square Error of Approximation, RMSEA RMSEA = 0.05
[image:8.595.82.540.92.388.2]0.05 Excellent 0.05 to 0.08 Good 0.08 to 0.10 Acceptable
Figure 2. The final SEM results.
product/services.
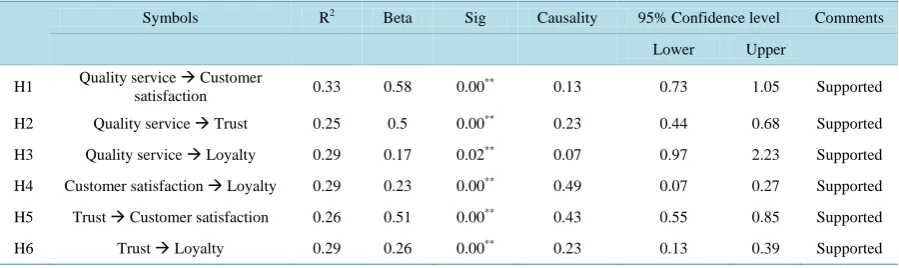
Hypothesis testing results. The hypothesized relationships were tested using the multiple regression analysis. For each hypothesis different response variable was used and the resulting predictive fit models examined. In all the situations, the resulting Analysis of Variance table had significant p-value = 0.000 and hence we failed to reject the null hypothesis that the null model fits the regression model. As shown on the Table 3, all the posited hypothesis were supported. Since the model has “fit” the data and all the posited hypothesis supported, the theo-retical framework has been empirically verified and tested to suit a healthcare environment.
5. Discussion
The purpose of this study was to examine the cause and effect between quality service, trust, customer satisfac-tion and loyalty in a healthcare environment. The results have shown the strength of causal relasatisfac-tionships be-tween quality service and customer loyalty through customer satisfaction and trust as mediating variables. Al-though the effectiveness of this model needs to be monitored over time, it is apparent that customer satisfaction has strongest influence on customer developing loyalty. As suggested by our conceptual model, proper man-agement of customer satisfaction, trust and quality service should lead to patients developing loyalty. Thus, management attention might more fruitfully focus on the “development” of these internal psychological proc-esses. Accordingly, in order to increase the patients’ loyalty, it is important for healthcare facilities loyalty managers to make their service a trustful and satisfying brand towards which consumers will have an overall favourable disposition. Previous research Wang, Wang [21] has shown that such factors as ease of use, informa-tion content, innovainforma-tion, security protecinforma-tion, customer support, product/service itself, and transacinforma-tion process will influence customer satisfaction. Thus, creating and maintaining customer satisfaction through its antece-dents is an appropriate and necessary strategy for developing customer satisfaction.
OALibJ | DOI:10.4236/oalib.1101213 9 April 2015 | Volume 2 | e1213
Table 3. Hypothesis testing results.
Symbols R2 Beta Sig Causality 95% Confidence level Comments
Lower Upper
H1 Quality service Customer
satisfaction 0.33 0.58 0.00
** 0.13 0.73 1.05 Supported
H2 Quality service Trust 0.25 0.5 0.00** 0.23 0.44 0.68 Supported
H3 Quality service Loyalty 0.29 0.17 0.02** 0.07 0.97 2.23 Supported
H4 Customer satisfaction Loyalty 0.29 0.23 0.00** 0.49 0.07 0.27 Supported
H5 Trust Customer satisfaction 0.26 0.51 0.00** 0.43 0.55 0.85 Supported
H6 Trust Loyalty 0.29 0.26 0.00** 0.23 0.13 0.39 Supported
**
P < 0.05.
Another prime objective of this study was to examine service quality in the context of multi-variables. The items which explain a lot of variance in the formation service quality as a latent variable could be help any healthcare facility in identifying the characteristics of interest that are considered important by patients. Quality service as discussed in the literature review remains quite a contentious element because none is tangible. It can only be metricized by allowing multifaceted attributes which would be linked to it. Based on the correlation co-efficients of the variables used to measure it, there exists significant strong relationship (Rho > 0.8, P < 0.05) and therefore these variables are deemed fit to measure quality of service. Although many literatures have pointed out “service quality” as providing a significantly strong positive influence on “customer loyalty” and “customer satisfaction”, the results of this research are low despite having a significant influence. This could be attributed to study limitations owing to the context of this study purpose.
Trust has shown strong influence on customer satisfaction and loyalty implying that it acts as a mediating variable between quality service and loyalty. These findings therefore suggest that it is not only enough to de-velop customer satisfaction in order to create repurchase behaviour but also a necessary and sufficient condition that the customers’ builds trust with the providers’ products/services. These finding also supports the prior re-searchers’ suggestion that trusting beliefs directly influence trusting intentions for example repeat purchase in-tentions [28].
All the posited hypotheses were empirically tested and supported within the criterion region. The adapted model from social, business and educational contexts has “fit” the data well and hence can be utilized in a healthcare context. The researcher would wish to take this research further by encompassing more healthcare fa-cilities and also examine the mediating effects of trust and customer satisfaction on quality of service and cus-tomer loyalty using Dawson’s interaction plots.
6. Conclusions
This study has empirically validated an existing quality service, customer satisfaction, trust and loyalty model boldly used in social, business and educational environment in a healthcare environment. Quality service forms the backbone of this model and cannot work in isolation of customer satisfaction and trust to develop purchase loyalty. These results suggest that quality service, trust and customer satisfaction are separate constructs and their combination determines the customer loyalty. However the causal effect of quality service on loyalty is elevated when other mediating variables are in place. The customer satisfaction is of the most importance fol-lowed by trust in building the customer loyalty.
OALibJ | DOI:10.4236/oalib.1101213 10 April 2015 | Volume 2 | e1213 service. If the companies want to create loyal customers, they are primarily required to help them solve their problems quickly and easily where making it easy here means eradicating the hindrances.
References
[1] Anderson, E.W., Fornell, C. and Lehman, R. (1994) Customer Satisfaction, Market Share, and Profitability: Findings
from Sweden. Journal of Marketing, 58, 53-66. http://dx.doi.org/10.2307/1252310
[2] Aaker, D.A. (1991)Managing Brand Equity: Capitalizing on the Value of a Brand Name. The Free Press, New York.
[3] Howard, J.A. and Sheth, J.N. (1969) The Theory of Buyer Behaviour. John Wiley and Sons, Inc., London.
[4] Williamson, O.E. (1988) Corporate Finance and Corporate Governance. Journal of Finance, 63, 567-591.
http://dx.doi.org/10.1111/j.1540-6261.1988.tb04592.x
[5] Morgan, R.M. and Hunt, S.D. (1994) The Commitment-Trust Theory of Relationship Marketing.Journal of Marketing,
58, 20-38. http://dx.doi.org/10.2307/1252308
[6] Peters, T.J. and Waterman, R.H.J. (1995) In Search of Excellence: Lessons from America’s Best Run Companies.
Harper Collins Publishers, New York.
[7] Juran, J.M. and Gryna, F.M. (1988)Juran’s Quality Control Handbook. 4th Edition, McGraw-Hill, New York.
[8] Crosby, P.B. (1979) Quality Is Free: The Art of Making Quality Certain. McGraw-Hill, New York.
[9] Parasuraman, A.Z. (2005) E-S-QUAL, a Multiple-Item Scale for Assessing Electronic Service Quality. Journal of
Ser-vice Research, 7, 213-233. http://dx.doi.org/10.1177/1094670504271156
[10] Zeithaml, V.A. and Bitner, M.J. (1996)Services Marketing. McGraw-Hill, New York.
[11] Zeithaml, V.A. and Bitner, M.J. (2000) Services Marketing: Integrating Customer Focus across the Firm. 2nd Edition,
McGraw-Hill, Boston.
[12] Asuncion, J.V., Fichten, C.S., Barile, M., Fossey, M.E. and Robillard, C. (2004) Access to Information and
Instruc-tional Technologies in Higher Education II: Practical Recommendations for Disability Service Providers. Journal of
Post-Secondary Education and Disability, 17, 134-137.
[13] Zairi, M. (2000) Managing Customer Dissatisfaction through Effective Complaint Management Systems. The TQM
Magazine, 12, 331-335. http://dx.doi.org/10.1108/09544780010341932
[14] Shankar, V., Urban, G.L. and Fareena, S. (2002) Online Trust: A Stakeholder Perspective, Concepts, Implications and
Future Directions. TheJournal of Strategic Information Systems, 11, 325-344.
http://dx.doi.org/10.1016/S0963-8687(02)00022-7
[15] Mayer, R.C., Davis, J.H. and Schoorman, F.D. (1995) An Integrative Model of Organizational Trust. The Academy of
Management Review, 20, 709-734. http://dx.doi.org/10.2307/258792
[16] McAllister, D.J. (1995) Affect- and Cognition-Based Trust as Foundations for Interpersonal Cooperation in
Organiza-tions. Academy of Management Journal, 38, 24-59. http://dx.doi.org/10.2307/256727
[17] Oliver, R.L. (1999) Whence Consumer Loyalty? Journal of Marketing, 63, 33-44.
http://dx.doi.org/10.2307/1252099
[18] Bromley, D.B. (1991) Academic Contributions to Psychological Counselling: Discourse Analysis and the Formulation
of Case-Reports. Counselling Psychology Quarterly, 4, 75-89. http://dx.doi.org/10.1080/09515079108254431
[19] Lassar, W., Mittal, B. and Sharma, A. (1995) Measuring Customer-Based Brand Equity. Journal of Consumer
Market-ing, 12, 11-19. http://dx.doi.org/10.1108/07363769510095270
[20] Gefen, D., Karahanna, E. and Straub, D.W. (2003) Trust and TAM in Online Shopping: An Integrated Model. MIS
Quarterly, 27, 51-90.
[21] Wang, Y.S., Tang, T. and Eddie Tang, J.-T. (2001) An Instrument for Measuring Customer Satisfaction towards
Web-sites That Market Digital Products and Services. Journal of Electronic Commerce Research, 2, 89-102.
[22] Chaudhuri, A. and Holbrook, M.B. (2001) The Chain of Effects from Brand Trust and Brand Affect to Brand
Per-formance: The Role of Brand Loyalty. Journal of Marketing, 65, 81-93.
http://dx.doi.org/10.1509/jmkg.65.2.81.18255
[23] Hu, L. and Bentler, P.M. (1999) Cutoff Criteria for Fit Indexes in Covariance Structure Analysis: Conventional Criteria
versus New Alternatives. Structural Equation Modeling: A Multidisciplinary Journal, 6, 1-55.
http://dx.doi.org/10.1080/10705519909540118
[24] Bansal, H.S. and Taylor, S. (1997) Investigating the Relationship between Service Quality, Satisfaction and Switching
Intentions. In: Wilson, E.J. and Hair, J.C., Eds., Developments in Marketing Science, Academy of Marketing Science,
OALibJ | DOI:10.4236/oalib.1101213 11 April 2015 | Volume 2 | e1213
[25] Anderson, E.W. and Sullivan, M.W. (1993) The Antecedents and Consequences of Customer Satisfaction for Firms.
Marketing Science, 12, 125-143. http://dx.doi.org/10.1287/mksc.12.2.125
[26] Parasuraman, A.Z. and Berry, L.L. (1988) SERVQUAL: A Multi-Item Scale for Measuring Consumer Perceptions of
Service Quality. Journal of Retailing, 64, 12-40.
[27] Gottlieb, B.H., Grewal, D. and Brown, S.W. (1994) Consumer Satisfaction and Perceived Quality: Complementary or
Divergent Construct? Journal of Applied Psychology, 79, 875-885. http://dx.doi.org/10.1037/0021-9010.79.6.875
[28] McKnight, D.H., Chervany, N.L. and Cummings, L.L. (1998) Initial Trust Formation in New Organizational