2019 International Conference on Computer Science, Communications and Multimedia Engineering (CSCME 2019) ISBN: 978-1-60595-650-3
A LBS Supported Mining System for Self-Help Tourism—A Chinese
Case Study
Qiu-hua HUANG
Department of City and Environment Science, City College of Dongguan University of Technology, 523106, China
Keywords: LBS, Self-Help tourism, Trajectory, Spatial-Temporal behavior.
Abstract. This paper analyses the mobile positioning data used in researching self-help tourism. Mobile positioning data which is stored in the memory files of mobile device with GPS positioning function are as follows: the location, date, total time and etc. From this paper we can find that mobile positioning data has meaningful applications for the development of tourism. This paper proposed models to calculate the experience value of tourist and the attraction index of trajectory. The results illustrate that location data has virtues: lacation data can be collected conveniently; the precision of which is higher than traditional statistics.
Introduction
Self-help tourism is of growing importance for the global economy, since positioning technology has risen quickly during recent decades. In operationalizing tourism flows, a majority of the research emphasizes the visitors’ behavior, as well as their impacts on the physical environment around them in recent decades[1]. The rapid development of the information and communication technologies (ICT) such as digital databases and geographical information science (GIS), which are advancing surveying methods in self-help tourism studies. The GIS have lots of applications in tourism studies[2-5]. There is a hot subject which connecting with mobile (cellular) phone positioning datasets and location-based services (LBS) [6]. Mobile positioning data becomes more and more important in the studies of spatial-temporal behavior. In the field of tourism scholarship very few experts studied the mapping and modeling of tourist movements[7-8]. There are some studies about the spatial effects of differences in attraction site visits [7,9] , but very few about the characteristics of travel behavior of self-help tourist.
The objective of this paper is to study the characteristics of the travel behavior of self-help tourist. In this study self-help tour were divided into seven kinds, e.g. self-driving tourism, mountaineering, mountain biking, hiking, high way biking, sightseeing and others, among them mountaineering and hiking accounted for the largest proportion. In this paper the trajectories were divided into four typologies based on their shapes, e.g. (T1) Echoing Trajectory; (T2) Branch Trajectory; (T3) Closed Trajectory; and (T4) Combination Trajectory, among them Echoing Trajectory is the most common type, which accounted for 52.6% of the total. At last, this paper proposed models to calculate the experience value of tourist and the attraction index of trajectory. Travel enthusiastic can choose the most popular track with the shortest time using trajectory’s attraction index. There are a huge amount of self-help tourism trajectories available on the web portals, which can be used in the studies of the characteristics of self-help tourists’ space-time behavior.
Data and Methods
Data
Methods
The trajectories achieved from mobile positioning devices have some features, for example the low cost and the high precision than traditional methods. The tourists flows have been studied by some experts in some specific environments, for example island environments[7],urban locations[9], heritage attractions[10] and crowded environments[11]. Nevertheless, there are very few studies about the mapping and modeling of self-help tourist movements, and the spatial-temporal behavior of self-help tourist. The data acquisition method of mobile postioning have become mature, but there are still a lot of people who wouldn't wear a locator for privacy reasons. From the web portal[14] we can get some trajectories of self-help tourism, which were caught by mobile positioning.
Locaiton data can be analyzed using many different methods of spatial-temporal behavior analysis[12-13]. Unfortunately, the self-help tourism trajectories only have a few features for each trajectory: date of start of trajectory, province city where trajectory start, self-help tourism typology what the trajectory belong to, the total length of the trajectory, trajectory’s total time, the self-help tourist ID of the trajectory which allows recognition of the same tourist of different trajectories, Latitude and longitude of the track regional center, the shape of the trajectory and the degree of difficulty of the trajectory. In this study, we use the following software: ArcGIS 10.0, Microsoft Excel, and Spss 12.0.
Results
In this study there are 445 trajectories, which were obtained by 162 self-help tourists (user IDs) from China during August 1, 2010 to July 31, 2011.
The Movement Patterns of Backpackers
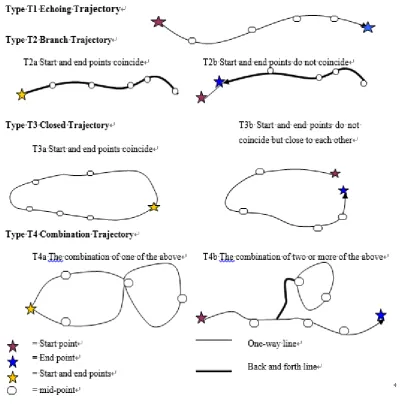
From the data we can see that, every trajectory taken by a backpacker has linear path characteristic. Every trajectory is connected by a starting point, a number of mid-points and an end point. Some experts divided the linear itinerary into four patterns, they are as follows: (a) a circle tour; (b) a single destination and return trip; (c) multiple stop circle tour; and (d) a complex combination[15]. In this paper the trajectories were divided into four movement patterns based on their shapes in Fig.1. They are (T1) Echoing Trajectory; (T2) Branch Trajectory; (T3) Closed Trajectory; and (T4) Combination Trajectory.
Type T1: Echoing Trajectory. This pattern is unique for backpackers to travel from a start to a destination. About this pattern one or more attractions can be visited by backpackers before they arrive in the destination. This pattern is the most common for a short time travel, because there’s no limitation of the terrain and it’s relatively easy to perform. Some experts studied this pattern in the automobile tourists at regional Australian destinations[16].
Figure 1. Backpackers’ movement patterns.
Type T3: Closed Trajectory. This movement pattern starts and ends at the same or near point, and includes a set of attractions in a circular route. This may be the best efficient movement pattern considering the attractions visited and the transportation network established. It is the most widely used pattern often[15]. Although backpackers like to choose this movement pattern, it is limited by the terrain and the travel time is difficult to be estimated in this pattern.
Type T4: Combination Trajectory. This pattern could be a combination of one or several of the Echoing Trajectory, Branch Trajectory and Closed Trajectory. Personality style may influence this movement pattern, for example backpackers who eschew large environmental bubbles might have a higher tendency to wander. These trajectories are flexible, opportunistic, and process oriented. While on the surface the trajectories may seem chaotic, there may be an underlying logic to their movements[15].
In this study the number of each pattern is shown in table 1. These data illustrates that Echoing Trajectory is the most common type, which occupied 52.6% of the total; then is the Closed Trajectory, which occupied 21% of the total.
pattern. Backpackers like the Echoing Trajectory pattern in sightseeing and self-driving tour because of the relative larger freedom.
Table 1. The distribution of the four movement patterns in each backpacker taxonomy.
Movement
pattern total mountaineering % hiking %
mountain biking %
high way
biking % sightseeing %
self-driving tour %
T1 234 63.1 61.2 38.5 31.0 37.1 46.4
T2 50 8.8 5.8 9.2 28.6 17.1 14.3
T3 94 20.6 16.5 35.4 19.0 17.1 14.3
T4 67 7.5 16.5 16.9 21.4 28.6 25.0
Calculation of Trajectory Attraction Index
Calculate the Experience Value of Tourist. In this study there are 445 trajectories, which were obtained by 162 self-help tourists (user IDs) from China during August 1, 2010 to July 31, 2011, the number of per capita trajectories is 2.74. This paper only studies the tourist whose trajectory’s number is greater than or equal to 3, after counting find that 52 tourists meet the requirements. The following four independent variables will be used to calculate the experience value of tourists, e.g. the number of trajectories of tourist a (NTr (a), 1≤a≤52), the number of provinces and cities of tourist a (NPc (a), 1≤a≤52), the total travel time of tourist a (Tt (a), 1≤a≤52), the number of travel types of tourist a (NTy (a), 1≤a≤52). Among them the NTr (a), Tt (a) and NTy (a) are calculated directly from the data attribute table, yet NPc (a) is calculated by that the different provinces incremented by 1 and the different cities in the same province incremented by 0.5. The experience value of tourist a ( Ev(a), 1≤a≤52) is calculated by the following formula:
1 2 3 4
( ) [ *ln( ( )) *ln( ( )) * ( ) * ( )]/
Ev a w NTr a w Tt a w NTy a w NPc a n (1)
In this formulaw1,w2 w3 and w4 are the weights of each variable, in this article they are taken as 0.5, 0.2, 0.2 and 0.1 according to their degree of influence on the dependent variable Ev(a), and
1 2 3 4 1
w w w w ; n is the number of independent variables, which equals to 4.
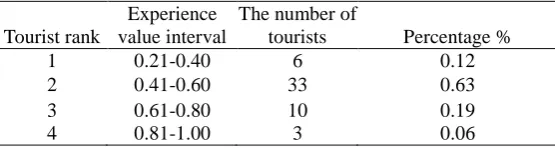
In this study tourists are divided into 4 ranks, when Ev (a) is between [0.21, 0.40] belonging to rank 1, between [0.41, 0.60] belonging to rank 2, between [0.61, 0.80] belonging to rank 3, and between [0.8.1, 1.00] belonging to rank 4.The distribution of tourist experience value calculated using formula (1) is shown in Table 7. There are only 6% tourists belonging to the highest rank, and the most tourists belong to rank 2 accounted for 63%. These data indicates that there is still much more room for the development of self-help tourism.
Table 2. The distribution of the experience values of the tourists.
Tourist rank
Experience value interval
The number of
tourists Percentage % 1 0.21-0.40 6 0.12 2 0.41-0.60 33 0.63 3 0.61-0.80 10 0.19 4 0.81-1.00 3 0.06
Calculate the Trajectory Attraction Index (TAI). As more and more people upload their travel trajectories to the site, there are many similar trajectories, which caused the trajectories redundant. For example a tourist wants to mountaineer in Mentougou District of Beijing, but he doesn’t know the travel itinerary, then he downloads 19 mountaineering trajectories in Mentougou District of Beijing from the website. Generally travel enthusiastic wants to choose the most popular track with the shortest possible time, rather than observe one by one. If people know the attraction index of each trajectory, people can choose the most popular trajectory based on it. The attraction index is higher, the trajectory is more popular.
[image:4.595.159.437.583.657.2]trajectory’s tourist. Let’s encode the 19 trajectories as 1 to 19, Sim (i, j) represents the similarity between trajectory i and trajectory j, Li represents the length of trajectory i, Lj represents the length of trajectory j, L (i, j) represents the length of the overlap between trajectory i and trajectory j. The formula is as follows:
( , ) ( , )
( , ) L i j Sim i j
Li Lj L i j
(1≤i, j≤19, 0≤Sim (i, j) ≤1) (2) SSim (i) represents the similarity of trajectory i, SSim (i) is calculated by the following formula:
1
( ) ( , )
n
j
SSim i Sim i j
(1≤i, j≤19, n=19) (3)TAI (i) represents the interest degree value of trajectory i, which is calculated by formula (4), ai represents the tourist of trajectory i.
( ) ( )* ( )i
TAI i SSim i EV a (1≤i, j≤19) (4)
Conclusion
In this paper the trajectories were divided into four typologies based on their shapes, e.g. (T1) Echoing Trajectory; (T2) Branch Trajectory; (T3) Closed Trajectory; and (T4) Combination Trajectory, among them Echoing Trajectory is the most common type, which accounted for 52.6% of the total. At last, this paper proposed models to calculate the experience value of tourist and to calculate the trajectory attraction index. Travel enthusiastic can choose the most popular track with the shortest time using the attraction index.
Acknowledgements
This study received support from Dongguan social science and technology development project(2019507151565).
References
[1] Ahas, R., Aasa, A., Roose, A., Mark, U., & Silm, S. (2008). Evaluating passive mobile positioning data for tourism surveys: An Estonian case study. Tourism Management, 29, 469–486.
[2] Buhalis, D., & Licata, M. C. (2002). The future eTourism intermediaries. Tourism Management, 23(3), 207–220.
[3] Frihida, A., Marceau, D. J., & Theriault, M. (2004). Development of a temporal extension to query travel behaviour time paths using an object-oriented GIS. GeoInformatica, 8(3), 211–235.
[4] Lew, A., & McKercher, B. (2006). Modeling tourist movements. A local destination analysis. Annals of Tourism Research, 33(2), 403–423.
[5] Huang Q, Xia L. Inspection of Spatial–Temporal Behavior of Backpackers in Beijing Based on Trajectory[J]. Wireless Personal Communications, 2015, 9: 1-20.
[6] Ahas, R., & Mark, U. (2005). Location based services—New challenges for planning and public administration? Futures, 37(6), 547–561.
[7] Fennell, D. 1996 A Tourist Space-time Budget in the Shetland Islands. Annals of Tourism Research 23:811–829.
[9] Debbage, K. 1991 Spatial Behavior in a Bahamian Resort. Annals of Tourism Research:18251–18268.
[10] Beeho, A. J., & Prentice, R. C. (1995). Evaluating the experiences and benefits gained by tourists visiting a socio-industrial heritage museum: An application of ASEB grid analysis to Blists Hill Open-Air Museum, The Ironbridge Gorge Museum, United Kingdom. Museum Management and Curatorship, 14(3), 229–251.
[11] Graefe, A. R., & Vaske, J. J. (1987). A framework for managing quality in the tourist experience. Annals of Tourism Research, 14, 390–404.
[12] Hagerstrand, T. (1968). Innovation diffusion as spatial process. Chicago: University of Chicago Press.
[13] Kwan, M. P. (2000). Interactive geovisualization of activity-travel patterns using three-dimensional geographical information systems: Methodological exploration with a large data set. Transportation Research C, 8, 185–203.
[14] http://www.foooooot.com/
[15] Alan Lew, Bob McKercher (2006). Modeling tourist movements: A local destination analysis. Annals of Tourism Research, 33(2): 403-423.