Conference proceedings 2007
SPARC,
Title Conference proceedings 2007
Authors SPARC,
Type Conference or Workshop Item
URL This version is available at: http://usir.salford.ac.uk/15914/
Published Date 2007
USIR is a digital collection of the research output of the University of Salford. Where copyright permits, full text material held in the repository is made freely available online and can be read, downloaded and copied for noncommercial private study or research purposes. Please check the manuscript for any further copyright restrictions.
SPARC 2007
Proceedings of the Salford Postgraduate Annual Research
Conference
Table of Contents
Preface i
Dr Jocelyn AJ Evans
User Experience: Summary Judgments and Momentary Emotions 1
Mahmood S. Alalawi
Public-Private Partnership (PPP) Projects in Malaysian Tolled Highways – 18 An Insight Using a Political Economy Approach
Ervina Alfan
A study about the Role of the Internet Digital Arts’ works in Formulating a New 33 Communication Models in the Internet
Amani Alhalwachi
Women Leaders in Bahraini Organisations 47
Maha Al-Rashid
The Cultural Objecthood of Digital Games: The translation 64
of Commercial Games into Educational Contexts
Daniel Ashton
Work Narratives and Boundaries Management of Family and Work Life 68
Stefano Ba’
The Effect of Visual Images on Patients through Films or Multi-Media 75
Eunice Chan
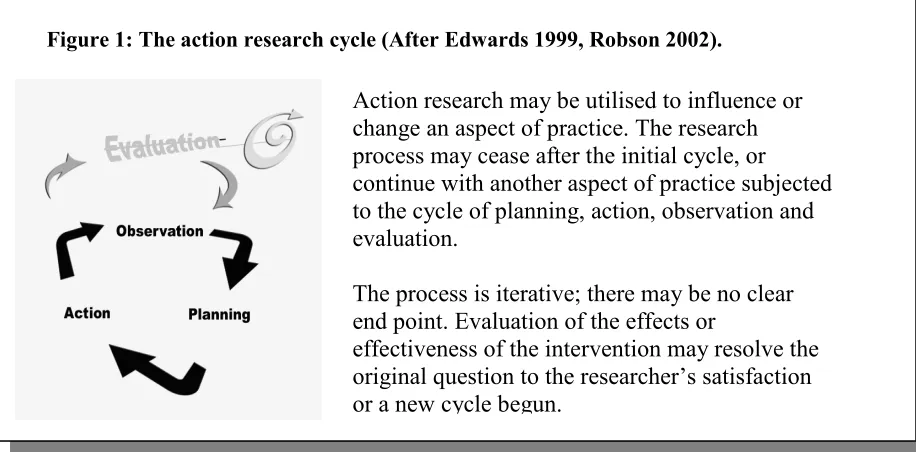
Multiple Uses of Digital Video in Action Research in Physiotherapy: 79 An Objective Record of Movement, an Interview Tool and Part of Therapy
Iain M. Cole and Helen L. Leathard
Low Income Consumers’ Reactions to Sales Promotion 87
Stimuli of Low Involvement Products: An Exploratory Perspective
Ayantunji Gbadamosi
Views from Down the Rabbit Hole 104
Denise Gurney
Experimental and Numerical Study of Composite Material Subjected to 118
Low Velocity Impact
P. R. Hampson and M. Moatamedi
The Media in Mexico: Does it Favour a Democratic Public Sphere? 132
Felipe Carlos Betancourt Higareda
Medication Error Reporting: A Review of Nurses’ Perceptions 141
An Institutional model for diffusion and implementation of Innovation 159 in Construction Industry: Case Study of CCI
A. T. Ilter
The Institutional Development of Alternative Dispute Resolution 169
Methods in the UK Construction Industry
Deniz Ilter
Facilitating Long Distance Relationships between Malaysian Grandparents and 180 Grandchildren Living in the UK through Computer Mediated Communication
Nazean Jomhari, Sri Hastuti Kurniawan
The Impact of Cultural Experiences on British Chinese Artists’ 190
Relationships with the Natural World and Spirituality
Panni Poh Yoke Loh
Using Personal Development Planning for Career Development 204
with Post-Doctoral Graduates in Sub-Saharan Africa
Hazel McCullough
When a Consumer Chooses a Loan, How Does Information About 213
the Cost of Borrowing Influence Choice?
Sandie McHugh and Rob Ranyard
Virtualised e-infrastructure That Facilitate Collaborative 218
Work among Distributed Communities
Sas Mihindu
Data Collection for Research in Applications of Information Technology 230
T. Mogotlhwane, Prof. F. Khosrowshahi and Dr. J. Underwood
Industrialising the Construction Industry-A Collaborative 238
Training and Education Model: Research Methodology
Wafaa Nadim and Jack Goulding
Merging Sexes: Gender Differences in Work-Family Conflict Considering 261 Time Pressure and Structural Working Conditions
Eduardo Infante Rejano
A Fuzzy Logic Approach to Property Searching in a Property Database 270
J. Slaby and D. Eaton
The Madness of Love in Edmund Spenser’s Amoretti 277
Frank Swannack
Higher College Students’ Perception of Vocational Education and Training Programmes in Libya
Preface
Jocelyn AJ Evans
Director of Graduate Studies, University of Salford
As part of the first Salford Postgraduate Annual Research Conference (SPARC) to welcome participants from universities in the North-West, it gives me particular pleasure to introduce these 2007 proceedings. In previous years, SPARC has offered a stimulating and congenial setting for its postgraduate researchers to experience conference paper and poster presentation, and receive feedback from their peers and from Salford academics. Whilst it clearly succeeded in these respects, we felt that there was an opportunity to include a broader cohort of students from institutions in the region, to bring together researchers working in related areas, thereby enhancing both the academic but also the social experience of the event.
The 2007 conference has been a great success in this regard. With as many external participants as Salford postgraduates presenting papers and posters, and the panels providing an intellectually coherent but institutionally diverse mix, the conference enjoyed an unprecedented level of attendance and, as is clear from the papers in this collection, a similarly outstanding level of academic achievement in the doctoral research presented. We fully expect that, whatever innovations we introduce in future years, the open nature of the conference will be retained, and hope that the balance of Salford / North-West remains.
Whither SPARC, then? Next year’s conference will pose its own individual challenge. Effective as it has been to turn SPARC into a regional rather than an institutional event, there is still greater openness to be achieved in making the conference more accessible to those researchers who, for a variety of reasons, are unable to attend in person. To that end, 2008 will pilot – on an initially modest scale – virtual paper presentation via the web, to allow researchers unable to attend their panel to give an interactive presentation nonetheless. Inevitably, the success of this venture will depend not so much on the technology itself, but the appropriate use of the technology. Those papers originally presented online will in all likelihood not be identifiable as such in next year’s proceedings – and we will strive to ensure that the virtual nature of their presentation in the conference itself will also be as unnoticeable as possible.
User Experience: Summary Judgments and Momentary
Emotions
Mahmood S. Alalawi
School of Informatics, University of Manchester
Abstract
Website design can have marked effects on the users’ experience. Consequently, empirical evaluation of websites is an important part of the design process. Increasingly such evaluations consider subjective aspects of user experience such as satisfaction. Standard evaluation methodology would allow users to interact with the website (perhaps using a fixed set of tasks) and subsequently report their satisfaction, or other responses. However, recent work in experimental psychology has shown that retrospective summary evaluations are biased in interesting ways, compared with-moment-by-moment-experiences.
In particular, retrospective evaluations are influenced by the order of moment-by- moment experiences as well as their total or average intensity. Thus, when exposed to a sequence of aversive sounds, people will prefer a sequence that gets progressively less unpleasant rather than the reverse, even if the total unpleasantness they experience is the same in both cases. This study investigated whether such order effects retrospective judgments of satisfaction with a website. If so, then evaluators would need to pay careful attention to the order of tasks used in evaluation studies.
Twenty participants each performed seven search tasks using the University of Manchester, School of Informatics website. The order of the tasks was varied. For half the participants it went from hardest to easiest; for the other half it was the reverse. Before participants began each task, they had to register the time they expected it to take. Immediately after completing each task the participants rated how satisfied they were with the task. At least two days after the experiment, a second questionnaire about the overall satisfaction of the experience was e-mailed to the participants.
The main hypothesis was that the hard to easy (H-E) group would report greater overall summary satisfaction than E-H group. However, and to our surprise the results showed the opposite effect. We will discuss possible reasons for the difference between these findings and the results in the literature. The second hypothesis was that the difference between the predicted time and the actual time of all users would predict the users’ task-by-task satisfaction. The average correlation of time difference found for each task-by-task (expected time-actual time) and all users’ task-by-task satisfaction scores was 0.73 which strongly supports the second hypothesis.
Introduction
tasks on the University of Manchester, School of Informatics website. The usability test conducted provides the problems faced by the participants besides their overall summary judgments as shown in the Results section. In this case, controlled testing of usability is the most suitable method to measure the participants overall Satisfaction\Frustration level.
Many researchers have looked into the summary evaluation of the computer user’s experiences. Summary evaluations of experiences can be described as how people remember a certain event they have previously experienced, (Kampf 2003). It is important to understand participants’ ways of remembering events. For example, in the pilot experiment it was noticed, that several participants were referring to each individual task judgment before making their overall summary judgment of all the tasks. Therefore, in order to collect participants’ overall summary judgments, a second questionnaire was developed, which participants were asked to fill in after a few days to prevent individual task judgments affecting the overall summary judgment, in order to summarize the various parts of the experiment as a whole. Therefore, it is important to understand participants’ way of thinking before the designing or testing phase.
According to Ariely and Carmon (2003) ‘when people form summary assessments of experiences they do not combine the individual components of the experience profiles. Instead, a large number of studies has repeatedly demonstrated that neither the sum (integral) nor to the average of experience profiles, corresponds closely to overall evaluations of their components’ (Ariely and Carmon 2003). As previously mentioned, it had been noticed that during the pilot study, participants linked between the individual components of the experience and the overall summary judgment. Thus, in this experiment there is a relationship between the experience individual components and the overall summary judgment.
Ariely and Carmon (2003) also show that the ‘Increasing pain intensity was perceived as very painful, and decreasing intensity was perceived as not painful, even when the sum of momentary intensities were the same’ (Ariely and Carmon 2003). This proves that increasing pain intensity is more painful than decreasing pain intensity, yet it is still not proved in users’ website experience.
When a user’s satisfaction increases towards the end of the evaluation, the satisfaction of the overall summary increases, however if a user’s satisfaction decreases towards the end of the evaluation period, even if the total individual task satisfaction is equivalent in both cases. This theory outlines the main hypothesis of current study. In addition, the best way to anticipate the user satisfaction is by measuring the difference between the predicted and actual time of the task completion; in effect, the higher the difference between actual and predicted time, the less the task satisfaction and vice versa.
Kampf’s (2003) working paper offered by Professor Payne was the starting point for this research. The questionnaire and the experiments methodology were further modified and used in this piece of work. Kampf shows that there is no significant difference between the two different groups E-H (Easy-Hard task flow) and H-E (Hard-Easy task flow) overall summary judgment, nor the overall design satisfaction. The aim of this study is to replicate the experiment and try to put it in perspective to get positive results.
frustration mean and how people react to them (Kampf 2003). Additional frustration and satisfaction theories will be provided in the literature review section to support the main hypothesis and provide enough background related the main topic of this study.
Furthermore, it is vital to understand the summary evaluations of experiences, why the overall evaluation of the pain and pleasure through different experiences should be considered for making the future decision, and influencing people for further participation or making potential users. This study was performed to evaluate website experiences to gauge how positively or negatively people remember the experience as well as any further user engagement in the same activity (Ariely and Carmon 2003).
Literature Review
A literature review is considered as the ‘building blocks of any theory or model’ (Ghauri and Gronhaug 2005). In this section, five main topics will be presented in relation to summary judgments.
User Experience Evaluation
Since this paper is investigating the user experience of summary judgments and momentary emotions, user experience evaluation was considered as the first building block of the background section. It is important to look at the user experience term to understand different users’ behaviour in a certain experience, further, to realize the effect of positive and negative user experience and how can user experience help to improve website design.
What is a User Experience?
According to Haynes (2002) user experience is defined as ‘the sum of all your users’ interactions with your company, its services, and its products’. The website or application is not the only method for clients to interact with organizations; however, it is an important element to maintain customer relationship management (Haynes 2002). Comparing the previous definition of user experience to the present study, user experience can be defined as the sum of all of participants’ interaction with the University of Manchester, School of Informatics website. As mentioned by Haynes (2002) The University of Manchester website is not the only communication channel between the student or visitors and the institute but it is one of the main communication means between both parties. User experience is also defined by Isomursu et al. (2004) as ‘the total subjective experience of using a device or tool in a situation’ given that the tool used in this experiment is the website of the school of informatics, the user experience in this case is the dynamic relationship between the school of informatics website and the participants (Isomursu et al. 2004).
Laboratory experiments have been used by HCI psychologists to test the user computer interface, evaluate computer usability and improve the level of usability understanding. Laboratory experiment is one of the methods of gathering usability behavioural data. Other ways and techniques used in the HCI field can be summarized as follows (Landauer et al. 1989):
• Observational task analyses
• Involvement of users in redesign
• Prototype and ‘beta’ testing – including participant observer style studies
• Field trials
Like any other method laboratory experiments have advantages and disadvantages. Because of the high level complexity of the HCI experiment studies, in real environments they are difficult and in some cases impossible to implement. Therefore the main advantage of this method is the high degree of convenience and control. At the same time lab studies are not able to capture all the factors that will influence the usability test in the real world (Landauer et al. 1989).Usually when there is a positive user experience, it is expected that users come back to the web site based on which the revenue will increase and an exposure to the business will be given. In contrast, negative user experience will raise the overheads, reduce customer loyalty, lose the word of mouth in advertising and destroy the brand identity (Haynes 2002).
Website Design
After studying the user experience evaluation, several website design issues were identified such as website’s value for organizations, website users’ satisfaction and the factors that makes websites more attractive. Websites, as a new means for organizations to communicate with their customer, provide new marketing methods with completely different structures and moves organizations one-step closer to the customers. Thus, there are a number of scenarios that must be considered while designing a web site such as user profile, the interaction of the website, the information accuracy and entertainment level (Palmer and Griffith 1998). It is important to realize customers’ expectations and how they feel about the website interaction. Ping et al. (2001) come across how the users think about the objects of the website as satisfiers or dissatisfies according to how they appeal to the user (Ping et al. 2001). On the other hand, in this study the users’ overall summary satisfaction or frustration level will be measured not by the objects of the website but by completing a set of tasks.
The first impressions of a website have been measured by many researchers and most of the studies suggest that users first impact will be taken in twenty to ten seconds while according to a recent research conducted in Careleton University in Ottawa, Canada, website users were able to summarize their judgment about the home page in 500 milliseconds (Hodge 2006). This result limits designers first impression time therefore it is necessary to carefully design the first page of the website to gain users’ satisfaction otherwise users will seek their information somewhere else (Hodge 2006).
Usability Evaluation
Website usability plays an important role of the business image and can influence customer shopping behaviour. Usability is considered as an important issue, especially when the organization uses the internet in their service in general usability it is important to achieve customer satisfaction (Flavián et al. 2006).
Usability testing involves studying the website or interface under real world or specific settings while evaluators are gathering data on problems that arise during the test, this is how the experiment of this study was designed, users will be asked to perform certain tasks and they will be monitored by the experimenter. According to Jeffries (1991) this methodology offers excellent opportunity for observing how well the interface supports the user requirements (Jeffries 1991).
Usability evaluation of web application is a hard task and can be categorized as usability testing or usability inspection (Danuta and Franklin 1999). The two types of usability evaluation can be implemented in this study to observer participant during the experiment.
environment (Danuta and Franklin 1999). To deliver efficient product and increase the productivity designers must consider the user requirement during the usability test (De-Marsico and Leviald, 2005). According to De-(De-Marsico and Leviald, usability evaluation methodologies are as follows ‘The first generally consider task-oriented (high-level) characteristics, the second exploit results from behavioural research, the last are mostly based on style and context-free features’ (De-Marsico and Leviald 2005).
Satisfaction/Frustration
The main motive of adding up this section is the development of the experiment of this research. Users overall satisfaction or frustration level is related to the main hypothesis therefore it is vital to state the reasons that frustrate or satisfy users. As mentioned by Lazar et al. (2006) ‘Frustration occurs when there is an inhibiting condition, which interferes with or stops the realization of a goal’. The level of frustration varies depending on the conditions that affect on the frustrating experience and persons involved (Lazar et al. 2006).
What is User Frustration?
User frustration is aroused when computer operates in unexpected way that annoys the user and stops him from completing a specific task. There are several reasons that frustrate users for example the crash of software application, unclear error message, appearance of pop-up advertisements or a confusing interface, in general frustration with technology occurs when users cannot achieve their task or goal (Lazar et al. 2006). Indisputably, frustration is the most reported complaint by users who experienced a negative computer experience. Almost every computer user has at least experienced one situation that is frustrating such as ordeal of a program crash wasting the last hour of work or maybe finding it difficult to download an email attachment. Human-computer interaction can predict that frustration will continue to be a major reaction for users when a computer or programme fails to accomplish a specific task (Bessière et al. 2006). At this point of research, it is vital to look into different computer frustration models to understand participants’ way of thinking as well as the main factors that affect on the frustration experience. In the following section two computer frustration models by (Bessière et al. 2006) are presented.
Bessière et al. (2006) proposed a computer frustration model based on situational factors such as the level of importance of a task, frequency of occurrence and severity of interruption. The second main factor proposed in the computer frustration model is the dispositional factors that affect on the strength of the frustration experience such as, the level of computer experience, self efficiency, user mood, and psychological factors related to user’s environment and way of thinking.
Another previous computing frustration model by Bessière et al. (2003) which describes the frustration factors divides the frustration factors into individual and incident factors. The individual factors that are hard to influence in an experiment can be categorized as follows: anxiety, attitudes, experience, self efficacy, mood, psychological factors and cultural, societal influence, learning (Bessière et al. 2003). Whereby the incident factors include level of goal commitment, self efficacy, importance, severity of interruption, time loss, strength of desire and anticipation expectations (Bessière et al. 2003)
What is User Satisfaction?
two to five, but most of the website still contains a lot of unnecessary information which causes information overload (O’Reilly 2004). Nowadays experienced web users are increasing and they are expected to use the websites search tools instead of the navigation options to find what they are looking for, therefore web designers must try to decrease the tasks search time in order to keep their users satisfied (O’Reilly 2004).
According to Muylle et al. (2004) website user satisfaction is ‘defined as the attitude toward the web site by a hands-on user of the organization’s web site’. The definition emphasizes the interaction between the user and the website besides the user’s attitude toward an organization website.
Muylle et al. (2004) proposed 11 dimensions which are related to the website user satisfaction. The first five dimensions are related to the user in term of the website information whereby the other six dimensions are more related to the users’ website interaction. Each of the 11 dimensions will be shortly explained in the following section (Muylle et al. 2004).
• Information relevancy: The degree to which the user perceives the website information contents as being related to his needs.
• Information accuracy: The degree to which users perceive the website information content to exactly match their needs.
• Information comprehensibility: The degree to which users can realize and interpret the website contents.
• Information comprehensiveness: The perceived totality of the website information.
• Ease of use: The degree to which the user considers the website to be user-friendly.
• Entry guidance: The user’s opinion about the website home page in term of guiding him or her to the desirable information in the website.
• Hyperlink connotation: The extent to which user can easily navigate through the website hyperlinks.
• Website structure: The perceived structural integrity of the website.
• Website speed: The degree to which the user perceived the website to be fast or slow.
• Layout: The degree to which users perceive the general contents and look of the website such as colour, scheme, backgrounds, fonts, and images.
• Language customization: The degree to which the national language is clear to the user.
Features of the profile experiences
Like any other experience emotion experience can take any form; which form it takes depends on the person mode, the level of attention and if there is any direction to attention (Frijda 2005). According to the previous statement website emotion experience is affected by the user mode and the level of attention and attention direction. According to Ariely and Carmon (2003) when people summarize experiences they do not integrate or average the passing situations they experienced as the event unfolded. Two types define features of the profile of experiences that control the overall evaluations and they are as follows:
Static (state)
Dynamic (configurable)
Dynamic reflects the change in the intensity of the transient states as the experience progresses. The logic of dynamic is almost similar to the static one. The idea is that people consider basic statistics of the experience and these static in stead of the complete experience will be stored and used later on. In the dynamic case the captured statistics represent relationships between different states of the experience (Ariely and Carmon 2003). Static and dynamic profile features can be applied on website users’ experience to have better sympathetic about users overall evaluation.
Design
The experiment was designed as a set of seven questions as easy-to-hard or hard-to-easy, which have been given to two different groups. According to the study main hypothesis, it is assumed that the hard to easy group will provide higher satisfaction judgments than easy to hard group. The second hypothesis predicts the relationship between the time difference (Expected time-Actual time) and the satisfaction score of all tasks and it is presumed that if the time difference is higher, participants will report higher satisfaction. This was a brief explanation of the study hypothesis and at the end of this section there is a detailed hypothesis section which explains the study hypothesis in more detail.
University of Manchester, School of Informatics website was used to develop the seven tasks used in this experiment. While designing the questions the hard task was how to define the level of questions’ easiness and hardness; therefore task difficulty standard was created and the questions’ answers were classified as following:
• If the answer requires one or two links starting from school of informatics home page it is an easy question.
• If the answer requires three or four links starting from school of informatics home page it is a medium question.
• If the answer requires five links or more starting from school of informatics home page it is a hard question.
According to the above standards the question list was created and 20 participants were asked to fill in the questionnaires in two groups (E-H and H-E). In the following section the seven modified easy to hard tasks according to the pilot study will be presented and further explained. The same reversed tasks were used for the (H-E) group.
Task1: Find the enquiries email address for undergraduate students.
The answer for this task requires one link only; therefore this question is classified as the easiest question of all.
Task 1 answer: http://www-0.co.umist.ac.uk/programmes/ug_programme_list.php
Task 2: Find Dr. Antonella De Angeli’s fax number.
The second task answer requires two links and has been classified as the second easiest question.
Task 3: Find business information system research interest list.
The answer for this task requires three links and classified as medium level question.
Task 3 answer: http://www-0.co.umist.ac.uk/pgr/pgr_res_interests.php
Task 4: Find Msc Informatics first semester timetable.
The answer for this task requires four links and classified as medium level question.
Task 4 answer: http://www0.co.umist.ac.uk/intranet/timetable_details.php?programme_ id=PG-INFandcur_list_id=PGandsemester_id=1
Task 5: Find the examination rules according to the University of Manchester regulations.
The answer for this task requires three links and is located under the course unit link; therefore this question is classified as a medium level question.
Task 5 answer: http://www-0.co.umist.ac.uk/intranet/course_unit_exam_rules.php
Task 6: Find the Application form for PhD studentships.
This task requires three links but during the pilot study several participants faced difficulty in finding the answer; therefore this task has been classified as difficult.
Task 6 answer: http://www-0.co.umist.ac.uk/pgr/pgr_apply.php
Task 7: Who is responsible for recruiting lecturers, in the interactive design system section according to the school of informatics operational plan?
The seventh task answer for requires four links and because the participants have to hunt the school of informatics PDF file to find the answer, this task is considered as the most difficult.
Tasks 6 answer: http://www-0.co.umist.ac.uk/intranet/school_board_docs/SoI_op_plan_ 05_06.pdf
Before starting each task participants were asked to record their expected time to find the task answer as follows:
Expected search time for the answer to question 1:
O O O O O
< 1 minutes < 2 minutes < 5 minutes < 10 minutes > 10 minutes
Figure 1. Expected individual task time scale to complete a single task
The individual task satisfaction/frustration experienced with the website while searching for answer1:
O O O O O O O O O O O
-5 -4 -3 -2 -1 0 +1 +2 +3 +4 +5
Very frustrating
Neutral Very
satisfying
Figure 2. Individual task satisfaction Level scale
The following section will explain the methodology of the experiment by discussing the participants’ involved in the experiment, equipment used, procedure of the experiment, the analysis tools used to analyze the gathered data and the hypothesis of the study.
Method
Participants
20 students of University of Manchester from different schools participated in this experiment. Participants were allocated to the two experimental groups alternately on arrival at the experimental laboratory. Participants’ age group is between 22 and 29. In terms of gender there was 13 males and 7 female participants. Since this study is not investigating the difference of gender or age group there should be no problem in gender or age difference. Participants were assigned randomly and they are considered as volunteers in this experiment.
Apparatus
A set of computers equipped with Internet in the Mathematical and Social Science building at the University of Manchester were used to perform this experiment. After contacting the participants to volunteer and perform the experiment each participant was assigned a separate appointment to perform the test.
The second questionnaire results show that all participants are expert web users with a minimum of 12 hours per week and maximum 100 hours per week. So it was assumed that participant computer knowledge was sufficient to carry out this study smoothly.
Procedures
Upon arrival to the lab participants were assigned randomly to one of the two groups (E-H and H-E) a brief explanation was given before starting the actual test. Participants were asked to look up the answers to the tasks on School of Informatics website as an evaluation of their overall summary judgment experience. The maximum time limit for each question is 10 minutes; participants were timed and asked to leave the question if they feel that they can not find the answer after 5 minutes (Kampf 2003). In the easy to hard situation the questions will be ordered in increasing difficulty and in the hard to easy the same questions will be reversed. Participants were asked to mark the estimated time for each task before starting the actual task search. Each task search started from the home page of the school of informatics website. Participants were monitored by the experimenter and they were asked to continue the search if they believe they found the answer incorrectly.
overall satisfaction with the website. All Participants sent back the second questionnaire as requested (Kampf 2003).
Analysis
Microsoft Excel statistical tools were used in order to analyze the data and test the experiment hypothesis. Two main tests were performed, two sample with equal variance T-test to prove the significant difference between the two groups means (E-H and H-E) and the correlation test to measure the relationship between each participant individual task time difference (expected time-actual time) and the individual task satisfaction score of all participants.
Hypothesis
It is proved by Ariely and Carmon (2003) that increasing pain intensity was considered as very painful while the decreasing pain intensity was considered as not painful even when the sum of the intensities are equivalent in both cases. However it is still not proved in website user experience. This was the first thought of the main hypothesis of the study.
The main hypothesis of the study is ‘if user satisfaction increases toward the end of evaluation period the overall summary satisfaction will be higher than if satisfaction decreases toward the end of the evaluation period, even if the total individual task satisfaction is equivalent in both cases’. This hypothesis is trying to replicate what has been done by Ariely and Carmon (2003) in the pain intensity.
In order to test the hypothesis an experiment was designed as shown in the beginning of this section. Briefly, the experiment consists of seven search tasks involving twenty participants in two different groups, E-H and H-E. In comparison to Ariely and Carmon (2003) the E-H group can be compared to the increasing pain intensity participants and the H-E group replicate the decreasing pain intensity.
The experiment was designed to test the difference between the two groups overall summary judgment and overall website design, simply put to report which of the two groups will report higher overall satisfaction.
Another focus was the effect of the relationship between the expected time to complete a task and actual time taken to complete it. For example, a task will be less satisfying the higher the difference between expected time and the actual time taken to perform that task and vice versa (Kampf 2003).
The second hypothesis states that the difference between the predicted time and actual time taken to do the task can be used to predict the level of satisfaction experienced, (Kampf 2003). In order to test this hypothesis the correlation between each tasks time comparison (expected time-actual time) and each individual task’s satisfaction score was measured.
Results
0:10 0:28 0:38 1:06 2:24 1:52 7:24 10:21 1:12 5:43 2:24 0:51 0:16 0:09 0:00 1:26 2:53 4:19 5:46 7:12 8:38 10:05 11:31
1 2 3 4 5 6 7
TASKS T IM E ( S E C ) E-H H-E
Figure 3. E-H and H-E users’ individual task actual time taken average
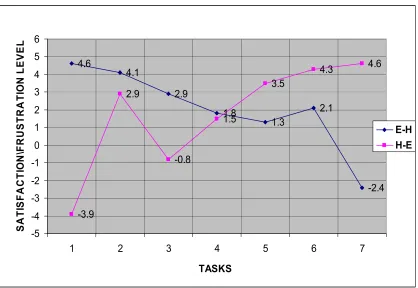
4.6 4.1 2.9 1.8 1.3 2.1 -2.4 -3.9 2.9 -0.8 1.5 3.5 4.3 4.6 -5 -4 -3 -2 -1 0 1 2 3 4 5 6
1 2 3 4 5 6 7
[image:16.595.76.494.374.662.2]TASKS S A T IS F A C T IO N \F R U S T R A T IO N L E V E L E-H H-E
Figure 4. E-H and H-E users’ individual task satisfaction average
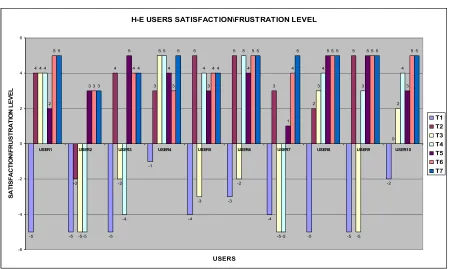
0, p > 0.05), however it is obvious from both figures, that the H-E group participants failed to complete more tasks than the easy to hard group at the same time it is clear that figure 6 illustrates more negative individual task users’ satisfaction than figure 5.
E-H USERS SATISFACTION\FRUSTRATION LEVEL
4
5 5
3
5
4
5 5 5 5
3 5 5 3 4 5 5 4 5 2 3 5 5 -1 3 4 4 0 4 2 1 5 -2 3 2 4 5 0 4 -4 0 1 4 1 2 2 5 2 -4 0 3 1 5 3 4 5 4 -5 4 -3 1 -3 -1 -2 1 -5 0
-5 -5 -5
-6 -4 -2 0 2 4 6
USER1 USER2 USER3 USER4 USER5 USER6 USER7 USER8 USER9 USER10
[image:17.595.73.520.123.413.2]USERS S A T IS F A C T IO N \F R U S T R A T IO N L E V E L T1 T2 T3 T4 T5 T6 T7
Figure 5. E-H users’ individual task satisfaction
H-E USERS SATISFACTION\FRUSTRATION LEVEL
-5 -5 -5
-1 -4 -3 -4 -5 -5 -2 4 -2 4 3 5 5 3 2 5 0 4 -5 -2 5 -3 -2 -5 3 -5 2 4 -5 -4 5 4 5 -5 4 3 4 2 3 5 4 3 4 1 5 5 3 5 3 4 3 4 5 4
5 5 5
5
3
4
5
4
5 5 5 5 5
-6 -4 -2 0 2 4 6
USER1 USER2 USER3 USER4 USER5 USER6 USER7 USER8 USER9 USER10
USERS S A T IS F A C T IO N \F R U S T R A T IO N L E V E L T1 T2 T3 T4 T5 T6 T7
[image:17.595.73.522.449.718.2]Table 1 illustrates the overall summary judgment mean and standard deviation of both groups. The overall summary judgment mean of the E-H groups is 1.7, whereby for the H-E group it is-0.1. The difference between the two groups is significant,
t
18 = 2.26, p < 0.05. Although these results do not support the study’s main hypothesis, it still proves the opposite which can be simplified as follows; the E-H group will report higher satisfaction level than the H-E group toward the end of the experience period while the total individual task satisfaction is equivalent for both groups.Table 2 shows the website design judgment summary and standard deviation of both groups. The E-H participants’ website satisfaction mean is 1.6 while the H-E participants reported 0.5.The T test shows that the difference between the two groups is not significant,
t
18 = 1.16, p >.0.05.|
Group Overall summary
judgment mean Standard deviation
E-H 1.7 1.70
H-E -0.1 1.85
Table 1. E-H and H-E Overall summary judgement mean plus standard deviation.
Group Overall website summary
judgment mean Standard deviation
E-H 1.6 1.71
H-E 0.5 2.46
Table 2. E-H and H-E Website design judgement summary mean plus standard deviation.
The second hypothesis of this experiment was the relationship between each task time difference (expected time-actual time) and the individual task satisfaction score, it is assumed that participants will report higher task satisfaction if the time difference is less and vice versa for example if a participant estimates two minutes to find the task answer but the actual time to seek the same task is ten minutes, the participant are more likely to report lower satisfaction and if a participant expected time is ten minutes but the actual time to seek the answer is two minutes it is more likely to report high satisfaction. In order to test the prediction, the correlation between discrepancy (expected time-actual time) and the satisfaction score of each of the seven questions was measured. The average correlation of all participants’ satisfaction scores and their time difference was 0.73 which signifies a strong correlation and supports the study hypothesis.
Discussion
will report greater overall summary satisfaction level than decreasing toward the end of the experience period.
Ariely and Carmon (2003) proved that ‘Increasing pain intensity was perceived as very painful, and decreasing intensity was perceived as not painful, even when the sum of momentary intensities was the same’. The results of this study do not exactly match what has been found by Ariely and Carmon (2003); this might be referred to the fact that they were measuring the overall summary judgment of a pain experience while this study is measuring website experience thus; there is a difference between the two experiments in terms of their type. Another reason for the opposite results may be that it is easier to control the increasing and decreasing pain intensity flow in the pain experience than the website users’ experience. For example dentists could control the treatment session by starting with the hard actions and finishing with easy actions or vice versa while in the website experience the only option to control the difficulty flow is by reversing the set of task from E-H to H-E.
The third reason could be that in the pain experience users did not link between the individual parts of the experience and the overall summary judgment but, it is more likely for users in the website user experience to link between the individual parts and the overall experience and this might be because the participant were involved in performing the task not like the pain experience receiving treatment by another person. The three reasons behind the opposite results can be summarised as follows:
1. Type variation of experiences.
2. The flow of individual parts of the experiment (E-H and H-E). 3. Level of participants’ involvement.
These are the main three estimated reasons that led to achieve the opposite results between the pain and website users’ experiences.
In term of website design judgment summary, T test confirmed that there is no significant difference between the two groups’ judgments. This means that the participants overall website design judgment was not affected by the two different group’s experiences. The suggested reason is both group’s participants’ judgments were focusing on a single factor which is the website design and at the same time participants’ website judgments were based on a general overview of the website unlike the E-H and the H-E judgment which was based on the end peak rule (the difficulty flow of the tasks).
Collecting participants overall satisfaction judgment after a few days as explained in the design section helped to overcome the problem faced by Kampf (2003) which is the tendency of remembering various judgments when they are all tied together rather than sampling from a continuous experience, asking participants to fill in the second questionnaire after at least three days helped to summarize the seven tasks as one whole experience.
awareness of the website. For example users which are familiar with a certain task will estimate the exact search time. The third noticed factor was participants’ personality or the (level of self-esteem) to illustrate participants with high self esteem will report higher satisfaction score despite the time difference between the actual and expected time, as almost two or three participants were noticed to report -3 out of -5 even if they fail to achieve the task whereby if they estimates two minutes and achieve the task in one minute they will report +5 which is the highest positive score.
The three main factors noticed during the lab experiment which affected testing the second hypothesis can be summarized as follow:
1. The level of understanding a task as a question. 2. The degree of awareness of the website
3. Participants’ personality (level of self-esteem)
Summary
The results of the experiment showed the opposite of the main hypothesis that this study was trying to prove, reporting that the H-E group satisfaction was greater than the E-H group toward the end of the experience period. The experiment showed a significant difference between the two groups overall satisfaction judgments and the T-test proved that the difference between the two groups is significant,
t
18 = 2.26, p < 0.05t while there is no significant effect on the website design judgment.The reason behind the difference between this study’s results and Ariely and Carmon, can be broken down into three parts. The first part is the difference between the two experiences in terms of their type; the pain experience is related to human physical reaction, while the website experience is a cognitive reaction, measuring human perceptions. The second part concerns the flow of the individual tasks of the experiment. For example, it is easier to control the pain intensity experienced by the user, than website experience flow, in terms of difficulty, E-H or H-E. The third part is the level of participants’ involvement. For example, in website experiences, users carry out actions whilst experiencing pain. Participants receive treatment and it is usual for the degree of involvement to vary from one type of experience to another.
In terms of the second hypothesis, relating to the relationship between a task’s satisfaction score and the time difference between expected time and actual time taken for each task. It has been found that there is a strong correlation (0.73) between both tested variables, the time difference and individual task satisfaction score.
Whilst performing the experiment, several participants’ behaviour was noticed. The behaviours were analysed and further related to three main factors that could affect the relationship between the time difference (expected time-actual time) and the satisfaction score. The first factor is the level of understanding of a task as a question. The second factor is the degree of awareness when using the website. Finally, the third factor is the participants’ personality or the level of self –esteem.
functional and technical aspects in addition other factors which worth to be studied in the future. The identification of all the factors that affect the website’s overall judgment along with the peak end-rule will assist designers, physiologists and Human Computer Interaction specialists to better understand website users’ needs and lead to a better understanding of users’ mentalities.
References
Ariely, D. and Carmon, Z. (2003) The sum reflects only some of its parts: A critical overview of research on summary assessment of experiences. New York: Russell Sage Foundation Press.
Bessière, K., Ceaparu, I., Lazar, J., Robinson, J. and Shneiderman, B. (2003) Social and Psychological Influences on Computer User Frustration. UM Computer Science Department. Bessière, K., Newhagen, J., Robinson, J. and Shneiderman, B. (2006) ‘A model for computer frustration: the role of instrumental and dispositional factors on incident, session, and post-session frustration and mood’, Computers in Human Behavior 22, pp. 941-961.
Danuta, A. and Franklin, B. (1999) ‘New measures for research libraries: New measures for research libraries’, The Journal of Academic Librarianship 25, pp. 484-487.
De-Marsico, M. and Leviald, S. (2005) ‘Evaluating web sites: exploiting user’s expectations’,
International Journal of Human-Computer Studies 60, pp. 381-416.
Flavian, C.. Guinaliu, M. and Gurrea, R. (2006) ‘The role played by perceived usability, satisfaction and consumer trust on website loyalty’, Information and Management 43, pp. 1-14.
Fridja, N. (2005) ‘Emotion experience’, Cognition and Emotion 14, pp. 473-497.
Ghauri, P. and Gronhaug, K. (2005) Research methods in business studies, a practical guide. Harlow: Financial Times Prentice Hall.
Hartson, R., Castillo, J, Kelso, J. and Neale, W. (1996) ‘Remote evaluation: the network as an extension of the usability laboratory’, Conference on Human Factors in Computing Systems. Haynes, M. (2002) User Experience as Corporate Imperative Raleigh. hesketh.com/inc. Hodge, K. (2006) Create sites with impact.net.
Isomursu, M. Kuutti, K. and Väinämö, S. (2004) Experience clip: method for user participation and evaluation of mobile concepts. Proceedings of the eighth conference on Participatory design: Artful integration: interweaving media, materials and practices. Toronto.
Jeffries, R., Miller, J,. Cathleen, W. and Kathy, M. (1991) ‘User interface evaluation in the real world: a comparison of four techniques’ Conference on Human Factors in Computing Systems 119-124.
Kahneman, D. (2000) Experienced utility and objective happiness: A moment-based approach.New York: Cambridge University Press and the Russell Sage Foundation.
Kampf, M. (2003) ‘The peak/end rule in a website evaluation’, Cardiff: Cardiff University, School of Psychology.
Landauer, T. K., John, B. E., Whiteside, J. and Wolf, Catherine G. (1989) ‘The Role of Laboratory Experiments in HCI: Help, Hindrance or Ho-Hum?’ in Carrol, J. M. (ed.)
CH1’89.Yorktown Heights, NY 10598: IBM Watson Research Center.
Lazar, L., Jones, A., Hackley, M. and Shneiderman, B. (2006) ‘Severity and impact of computer user frustration: A comparison of student and workplace users’, Interacting with Computers 18, pp. 187-207.
Muylle, S., Moenaert, R. and Despontin, M. (2004) ‘The conceptualization and empirical validation of web site user satisfaction’, Information and Management 41, pp. 543-560.
Palmer, J. and Griffith, D. (1998) ‘An emerging model of Web site design for marketing’,
Communications of the ACM 41, pp. 44 – 51.
Public-Private Partnership (PPP) Projects in Malaysian Tolled
Highways – An Insight Using a Political Economy Approach
Ervina Alfan
Manchester Business School, University of Manchester
Abstract
Tolled highways in Malaysia are built under the public-private approach in which the government provides the opportunities for the involvement of the private sectors in the construction of these infrastructures. Using a political economy approach, this paper seeks to ascertain the main concession holders of the Malaysian tolled highways as well as in what way the tolled highways influence the political and economic arena. The paper finds that the tolled highways in Malaysia play a significant role in achieving the country’s economic objectives.
Introduction
In many countries world wide, the provision of public infrastructure and related services are carried out using a Public-Private Partnership (PPP) approach (Olson et al. 1998 English and Guthrie 2003, Newberry and Pallot 2003). Previous studies on PPP focus on issues like ex ante decision making (Edwards and Shaoul 1999, Gaffney et al. 1999), the value for money in adopting this approach (Heald 2003), risk transfer (Broadbent et al. 2003), varying interests that developed into tension between the government and standard setting body (Broadbent and Laughlin 2005a) and how PPP serves as the means to achieve government’s political agenda (Broadbent and Laughlin 2005b). Broadbent and Laughlin (2003) raise concern that PPP is a growing issue not geographically confined to UK but also to many countries internationally. In addition, they highlight the importance of conducting researches to ascertain the implementation of PPP across the globe since PPPs are likely to be the major vehicle for developments in the provision of public services for many years to come (p. 340). Following this, the paper aims to look at how a PPP approach is undertaken in a country-specific context; namely Malaysia whose economic objectives are steered towards achieving socio-economic balances amongst various ethnic groups.
Literature Review
PPP in Malaysia
transport and communication sector plays a significant role in the country’s privatisation programme. Throughout the privatisation period i.e. from 1983 until 2005, the transport, storage and communication sector accounts for 12% of privatised projects in comparison to the electricity, gas and water sector at 8.4% (obtained from EPU web-site:
http://www.epu.jpm.my/).
As mentioned earlier, construction of tolled highways constitutes that part of the privatisation plan which utilised the BOT approach (Economic Planning Unit (EPU) 2005). Under this approach, the private sector is responsible for the construction, operation and maintenance of the facility in question using its own funds and in return, owns the right to collect toll from road users during the concession period. The facility will then be transferred at no cost to the government at the end of the concession period (Ibid) which is normally long enough for the private sector to recoup its investment as well as paying back the project’s debt (Naidu and Lee 1997). Although there are different approaches to PPPs adopted by various countries and therefore a number of varying PPP concepts and forms has been discussed (Broadbent and Laughlin 2002, Baker 2003); in essence, PPP constitutes a contractual relationship between private entities and public sector in providing services that are of public interest; carried out within the scope of a programme or policy designed by public entities (Diogo et al. 2005). The Malaysian highway projects, following the terminology of PPP offered by Diogo, can thus be recognized as PPP; particularly as both the public and private sectors in this instance are bound by the terms in concession agreements.
The introduction section highlights the aim of the paper, which is directed towards conducting a study of PPP within a country’s socio-economic and political context. In this respect, it is important to note here the Malaysian privatisation programme (of which PPP is one of the mechanisms) is implemented with the objective of enhancing the Bumiputera
(indigenous people) participation in the economic sector which is in line with the New Economic Policy (NEP)1 (Economic Planning Unit [EPU] 1991). This objective is clearly expressed by the government in its published privatisation guidelines, Privatisation Masterplan which also states that in order to meet this objective; privatised projects must meet the requirement that calls for at least 30 per cent equity participation of Bumiputera
entrepreneurs (Ibid). In this way, the government tries to seek a more balanced economic achievement amongst the three major racial groups. In the Ninth Malaysia Plan2, the government aims to reduce the income gap between the Bumiputera and the Chinese from 1:1.64in 2004 to 1:1.50 in 2010 and between Bumiputera and Indians from 1:1.27 in 2004 to 1:1.15 in 2010 (Economic Planning Unit (EPU) 2005).
1
After Malaysia (known as Malaya at that time) achieved her independence in 1957, the country undertook a
laissez-faire approach in its economic activities. However, at the onset ofindependence, economic disparities were clearly evident amongst the three major racial groups – the indigenous Malays (Bumiputera-‘sons of the soil’), Chinese and Indians. The social and economic imbalances between the three major racial groups – the Malays, Chinese and Indians have created much tension, which later erupted into a racial riot involving the Malays and the Chinese on 13th of May 1969. After this tragedy, the Malaysian government has introduced New Economic Policy (NEP) that seeks to eradicate poverty and restructure the society. The basic philosophy underlying in this policy is to ‘grow with equity and national unity’. Such emphasis is important in the context of a multi-races country so as to ensure and hence put the economically dominant race; the Chinese to the comfort of knowing that they would not be deprived of any rights and opportunities existing in the country (Economic Planning Unit web site: http://www.epu.jpm.my/).
2
The government’s role is not limited to ensuring that the country’s wealth is enjoyed equally amongst the multi racial group. It also extends to other areas, particularly in relation to the privatised projects itself. For example, the government continues to play a substantial role in the implementation of privatisation programmes. This takes place in the form of providing financial support through various measures such as giving soft loans, offering directed lending through banks and provident funds (Baietti 2001) as well as acting as the guarantor to loans contracted by private sectors (Naidu and Lee 1997). In addition, the extent of government involvement is also apparent in the instance of pricing decisions. Apparently, price revisions in some sectors like telecommunications, power and toll roads require ministerial and at times cabinet approval (Naidu and Lee 1997).
Having provided an overview of the PPP approach in Malaysia, this paper will turn its discussion on the theoretical framework. As PPP is one of the vehicles used to achieve the economic objective of encouraging the participation of Bumiputera entrepreneurs in the economic sector, a political economy approach (PEA) will be adopted in conducting the study. A review of the political economy literature is reviewed in the following section.
Political Economy Framework
Political economy approach (PEA) in accounting studies seeks to study accounting practices in a wider context, taking into account socio-economic and political factors in the studies. This approach is undertaken as a growing number of accounting researchers express their concern that accounting studies need to take into consideration various factors including organization context, socio-political and economic factors that could have an influence on the accounting practice (Burchell et al. 1980, Hopwood 1983, Hopper and Powell 1985). Employing this approach, Tinker (1980), uses financial data of Delco, a company that was involved in iron-ore extraction business in Sierra Leone, to demonstrate how socio-economic and political attributes are reflected in accounting information. Taking this view, Cooper and Sherer (1984) in their conceptual paper put forth suggestions of how the PEA should be adopted in accounting studies. According to them, accounting researches that employ PEA should focus on conflicts in society, which is translated into the accounting field as how the accounting report serves the interests of specific groups in the community, for example, the elites. Next, PEA in accounting studies needs to take into consideration the historical and institutional context of the society in which it operates; noting how big corporations function in oligopolistic and monopolistic markets and in particular, how the state manages the economy. Lastly, the view in PEA is that people have the potential to change society apart from reflecting difference in interests and concerns. The last attribute of PEA as suggested by Cooper and Sherer indicates that their view is somewhat radical. Laughlin (1995) who proposes a ‘middle-range’ thinking in accounting studies suggests that instead of making an absolute stand of whether a change should be initiated or not at the beginning of their studies, these options should instead be more open to the accounting researchers after the empirics have been reviewed.
both within and outside the Malaysian accounting profession, the same interests do not come into play perpetually. In a similar manner, Ali et al. (2006) use this approach to examine the development of the auditing profession in Malaysia. They find that auditing in Malaysia is intertwined with the influence of political and socio-economic factors, in support of the contention put forth by Hopper et al. (1987) that political struggles in society do play a role in shaping accounting development.
The above papers effectively demonstrate how political and socio-economic determinants play an important role in accounting and auditing studies. This study uses the political economy approach as the theoretical framework in an attempt to establish a clear link between the research objectives, the empirics and the theoretical grounding. The research objectives are explained below.
Research Objectives
The research objective of this paper is twofold; firstly it aims to ascertain the companies that act as concession holders of tolled highways in Malaysia. Secondly, it seeks to explore the ways in which the highways influence (or are influenced by) the political and socio-economic factors.
Research Methodology
The data for this paper is gathered from the information contained in the web sites of the Malaysian Highway Authority, Ministry of Work and Economic Planning Unit. In addition, further data is gathered from annual reports of the immediate concession companies in question (in cases where the concession companies are private limited companies), the accounts filed by the companies at Companies Commission of Malaysia. Since the aim is to determine the concession companies of Malaysian tolled highways, the annual reports and the accounts for the year 2005 (or 2004 if the annual reports for the year 2005 are not available)3 are examined to determine the details of the immediate and ultimate holding companies.
Findings
In this section, the findings of the study will be discussed. This section will discuss in general, the participants in Malaysian Tolled Highway, in particular the concession companies drawing evidence from the accounts and annual reports published by the companies. Further discussion on the findings that attempts to relate the empirics to the political economy framework will be provided in the Discussion section.
Concession Companies of Malaysian Tolled Highways
From 1983, i.e. the year the Privatisation Programme and Malaysia Incorporated Policy is implemented, until 2005, a total of 19 tolled highways are constructed. The highways, their respective year of completion, total length and the concession holders are displayed in Table 1 below:
3
Project Year Completed
Concession Company Length
(1) Penang Bridge 1985 Penang Bridge Sdn Bhd (PBSB) 13.5 km
(2) North-South Expressway 1994 Projek Lebuhraya Utara-Selatan Sdn Bhd (PLUS)
848.0 km
(3) Seremban-Port Dickson Expressway
1997 PLUS Expressway Bhd 23.0 km
(4) Shah Alam Expressway 1997 Konsortium Expressway Shah Alam Selangor Sdn Bhd (KESAS)
35.0 km
(5) North-South Expressway Central Link
1997 Expressway Lingkaran Tengah (ELITE) Sdn Bhd
56.8 km
(6) KL-Karak Expressway 1998 MTD Construction Sdn Bhd 60.0 km
(7) Malaysia – Singapore Second Link
1998 Linkedua Sdn Bhd 45.7 km
(8) Butterworth-Kulim Expressway 1998 Konsortium Kulim Butterworth Expressway Sdn Bhd (KLBK)
16.8 km
(9) Damansara-Puchong Expressway 1999 Lingkaran Trans Kota (Litrak) Sdn Bhd 40.0 km
(10) Sungai Besi Expressway 1999 Besraya Sdn Bhd 16.0 km
(11) Cheras – Kajang Expressway 2000 Grand Saga Sdn Bhd 11.7 km (12) Western KL Traffic Dispersal
Scheme
2001 Sistem Penyuraian Trafik KL Barat (Sprint) Sdn Bhd
26.0 km
(13) ((13) Ampang-Kuala Lumpur Elevated Highway
2001 Projek Lintasan Kota Sdn Bhd (PROLINTAS) 7.4 km
(14) ((14) Northern Klang Straits Bypass Exact year is not known
SHAPADU PROP 15.3 km
(15) ((15) Kajang Dispersal Link Expressway (SILK)
2004 Sistem Lingkaran Lebuhraya Kajang (SILK) Sdn Bhd
37.0 km
(16) New Pantai Expressway 2004 New Pantai Expressway Sdn Bhd 19.6 km (17) Guthrie Corridor Expressway 2005 Guthrie Corridor Expressway 25.0 km
(18) Butterworth Outer Ring Road 2005 LLB Not known
(19) Western Kuala Lumpur Traffic Dispersal Scheme (SPRINT) Package C
Exact year is not known
Not known Not known
Table 1. Tolled Highways in Malaysia (source: compiled from Ministry of Works and Malaysian Highway Authority web-sites).
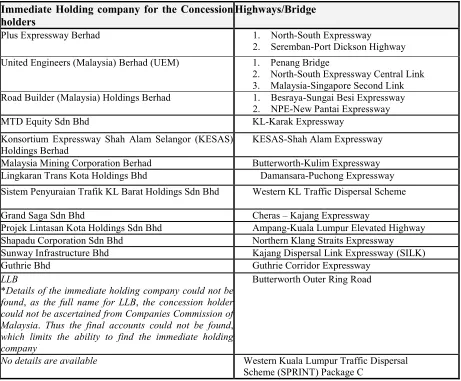
Immediate Holding company for the Concession holders
Highways/Bridge
Plus Expressway Berhad 1. North-South Expressway
2. Seremban-Port Dickson Highway
United Engineers (Malaysia) Berhad (UEM) 1. Penang Bridge
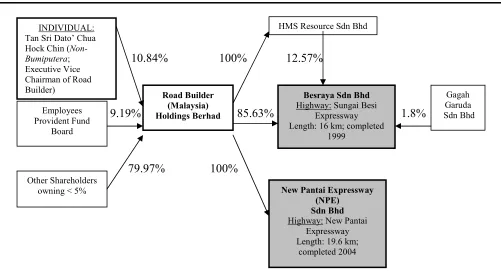
2. North-South Expressway Central Link 3. Malaysia-Singapore Second Link Road Builder (Malaysia) Holdings Berhad 1. Besraya-Sungai Besi Expressway
2. NPE-New Pantai Expressway
MTD Equity Sdn Bhd KL-Karak Expressway
Konsortium Expressway Shah Alam Selangor (KESAS) Holdings Berhad
KESAS-Shah Alam Expressway
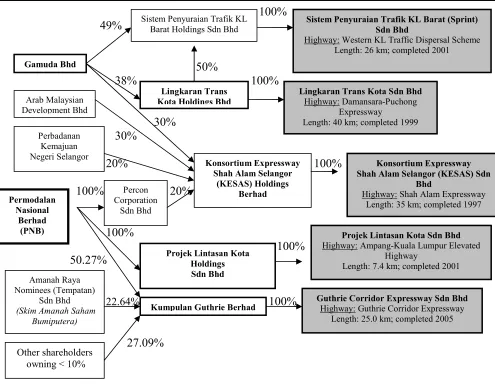
Malaysia Mining Corporation Berhad Butterworth-Kulim Expressway Lingkaran Trans Kota Holdings Bhd Damansara-Puchong Expressway Sistem Penyuraian Trafik KL Barat Holdings Sdn Bhd Western KL Traffic Dispersal Scheme
Grand Saga Sdn Bhd Cheras – Kajang Expressway
Projek Lintasan Kota Holdings Sdn Bhd Ampang-Kuala Lumpur Elevated Highway Shapadu Corporation Sdn Bhd Northern Klang Straits Expressway Sunway Infrastructure Bhd Kajang Dispersal Link Expressway (SILK)
Guthrie Bhd Guthrie Corridor Expressway
LLB
*Details of the immediate holding company could not be found, as the full name for LLB, the concession holder could not be ascertained from Companies Commission of Malaysia. Thus the final accounts could not be found,
which limits the ability to find the immediate holding company
Butterworth Outer Ring Road
[image:28.595.81.542.71.452.2]No details are available Western Kuala Lumpur Traffic Dispersal Scheme (SPRINT) Package C
Table 2. The Immediate Holding Companies for the Concession Holders.
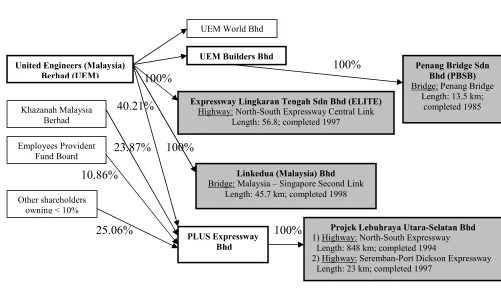
Figure 1. The UEM Group and the highways that the group operate
Figure 1 above shows that the PLUS Expressway Berhad is an associate company to the UEM group. The group appears to operate and maintain the first five highways built after the implementation of the Privatisation programme and Malaysia Incorporated policy. It also appears that the government’s main investment arm; Khazanah Malaysia Berhad has a shareholding of 23.87% of PLUS Expressway Berhad, which operate the North-South Expressway and the Seremban-Port Dickson Expressway.
100% 100%
40.21%
23.87% 100%
10.86%
25.06% 100%
United Engineers (Malaysia) Berhad (UEM)
UEM World Bhd
UEM Builders Bhd
Khazanah Malaysia Berhad
Employees Provident Fund Board
Other shareholders owning < 10%
Expressway Lingkaran Tengah Sdn Bhd (ELITE)
Highway: North-South Expressway Central Link Length: 56.8; completed 1997
Linkedua (Malaysia) Bhd
Bridge: Malaysia – Singapore Second Link Length: 45.7 km; completed 1998
PLUS Expressway Bhd
Projek Lebuhraya Utara-Selatan Bhd
1) Highway: North-South Expressway Length: 848 km; completed 1994
2) Highway: Seremban-Port Dickson Expressway Length: 23 km; completed 1997
Penang Bridge Sdn Bhd (PBSB)
Bridge: Penang Bridge Length: 13.5 km;