International Journal of Emerging Technology and Advanced Engineering
Website: www.ijetae.com (ISSN 2250-2459, Volume 2, Issue 3, March 2012)463
Simulation and Experiment for Eddy Current Studies due
to Current Quench
Ravi Prakash.N
1, Rajan Babu
2, Ranjana Gangradey
3, Megha M.Patel
4, Prof. S.N.Jani
51,2 ,3
Senior Engineer, Institute for Plasma Research
4M.tech Scholar, Institute of Technology, Nirma University
5Prof. S.N.Jani, Assistant Professor, Institute of Technology, Nirma University 1 [email protected]
2
[email protected] 3[email protected]
4[email protected] 5[email protected]
Abstract—Stability of plasma and its active control is one of the major research tasks on the way towards operating a Tokamak. Current quench, a phase of plasma disruptions in which the current rapidly decays to zero. The large magnetic flux changes during this current quench can drive induced currents in nearby conductive structures. It is the purpose of this paper to simulate the condition of current quench and the subsequent induced currents in toroidal vessel. ANSYS is used to compare the experimental induced currents with simulation.
Keywords— Current Quench, Central Solenoid, Eddy Current Experiment, PSCAD simulation, Rogowski Coil, Simulation with ANSYS.
I. INTRODUCTION
In Tokamak, the plasma is confined by the magnetic field generated due to the plasma current as well as the external magnetic field coils. Therefore, understanding of quench of the plasma current, such as disruption, has been one of the most critical issues in the Tokamaks. Plasma Disruptions is an instability which develops very rapidly with a sudden cooling of the central plasma and a flattening of the current profile, usually followed by a slower decay of the plasma current to zero. The plasma disruption instabilities and the large magnetic fields generate electromagnetic-type phenomena in transient conditions which lead to strong induced currents. Therefore, this paper presents simulation of experiment based on finite element method, mainly transient electromagnetic (EM) analysis of the vessel during current quench. Electro- magnetic analyses have been performed with the ANSYS to compare experimental induced currents.
II. VESSEL EDDY CURRENT MEASUREMENT DUE TO DISCHARGE IN COIL
A. Description of Experiment
For the experiment, a toroidal vessel made from SS304 is considered. The major and minor radii of the vessel torus are 14.57 and 8.43 cm, respectively. Parameters of Vessel and coil are as mentioned in Table 1.
Vessel current is measured by a Rogowski coil (RC), one of magnetic diagnostic (MD) sensors, which is used to diagnose induced current in vessel during a plasma discharge. In Experiment two RCs are used, one is mounted on the outer surface of vessel and the other is mounted inner surface of the Vessel. The induced current can be obtained by subtracting plasma current (which is measured by inner Rogowski coil) from the current measured by the Outer Rogowski coil mounted on vessel. Outer Rogowski coil measures plasma current as well as vessel current.
TABLEI
BASIC PARAMETERS OF VESSEL AND COIL
Major radius of Vessel 14.57cm
Minor radius of Vessel 8.43cm
Thickness of Vessel 0.288cm
No. of turns of coil 16
Resistance of coil 0.02Ω
Inductance of coil 80.00µH
Resistivity of copper coil 1.7E-8 Ω.m
International Journal of Emerging Technology and Advanced Engineering
Website: www.ijetae.com (ISSN 2250-2459, Volume 2, Issue 3, March 2012)464
The Experiment is performed for various voltage levels and the induced currents in the vessel are measured by RCs as shown in Table II. The pulse current is applied to the sixteen turn square cross-sectional coil kept at the centre inside the vessel as shown in fig 1.Fig.1. Vessel with Inner and Outer RCs
The Various Voltage levels are obtained by six stage voltage multiplier circuit and the pulse is obtained by Thyristor firing circuit.
B. PSCAD Simulation of Experiment
In Experiment, Pulse voltage is applied to coil by Thyristor firing circuit and per turn coil current is measured by current probe as shown in table II. The complete power supply circuit is modeled in PSCAD software and for above mentioned voltage levels, currents are being noted. Comparison for PSCAD Simulation and Experiment is performed at 1000V as shown in fig 2 (a) and (b).
Fig 2 (a) Simulation Circuit for Pulse Discharge
Fig.2 (b) Result for 1000V Discharge
C. Comparison of Practical and ANSYS Simulation:
Fig.3 shows the comparison between ANSYS and experimental induced current results performed at 200V discharge.
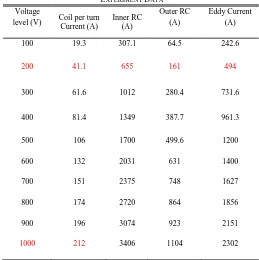
Fig.3 Experiment results with ANSYS simulation TABLEII
EXPERIMENT DATA
Voltage
level (V) Coil per turn Current (A)
Inner RC (A)
Outer RC (A)
Eddy Current (A)
100 19.3 307.1 64.5 242.6
200 41.1 655 161 494
300 61.6 1012 280.4 731.6
400 81.4 1349 387.7 961.3
500 106 1700 499.6 1200
600 132 2031 631 1400
700 151 2375 748 1627
800 174 2720 864 1856
900 196 3074 923 2151
1000 212 3406 1104 2302
[image:2.612.324.599.228.470.2] [image:2.612.39.298.359.619.2] [image:2.612.330.558.570.689.2]International Journal of Emerging Technology and Advanced Engineering
Website: www.ijetae.com (ISSN 2250-2459, Volume 2, Issue 3, March 2012)465
III. VESSEL CURRENT DUE TO DISCHARGE IN SINGLELAYER CENTRAL SOLENOID (CS)
A. Requirement of CS coil
The central solenoid is the key component that will allow a powerful current to be induced in the plasma and maintained during long plasma pulses. Two parameters that are important to obtaining maximum plasma current drive are magnetic field and the area of the solenoid. Table III shows the Basic CS parameters used in experiment.
B. Eddy current Experiment using single layer CS coil
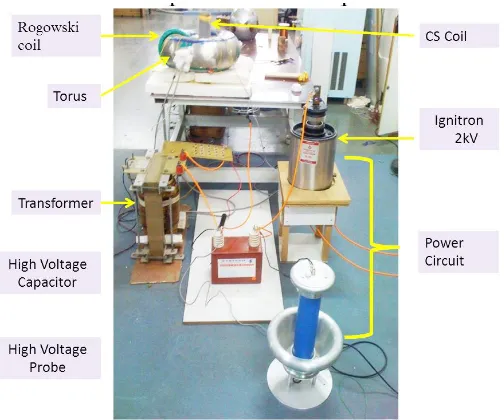
[image:3.612.323.563.302.444.2]For high voltage discharge, high rating capacitor and step up transformer is used in an experiment. High voltage pulse is provided by Ignitron as shown in fig.4. Table IV shows the experimental results for various voltage levels.
Fig.4. Circuit Diagram
C. PSCAD Simulation of Experiment
Fig 5 (a) Simulation Circuit for Pulse Discharge
Fig 5 (b) Result for 1000V Discharge TABLEIII
CENTRALSOLENOIDMODULEMAJORDIMENSIONS
Resistance 0.09Ω
Inductance 76.5μH
No. of turns 78
Length of CS coil 330mm
Inner Diameter of CS coil 63.18mm
Outer Diameter of CS coil 70.65mm
TABLEIV
SET OF READINGS
Voltage level (V) CS per turn Current (A)
Eddy Current (A)
390.67 131.8 1030
600 199.5 1582
840 273.6 2322
1000 344 2736
2000 696 5370
[image:3.612.50.302.476.686.2] [image:3.612.332.553.493.675.2]International Journal of Emerging Technology and Advanced Engineering
Website: www.ijetae.com (ISSN 2250-2459, Volume 2, Issue 3, March 2012)466
D. Comparison of Practical and ANSYS Simulation:
Fig.6 shows the comparison between ANSYS and experimental induced current results performed at 600V CS discharge.
Fig.6. Experiment results with ANSYS simulation
IV. VESSEL CURRENT DUE TO DISCHARGE IN MULTILAYER
CENTRAL SOLENOID
Comparison of Practical and ANSYS Simulation:
Fig.7 shows the comparison between ANSYS and experimental induced current results performed at 500V CS discharge.
Fig.7. Experiment results with ANSYS simulation
TABLEVI
SET OF READINGS
Voltage level (V) CS per turn Current (A) Eddy Current (A)
100 8.42 249.3
200 17.38 545
300 26.12 847
400 35.12 1141
500 44.2 1429
600 53.2 1705
700 62.9 2013
800 72 2302
900 80.8 2598
1000 89.8 2887
1100 98.3 3179
V = volt, A = ampere, CS = Central Solenoid
TABLEV
CENTRALSOLENOIDMODULEMAJORDIMENSIONS
No. of Coils 2
No. of turns per coil 67
Spacing Between two coil 1.80mm
Length of CS coil 285mm
Inner most Diameter of CS coil 112.15mm
International Journal of Emerging Technology and Advanced Engineering
Website: www.ijetae.com (ISSN 2250-2459, Volume 2, Issue 3, March 2012)467
V. CONCLUSION
Pulse discharge either in coil or central solenoid will induce currents in vessel due to change in magnetic field. Simulation and experiment for a typical disruption scenario is performed. During this experiment pulse power supply for central solenoid is established. Electrical simulation using PSCAD assures the performance of the power supply used. Rogowski coils as magnetic diagnostics are also tested and put on the experiment to measure induced currents in the toroidal vessel.
By using power supplies and MDs, experimental results of induced currents in vessel are estimated. Simulation using FE ANSYS is carried out for the same experiment. The experiment result and the FE analysis using ANSYS result is in good agreement.
References
[1] J. G. Bak, S.G. Lee, E.M. Ka and the KSTAR team , Per formance test of vessel current monitor s for KSTAR National Fusion Research Institute, Daejeon, KOREA, 35th EPS Conference on Plasma Phys. Hersonissos, 9 - 13 June 2008 ECA Vol.32D, P-4.096 (2008)
[2] D. A. Gates, J. E. Menard, and R. J. Marsala, Vessel eddy current measurement for the National Spherical Torus Experiment Review of Scientific Instruments. Volume 75, Number 2, December 2004
[3] P.Shcherbakov, E. Fischer, R. Kurnyshov, 3D Magnetic field and eddy loss calculations for iron dominated accelerator magnets using ANSYS compared results of noncommercial codes. Proceedings of EPAC 2006, Edinburgh, Scotland WEPLS094
[4] Joel H. Schultz, Timothy Antaya, Jun Feng, Chen-Yu Gung, Nicolai Martovetsky, Joseph.V. Minervini, Philip Michael, Alexi Radovinsky, Peter Titus, The ITER Central Solenoid, Plasma Science and Fusion Center, 185 Albany St., Cambridge, MA 02139 USA
[5] J. Wesson, Tokamaks, Third Edition (Oxford University Press, New York, 2004).