A Study on the Development Direction of a Tire Using
Objective Evaluation and Analysis Techniques
Nam Woong Kim1,*, Haeng Muk Cho2
1NENEN R&D Center, 201 Gukgasandanseo-ro, Korea
2A Division of Mechanical and Automotive Engineering, Kongju National University, Korea
Copyright©2019 by authors, all rights reserved. Authors agree that this article remains permanently open access under the terms of the Creative Commons Attribution License 4.0 International License
Abstract
This study examines the characteristics of the steering stability performance of a vehicle with varying tire cornering stiffness. The vehicle and its front and rear tire models, which are the basis of simulation, were fabricated using SPMM and Flat Trac, respectively. Tire cornering stiffness of the front and rear wheels was modulated by changing the LKY, one of the scaling coefficients in the tire model. Steering stability performance evaluation is based on frequency response (ISO7401)[1] which can analyze the dynamic characteristics of the vehicle with varying steering input cycle and Steady State Speed (ISO4138)[2] which enables dynamic analysis of the vehicle with varying transient inputs. The results were analyzed by using measurement assessment factors with high correlation with actual stiffness evaluation. As a result of the evaluation, it was confirmed that the steering and stability performance of the vehicle increase when the cornering stiffness of the front wheel is increased and the cornering stiffness of the rear wheel is decreased, which has enabled us to identify the direction of development of real tires. It is expected that this study will be a starting point to improve the efficiency of the research and development to identify the cause of the decline of the running performance of the tires and the way to enhance it.Keywords
Objective Handling, Tire Model, Frequency Response, Steady State Circle, Steering Performance, Stability Performance1. Introduction
It is no exaggeration to say that the steering stability of the vehicle is the largest part of the performance that ordinary drivers can feel. In addition, since the steering stability performance is closely related to safety issues, automakers, tire companies are constantly investing time in
R & D to satisfy the performance. Steering stability is determined by the dynamic behavior of the vehicle and varies greatly with tire performance changes of tires. Generally, it is difficult to predict the performance before the actual test, so various simulations and indoor evaluations are used to predict the results and researches on the relationship with actual vehicles are also under way. In this study, the cornering stiffness of the front tires and the rear tires were set as design variables to improve the steering stability performance while the steering input cycle change test and the transient input test were conducted through simulations. The analysis of the dynamic characteristics of the vehicle utilized some key parameters of the “4 parameter methods” [3], [4], [5] as well as key factors of the “target setting evaluation method”, which was studied internally in the past. [6]
2. Tire Model Configuration of Vehicle
2.1. Test Vehicle
The vehicle required for this study is a small SUV model, the main specifications of which are as shown in the Table 1. Kinematic parameters (alignment, roll center, wheel center displacement) and compliance characteristics (lateral, alignment torque, longitudinal, etc.) required for vehicle model configurations were applied to the modeling of multi-body dynamics simulator using SPMM equipment. Engine, power train and external parameters that are not required for vehicle dynamic characterization were excluded from this model configuration.
2.2. Test Tire
Overall Length 4697mm Overall Width 1923mm Overall Height 1624mm Wheel Base 2807mm Tread (Front) 1550mm Tread (Rear) 1550mm Weight 1770kg
Table 2. Tire information
Category Front Tire Rear Tire Width 235mm 255mm Aspect Ratio 55 50
Diameter 18inch 18inch
3. Performance Evaluation
In this paper, the performance evaluation is carried out by using “Frequency Response” test and “Steady State Speed” test, which are mainly used for steering stability evaluation while the change of steering stability performance is compared through comparison of major factors.
3.1. Evaluation Condition: Frequency Response
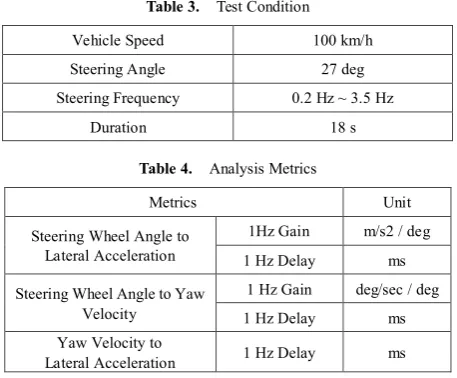
In order to analyze the dynamic characteristics of the vehicle while varying the steering input cycle, ISO7401 was used and the analysis was divided into time domain and frequency domain. The detailed evaluation conditions such as vehicle speed, lateral acceleration (steering angle), steering cycle and the like can be changed and evaluated within the scope of the specification under the regulations depending on the judgment of that who conduct the test. In this study, the same test conditions as in Table 3 were used. Figure 1 shows the input values as a graph.
In this test mode, the response of the vehicle was divided into three sections to analyze the dynamic characteristics of the vehicle. Table 4 shows the analysis items. Each item consists largely of Gain and Delay, and
[image:2.595.65.284.85.266.2]interval assumes normal operating conditions, and in some cases, 0.2 Hz or 1.5 Hz interval is analyzed.
Table 3. Test Condition Vehicle Speed 100 km/h Steering Angle 27 deg Steering Frequency 0.2 Hz ~ 3.5 Hz
Duration 18 s
Table 4. Analysis Metrics
Metrics Unit Steering Wheel Angle to
Lateral Acceleration
1Hz Gain m/s2 / deg 1 Hz Delay ms Steering Wheel Angle to Yaw
Velocity
1 Hz Gain deg/sec / deg 1 Hz Delay ms Yaw Velocity to
Lateral Acceleration 1 Hz Delay ms
3.2. Evaluation Condition: Steady State Speed
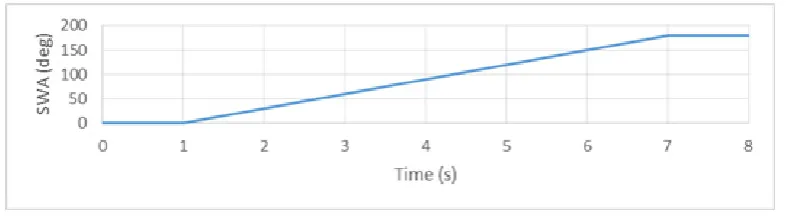
[image:2.595.307.536.126.315.2]ISO4138 is used to analyze the dynamic characteristics of the vehicle with varying transient input, and the Steady State Speed is basically included in the steady state circle. Steady state circle is classified into a steady state angle that increases the speed with the steering wheel angle fixed and a steady state radius, which increases the speed and steering wheel angle with fixed turning radius, and a steady state speed which increases the steering wheel angle with fixed speed. This study utilized the same test conditions as shown in Table 5. The input values are shown in Fig. 2 as a graph.
Table 5. Test Condition
Vehicle Speed 100 km/h Steering Angle 0 deg to 180 deg Steering Input Speed 30 deg/sec
[image:2.595.314.528.498.560.2]Duration 8 s
[image:2.595.101.499.598.703.2]Figure 2. Steering Input
In this test mode, items related to stability can be mainly analyzed among the dynamic characteristics of the vehicle. Table 6 shows the analysis items. The maximum grip and steer characteristics of the vehicle and the performance harmonies of the front and rear wheels can be identified.
Table 6. Analysis Metrics
Metrics Unit Steering Wheel Gradient deg / m/s2
Side Slip Gradient deg / m/s2 Maximum Lateral Acceleration m/s2
Front Axle Slip Angle(4 m/s2) deg Front Axle Slip Angle(7 m/s2) deg Rear Axle Slip Angle(4 m/s2) deg Rear Axle Slip Angle(7 m/s2) deg
3.3. Evaluation Condition: Tire characteristics
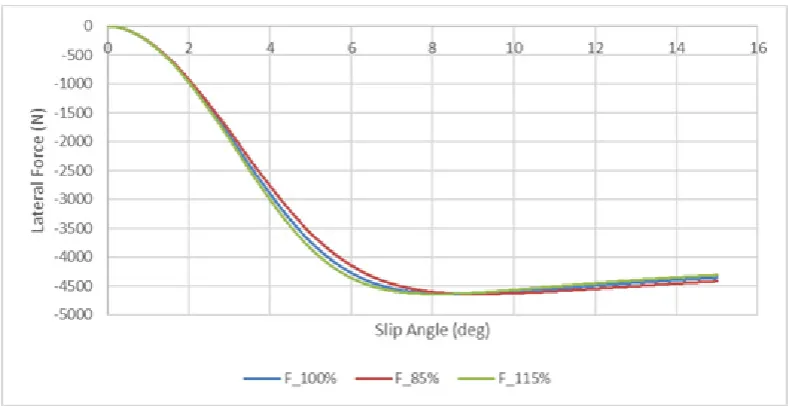
Prior to this study, three design conditions were selected first for semi-finished tires (steel belt angle, cap ply step number, bead filler height), and the trend of performance change in a single tire under varying conditions was identified through Force & Moment evaluation. Tire design conditions and F&M results were analyzed through analysis of variance. Cornering stiffness,
[image:3.595.307.532.369.525.2]which showed the most significant difference, was set as a design factor. Cornering stiffness is the lateral force that occurs when the tire slip angle is 1 degree. The cornering stiffness is proportional to the lateral force. Larger cornering stiffness values indicate that the lateral force is performing better. The cornering stiffness, which is set as the design factor, is increased or decreased as shown in Table 7 to create total 9 conditions, on the basis of which simulations were carried out. Performance changes were analyzed based on 100% of front wheel and 100% of rear wheel, and other parameters were not changed.
Table 7. Tire Condition
Cornering Stiffness (F) Cornering Stiffness (R)
115%
115% 100% 85%
100%
115% 100% 85%
85%
115% 100% 85%
Figure 3. Front Tire Cornering Stiffness
Figure 4. Rear Tire Cornering Stiffness
4. Performance Analysis
4.1. Frequency Response
The frequency response is used to quantitatively measure and analyze the response of the vehicle to the frequency change input. It is easy to understand that when steering is inputted into the vehicle at various frequency of sinusoidal wave, each characteristic of the vehicle responds at the same frequency with a certain size and specific phase angle with respect to the input. The frequency response is used mainly for the phase (represented by Gain or Amplitude) and the response time (represented by seconds or dB). The basic response characteristics of vehicle can be simply expressed as follows.
Steering Wheel Torque → Steering Wheel Angle →
Front Axle Slip Angle → Yaw Velocity → Rear Axle
Slip Angle → Lateral Acceleration → Roll Motion
Figure 5. Steering Wheel Angle to Lateral Acceleration Section
[image:5.595.102.498.349.583.2]Figure 7. Yaw Velocity to Lateral Acceleration Section
As in the above analysis, the cornering stiffness combination of the rear wheels was evaluated while increasing or decreasing the cornering stiffness of the front wheels. Table 8 summarizes the results.
The results show that the response performance of the front and rear wheels is the best when the cornering stiffness of the front wheel is reduced and the cornering stiffness of the rear wheel is increased. The SWA-Latac section showed 120%, the SWA-YawR section showed 117%, and the YAWR-Latac section showed 123% in a performance improvement, respectively. Although the gain values of SWA-Latac and SWA-YawR are small, it is negligible considering that the delay performance weight is high. As a result, we can identify that the performance matching or balance between the current vehicle and the original tire is not correct. In addition, it was found that the tires of the front wheels should be reduced in stiffness and the tires of the rear wheels should be increased in stiffness by changing the tire structure and compound in order to improve the performance.
Table 8. Frequency Response Test Result
F
(%) (%) R
SWA To LATAC
SWA To YAWR
YAWR to LATAC 1 Hz
Gain Delay 1 Hz 1 Hz Gain Delay 1 Hz Delay 1 Hz
115
115 0.068 74.69 0.143 33.18 41.52 100 0.069 86.01 0.161 35.58 50.47 85 0.07 102.8 0.186 42.84 60.05
100
115 0.065 71.76 0.136 30.64 41.13 100 0.066 82.59 0.153 32.57 50.06 85 0.067 98.74 0.177 39.17 59.66
85
115 0.061 68.36 0.128 27.7 40.67 100 0.062 78.62 0.143 29.07 49.59 85 0.063 93.97 0.166 34.86 59.21
4.2. Steady State Speed
[image:6.595.89.506.486.671.2]Figure 8. XY Plot : Steering Wheel Angle – Lateral Acceleration
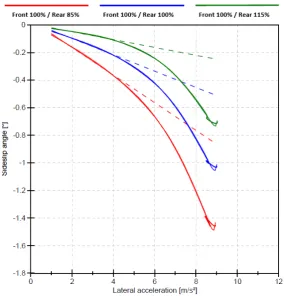
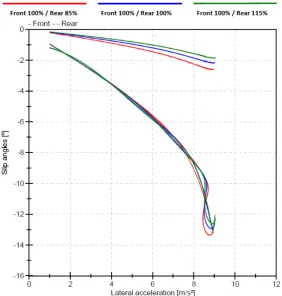
[image:7.595.155.441.407.703.2]Figure 10. XY Plot : Front, Rear Axle Slip Angle – Lateral Acceleration
Table 9. Steady State Speed Test Result
F
(%) (%) R SWA Grad Side Slip Grad Max LAT
115
115 12.7 0.03 9.03 100 13.38 0.06 8.99 85 14.04 0.1 8.92
100
115 12.76 0.03 9.03 100 12.24 0.06 9.01 85 12.46 0.1 8.94
85
115 14.57 0.03 8.93 100 13.79 0.06 8.94 85 12.74 0.1 8.95
F
(%) (%) R
Linear Non Linear F/A
Slip A. Slip A. R/A Slip A. F/A Slip A. R/A
115
115 3.38 0.63 6.57 1.28 100 3.43 0.75 6.74 1.53 85 3.4 0.9 6.72 1.82
100
115 3.58 0.62 6.98 1.27 100 3.55 0.74 7 1.52 85 3.59 0.9 6.96 1.82
85
[image:8.595.89.505.416.758.2]As in the above analysis, the cornering stiffness combinations of the rear wheels were evaluated while increasing or decreasing the cornering stiffness of the front wheels. Table 9 summarizes the results. For the axle side slips of the front wheels and the rear wheels, the analysis was conducted on two split sections, which are the linear section (4m / s2) and the non-linear section (7m / s2).
As a result of the analysis, it is identified that decreasing the cornering stiffness of the front tire and increasing the cornering stiffness of the rear tire exhibit the understeer characteristics as compared with the original tire. The maximum grip generally follows the compound characteristics, and the simulation results are shown to be reasonable because the evaluation only changed the simple cornering stiffness. Also, it is generally considered that the neutral steering characteristic is better because it follows the driver's input, but the neutral steering characteristic is not absolutely safe at high speed in terms of the vehicle and the tire. This is because the higher the speed, the greater the force to be handled at the rear tires. In order to improve the stability of the vehicle, it is desirable to have understeer characteristics. Of course, it should be assumed that there is no trade-off for other performance of the vehicle. This test allows you to set the development direction as in the Frequency Response Test results.
5. Conclusions
In this paper, we discuss the performance characteristics of steering stability of a vehicle varying to changes in tire cornering stiffness. The Frequency Response and the Steady State Speed simulation evaluation were performed to quantitatively confirm the steering, response, and safety performance of the vehicle. It is confirmed that all the performance is improved when the cornering stiffness of the front wheel is lowered and the cornering stiffness of the rear wheel is increased. It is possible to set the development direction of the tire through this, and it is expected that the improvement of steering stability performance will be achieved if it is reflected in the business. This study is focused on improvement of steering stability performance and development direction setting according to changed tire design parameters. In the future, it is planned to reflect the simulation results in actual tire development and to conduct correlation studies with actual vehicle results.
REFERENCES
ISO 7401:2011 Road vehicles -- Lateral transient response [1]
test methods -- Open-loop test methods
ISO 4138:2012 Passenger cars -- Steady-state circular [2]
driving behaviour -- Open-loop test methods
T. Mimuro, M. Ohsaki, H. Yasunaga and K. Satoh, Four [3]
Parameter Evaluation Method of Lateral Transient Response, SAE Technical paper 901734, 1990.
J. Sun woo, K. Sumin, L. Chibum, A Study on Evaluation of [4]
Handling Performance for KSAE Electric Car Using 4 Parameter Evaluation Method, Transactions of KSAE, Vol. 25, No.4, pp.448-456, 2017.
D.A. Crolla, R.P. King, H.A.S Ash, Subjective and [5]
Objective Assessment of Vehicle Handling Performance, Seoul 2000 FISITA World Automotive Congress, June 12-15, 2000.
N. W. Kim and H. M. Cho, Analysis of performance [6]
correlation of subjective and objective evaluation of tire and vehicle, International Journal of Mechanical Engineering and Technology, Volume 10, Issue 04, 349-357, 2019. K. Jungsik, K. Youngtae, Yoon. Yongsan, Analysis of [7]
Transient Maneuvers for Objectifying Evaluation of Vehicle Stability, Transactions of KSAE, Vol. 14, No. 1, pp.167-175, 2006.
D. McRue, R. Klein, Effect of Automobile Steering [8]
Characteristics on Driver/Vehicle Performance for Regulation Tasks, SAE Technical Paper 760778, 1976. Shoichi Sano, Yoshimi Furukawa and Yasuhei Oguchi, [9]
Effect of Vehicle Response Characteristics and Driver’s Skill Level on Task Performance and Subjective Rating, Eighth International Conference on Experimental Safety Vehicle, 1980.
J1441:201609 Subjective Rating Scale for Vehicle [10]
Handling
N.R., Draper, Applied regression analysis bibliography [11]
update 1994-97, Communications in Statistics-Theory and Method, Vol. 27, pp 2581-2623, 1998.
J., Kmenta, Elements of econometrics 2nd ed., University [12]
of Michigan Press, USA, 1997.
M.G., Kendall, et al., Kendall’s advanced theory of [13]
statistics 6th ed., Halsted Press, London, 1994
Jolliffe, I.T., A Note on the use of Principal Components in [14]
Regression, Applied Statistics-Journal of the Royal Statistical Society Series C, Vol.31, No.3, pp. 300-303, 1982.
Mikael Nybacka, Xuxin He, Zhicheng Su, Links Between [15]