Journal of Chemical and Pharmaceutical Research, 2014, 6(7):256-261
Research Article
CODEN(USA) : JCPRC5
ISSN : 0975-7384
Study of the structure of inter-organization innovation network
based on grey relational analysis
Shan Haiyan
1,2and Ji Zhonghui
21China Institute of Manufacturing Development, Nanjing University of Information Science & Technology, Nanjing,
China
2School of Economics and Management, Nanjing University of Information Science & Technology, Nanjing, China
____________________________________________________________________________________________
ABSTRACT
Inter-organization cooperation and innovation is increasingly common. However as the limitation of information, the members in the innovation network cannot evaluate each other when they need to choose cooperators. In this paper, a new type of inter-organization innovation network which comprises preferential attachment and preferential deletion based on grey relational analysis is studied. A series of simulations and analysis of average path length and clustering coefficient are conducted. To be specifically, grey relational analysis can help organizations in choosing cooperators. By simulation analysis, we compare the inter-organization innovation network in the steady state based on grey relational analysis with the random network and regular network, we find that such innovation network has the property of ‘small world’, which can demonstrate that evolution model of innovation network based on grey relational analysis is reasonable.
Keywords: innovation network, network structure, small-world, grey relational analysis, inter-organization.
____________________________________________________________________________________________
INTRODUCTION
Networks are ubiquitous in nature and society, describing various complex systems, such as the Internet, food webs, or blood vessels[1]. Despite their diversity, most networks appearing in nature follow universal organizing principles. Particularly, many networks are ‘small-world’, which are highly clustered and having small path lengths[2]. The high interest in understanding the topology of complex networks has resulted in the development of a considerable number of network models.
Watts and Strogatz (1998) found that real systems are highly clustered, like regular lattices, yet have small characteristic path lengths, like random graphs, i.e., ‘small-world’ networks[2]. They consider the following random rewiring procedure: starting from a ring lattice with n nodes and k edges per node, they rewire each edge at random with probability
p
. This construction allows us to ‘tune’ the graph between regularity (p
=
0
) and disorder (p
=
1
), and thereby to probe the intermediate region0
< <
p
1
. They discover that for smallp
the network has the ‘small-world’ phenomenon.However, the rewiring probability couldn’t be random, which may not only depend on the connectivity of those nodes but also on the relevance with each other. How to rank the relevance with the members is a difficult problem. Grey relational degree analysis can determine the relevance between different organizations with less information available.
construction of such network[3, 4]. However, they ignore the fact that the members in the innovation network can not derive fully information to evaluate each other when they need to choose cooperators. They often derive little information. How to solve this problem? Grey system theorem is used to determine the unknown system by little known information which is proposed by Professor Deng Julong in 1982[5]. There are no strict requirements of the sample size and the sample distribution. At present, grey system theorem has a wide range of applications in many fields[6, 7], however little research has been made in the applications of complex network.
In this paper, we construct the evolution model of innovation network mainly based on grey relational analysis which is devoted to study and deal with complex system by not completeness information. Each time organizations in the innovation network need to evaluate the members in the network with little known information. Then each organization decides the cooperators in the next time by the grey relational degree analysis and connectivity rather than by random selection which is much more close to the reality. By simulations, we derive that the innovation network in the steady state has the property of ‘small-world’. In reality, such innovation network really has the ‘small-world’ property which can demonstrate that evolution model of innovation network based on grey relational analysis is reasonable.
2. Evolution model based on grey relational analysis 2.1 Description of some notations
Let
N
=
{1, 2,
L
, }
n
denote a finite set of organizations in the innovation network. For anyi j
,
∈
N
, define the binary variableχ
t( , )
i j
to take the valueχ
t( , )
i j
=
1
if a connection exists betweeni
andj
in periodt
, andχ
t( , )
i j
=
0
otherwise. If two organizations are willing to innovate together, then there exists a connection between the two. The set of organizationi
’s all collaborators in periodt
can be defined by,
{
|
( , )
1}
i t
j
N
χ
ti j
Γ = ∈
=
. The number of organizationi
’s all collaborators in periodt
can be defined by,
( , )
i t t
j N
k
χ
i j
∈
=
∑
, which can also be called the degree of organizationi
.Each organization in the innovation network has a certain feature set which is related to industry property, development direction and so on. Suppose each feature vector is characterized by
K
indicators. Sometimes the indicators are time serial numbers or index numbers andx
i denotes organizationi
’s feature vector. We represent this as a vector of lengthK
≥
2
, which allows us to think of each organization as located at a point in the feature space.2.2 Construction of the evolution model
We will construct the evolution model of the inter-organization innovation network based on grey relational analysis in this section.
Following is the evolution algorithm of the innovation network.
Step 0 Initialization.
As the organizations initially may not be familiar with each other in the innovation network, suppose each organization chooses those who are nearest to it to cooperate in the initial time[8, 9].
Step 1 Evaluation process.
In period
t
, organizationi
need to evaluate all the other members in the innovation network, such as from the view of relevance with itself. Take an example with organizationj
(j
∈
N
andj
≠
i
) , according to the grey relational analysis, the correlation between organizationi
and organizationj
(j
∈
N
andj
≠
i
) areevaluated. To be specifically, the grey relational coefficient between
x
i andx
j (i j
,
=
1,
L
,
n
,i
≠
j
) at the indicator ofk
is defined as,
min min ( ) ( ) max max ( ) ( ) ( )
( ) ( ) max max ( ) ( )
i j i j
j k j k
i j
i j i j
j k
x k x k x k x k k
x k x k x k x k
ξ ε
ξ
′ − ′ + ′ − ′
=
′ − ′ + ′ − ′
(1)
( ) min ( ) ( )
max ( ) min ( )
i i i i i i i i
x k x k
x k
x k x k
− ′ =
− (2)
By Eq.(2) we can transfer
x
i t,( )
k
into[0,1]
,x
i t′
,( )
k
is the interval value ofx k
i( )
and has no dimensions[10].The grey relational degree between organization
i
and organizationj
is obtained as follows, ,
1
1
( )
n
i j i j
k
k
n
γ
ε
=
=
∑
,i j
,
=
1,
L
,
n
,i
≠
j
(3)Step 2 Preferential attachment.
In reality, the organizations are willing to collaborate with those much richer or much more relevant[11, 12]. One example is Apple Inc. which has a large number of cooperators such as suppliers, developers, OEMs and so on. Maybe many companies in the world are still willing to cooperate with it other than cooperate with those having few cooperators. Another example is mobile phone manufacturers, they may cooperate with operators and software developers. There is less possibility for mobile phone manufacturers to cooperate with medical teams or housekeeping servers. As for the limitation of information acquirements and communication capability, organizations in the network may not grasp the whole members’ information. Most cases, it only obtains a part of them.
In period
t
+
1
, organizationi
decides to cooperate with organizationj
in the innovation network using a preferential attachment with probabilityP
ij ta, 1+ , which is defined by, ,
, 1
,
(
,)
i j j t a
ij t
i j j t j N j N
k
a
P
k
a
γ
γ
+ ∈ ∈+
=
+
∑
∑
(4)where
k
j t, denotes the degree of the organizationj
in periodt
anda
( 0)
≥
is a constant here we call it tunable parameter. In the original Barabási–Albert scale-free model, a is equal to zero[12]. Here we use grey relational degree to analyze the correlation between different nodes.Eq.(4) means that the organization may cooperate with those which have higher relevance with itself or have more cooperators in the innovation network.
Step 3 Preferential deletion.
As the organization’s ability is limited, to establish a cooperative relationship between organizations should pay a certain cost, such as time cost, energy cost and psychological cost. The number of organization’s collaborators could not increase without limit. On the other hand, the organizations do not randomly select the abandon one[13]. Usually they make a judgment based on their collaborators’ market share, development prospects and so on. For example, before 2007 Apple Inc. had been using the chips of IBM. However for the IBM chips’ heat dissipation problems as well as the performance of the recession, Apple eventually “abandoned” the cooperator IBM who had cooperated with it for ten years to establish cooperation with Intel.
Thus this paper assumes that if an organization decides to cooperate with a “new” organization, it will selectively “abandon” one of the original partners. Suppose in period
t
+
1
, organizationi
gives up one of its partners in periodt
, such as organizationj
, with the probabilityP
ij td, 1+ ,which is defined by,
, ,
, 1 ,
, ,
( )
(1 ) ( 1)
( )
i t
j t i j d
ij t i t
j t i j j k a P k k a γ γ + ∈Γ + = − − +
∑
(5)Eq.(5) means that the organization may abandon those which have lower relevance with itself or have fewer cooperators in the innovation network.
Step 4 Evolution mechanism.
If all the organizations in the innovation network are unwilling to change their partners, we call the network reaches the steady state.
Every time, choose one organization to change its partners according to step 2 and step 3. Then go to Step 1-3 until the innovation network reaches the steady state.
2.3 Analysis of the evolution model 2.3.1 Some definitions
Path length measures the typical separation between two nodes in the network. Average path length
L
is defined as the number of edges in the shortest path between two nodes, averaged over all pairs of nodes.1
(
1)
i j S ijL
d
N N
≠ ∈=
−
∑
where
d
ij is the shortest distance between nodei
and nodej
[14].The clustering coefficient
C
is defined as follows.Suppose that a node
i
hask
i neighbors, then at mostk k
i(
i−
1) 2
edges can exist between them (this occurs when every neighbor ofi
is connected to every other neighbor ofi
). LetC
i denote the fraction of these allowable edges that actually exist.2
(
1)
i i
i i
E
C
k k
=
−
where
E
i denote the actual number of edges.Define clustering coefficient
C
as the average ofC
i over alli
[14]1
1
N i iC
C
N
==
∑
2.3.2 Data selection and processing
In this section, the original data are randomly generated. We choose eight indicators from 50 organizations to reflect the relevance (Ki, i=1,2,…,8), where K1-R&D Investment, K2-personnel number of R&D, K3-activities of R&D, K4-proportion of R&D investment in sales revenue, K5-number of patent application, K6-number of holding patents, K7-sales revenue of new products, and K8-proportion of sales revenue of new products in all sales revenue. In fact, each data can be the average over time. As each data cannot be compared directly, we need to dimensionless the original data. It is noted that different generation results of original data will not affect the representation of the following simulation results.
Set
ξ
=
0.5
and the weights of each index are equal to (0.16, 0.13, 0.08, 0.11, 0.07, 0.24, 0.10, 0.11) by using expert investigation method. Then we can compute the grey relational degree between each organization.Due to space limitation, here we only give the grey relational coefficient between organization 1 and other
organizations, that is to say we need to take
x
1 as a system characteristic sequence. The results are 0.6344, 0.7208, 0.6226, 0.6224, 0.5473, 0.6549, 0.7549, 0.6020, 0.5871, 0.6737, 0.5340, 0.5793, 0.5749, 0.5729, 0.6074, 0.5665, 0.7344, 0.6750, 0.6250, 0.6915, 0.6791, 0.7218, 0.7780, 0.6765, 0.6279, 0.7576, 0.7178, 0.6557, 0.6797, 0.6821, 0.6629, 0.6271, 0.6193, 0.7279, 0.5896, 0.5373, 0.6406, 0.5758, 0.5981, 0.6415, 0.7075, 0.6641, 0.6925, 0.6347, 0.6150, 0.6464, 0.6080, 0.6328, 0.6099.shown in Figure 1.
Figure1. Network structure under the initial state (regular network)
2.3.3 Simulation analysis
Average path length and clustering coefficient are two important indicators to analyze whether the network has ‘small world’ properties. We know regular network has larger average path length and clustering coefficient, while the random network has smaller ones[15]. Generally, if the network’s clustering coefficient is far greater than random network’s and average path length is equivalent to random network’s, then the network has the ‘small world’ phenomenon[16].
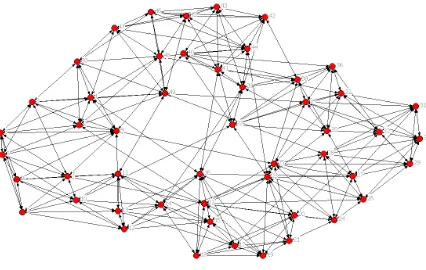
Figure 2 shows the network structure generated by grey relational analysis under the steady state. Table 1 compares the network with the regular network and random network. We derive that the average path length produced by our
model is only slightly larger than the random network’s which is calculated by
log( )
log(
)
R
N
L
k
=
< >
. On theother hand, the clustering coefficient by our model is far greater than the clustering coefficient of the random
network’s which is calculated by
C
Rk
N
< >
[image:5.595.196.409.453.588.2]=
. Thus the network structure under the steady state has the property of ‘small-world’. [image:5.595.150.462.642.686.2]Figure 2. Network structure under the steady state (small-world network)
Table 1. The comparisons of the three networks
Network
Indicator Innovation network Random network Regular network
Average path length 2.229 1.8813 3.571
Clustering coefficient 0.53 0.16 0.643
CONCLUSION
which is proposed by Professor Deng Julong in 1982. There are no strict requirements of the sample size and the sample distribution.
At present, grey system theorem has a wide range of applications in many fields. In this paper, we try to build inter-organization innovation network model by means of grey relational analysis and analyze the structural characteristics of innovation network by the method of computer simulation. It is found that the innovation network in the steady state has the property of ‘small-world’, although we suppose it is the regular network in the initial time. In fact the innovation network in the reality indeed has such property. That is to say grey system theorem can be used for the analysis of complex network. In further study, we will proceed to consider the application of grey system theory in complex network.
Acknowledgements
This work is supported by Ministry of Education, Humanities and Social Science Project (13YJC630018), National Natural Science Foundation of China (71171116), Jiangsu Province Government Grant to Study Abroad and the Priority Academic Program Development of Jiangsu Higher Education Institutions(PAPD).
REFERENCES
[1]. M E J Newman. SIAM Review, 2003, 45(2), 167-256. [2]. D J Watts; S H Strogatz. Nature, 1998, 393(684), 440-442.
[3]. D Harrisson; M Laberge. Journal of Management Studies, 2002, 39(4), 497-521.
[4]. P A Gloor; M Paasivaara; D Schoder, et al. International Journal of Production Research, 2008, 46(5), 1357-1371.
[5]. D Julong. Systems & Control Letters, 1982, 5, 288-294. [6]. D Julong. The Journal of Grey System, 2009, 21(1), 1-4.
[7]. D Julong. Introduction to grey mathematical resource science. Press of Huazhong University of Science & Technology, Wuhan, 2007.
[8]. R Cowan; N Jonard. Journal of Economic Dynamics and Control, 2004, 28(8), 1557-1575.
[9]. Z Bing; W Wen-ping, Qing-song M. Journal of Industrial Engineering/Engineering Management, 2008, 22(4), 62-64.
[10]. D Julong. Basis of Grey System. Press of Huazhong University of Science and Technology, Wuhan, 2002. [11]. S Hai-yan; W Wen-ping; W Jiao-li. Journal of System Simulation, 2011, 23(1), 80-84.
[12]. A-L Barabási; R Albert. Science, 1999, 286(5439), 509-512.
[13]. K Deng; H Zhao; D Li. Physica A: Statistical Mechanics and its Applications, 2007, 379(2), 714-726. [14]. D J Watts. American Journal of Sociology, 1999, 105(2), 493.