Fault Detection using Unsupervised Feature
Learning on Big Data Based on Improved
Weighted SoftMax Regression with Jaya
Optimization
Sangram Keshari Swain, Srinivas Prasad, M. Vamsi Krishna
Abstract: Intelligent fault detection is promising to deal with big data due to its ability in rapidly and efficiently processing collected signals and providing accurate detection results. In traditional fault detection methods, however, the features are manually extracted depending on prior knowledge and diagnostic expertise, such processes take advantage of human ingenuity but are time-consuming. Inspired by the idea of unsupervised feature learning artificial intelligence techniques are used to learn features from the raw data.As the dimensionality increases, the accuracy of fault identification methods implemented on big data decreases significantly. For supervised learning, large volume of data is needed which leads to high cost and time consuming. In this paper, an unsupervised learning approach is proposed on the basis of weighted softmax regression for fault detection using the power signals. In the proposed approach, the features are extracted from the unlabelled data. The developed approach is based on squirrel search algorithm and voting based weighted softmax regression with jaya optimization algorithm (IWSRJO_SSA). The proposed approach is simple and easy to carry out, though it attains high accuracy when compared to that of more advanced techniques. The features from the signals are extracted normally and some of the best features are selected using the squirrel search algorithm (SSA). Because of selecting the best features and using the improved weighted softmax regression, the proposed method achieves high accuracy in fault detection. Experiment on the power signal dataset shows the applicability of the proposed approach in fault detection on big data. The proposed system will be applicable on medical field, industrial field, electrical field and so on. The experimental results prove that the proposed method attains high accuracy and is superior to the other advanced methods.
Keywords: Big data, squirrel search algorithm, improved weighted softmax regression, jaya optimization algorithm, unsupervised learning.
I. INTRODUCTION
In the big data era we are present now with the data in an explosively growing state. A research report was published by McKinsey Global Institute in May 2011, termed Big Data: The ensuing lead based on invention, competition, and production. From this report it’s known that big data has entered into day to day life and slowly develops into a vital factor in production.
The Productivity and excess consumers are developed by the application of massive data. The challenges regarding the ability of data controlling has been fetched by the big data’s arrival. To utilise the data’s value, to avoid the trouble of 'data grave', to search for another or yet other deployment through immense data, as well as to establish a defensible viable benefit, are not only confronts that every business firms deals with, but likewise the possibilities they gain. In 1989 the discovery of Knowledge in database was described, as a crucial method of detecting effective, new, hypothetically suitable also final logical forms from a data set. In the recent years many analyses was based on the fault diagnosis [1][2]. Particularly for the complex systems sensible exposures on the arising issues are essential, moreover priceless time is saved along with the expense to accept the right tactics to evade risky conditions. The fault diagnosis approaches generally can be grouped into model-based, signal-model-based, knowledge-based and hybrid/active techniques [3]. The approaches which are of knowledge-based can be so-called data-driven approaches, which need a huge quantity of historical facts to determine the liable means based on the systems deprived of priori identified models or signal patterns. For the complex systems they are very appropriate and are complicated to form the specific models or signal symptoms. Recently the production in a smart way is enhancing, and the data in firm can be congregated at a faster rate [4] and also more extensively than ever before. For the fault diagnosis of data-driven approaches offers new prospects ways to exploit the use of the huge mechanical data [5], and has obtained ever further awareness as of the investigators and engineers. Serious consequences are brought by the denial of small performance or security risks. It is extremely vital to have an authentic diagnosis method to guarantee the reliable operation of the equipment. Before the big data’s arrival the prior research on fault diagnosis, commonly relied on the value of domain information, the exactness of analytic patterns, and the completeness of data samples [6]. The
mentioned approaches have easiness benefits,
interpretability besides improved progress. However they are subject to concerns in the environment, also generate an immense computation pressure while dealing with large-scale complex systems. Fault diagnosis tackles immense concerns based on industrialised big data amongst the
exponential growth of
Fault Detection using Unsupervised Feature Learning on Big Data Based on Improved Weighted SoftMax
Regression with Jaya Optimization
is problematical to use the earlier diagnostic methods [7]. Nowadays, the process industry at present wishes for quicker, securer, also further effective strategies, in the closed loop control more functional variables are included. While this ends in a complicated process structure, which conceals process control, the in industry the occurrence Big Data massively eases process monitoring. Today from the key process variables the faults can be detected and diagnosed by using industrial Big Data [8, 9]. A process fault happens least in a single perceived variable or the systems processed parameter when there is an unpermitted deviation and the controllers will not be able to reverse. The industries vital challenge is the initial as well as the exposure and analysis of process faults to maintain a secure process and reduce the productivity loss. With the help of process monitoring these issues are addressed [10]. Into three groups the process monitoring approaches can be grouped they are model-based, knowledge-based and data-based methods. Model-data-based approaches are dependent on first- opinions that uses a physical and statistical knowledge of the process. Hence based on the new techniques they can be able to produce more perfect solutions. Knowledge-based methods on the process performance collect the information available also improve the qualitative or semi-quantitative interactions through a fundamental study by means of signed directed graphs, decision trees, pattern recognition methods. These techniques major drawback is their dependence on social awareness that provides keys that are susceptible to change. Instead, data-based process monitoring approaches do not contain any prior information, because fault detection patterns and analysis are constructed only on data [11]. Usually in the agenda of intelligent fault diagnosis there are three main steps, they are: signal acquisition, feature extraction and selection, then fault classification [12]–[14]. Extensively the vibration signals have been employed in the signal acquisition step, as the best intrinsic information about mechanical faults are provide by them. The feature extraction in the second step based on signal processing systems intends to obtain typical features from the signals [15]. While these features characterises the mechanical health conditions, they may possibly have worthless or impervious facts and spoil the results of the diagnosis along with effective computation. So to select the sensitive features through dimension reduction strategies feature selection is employed [16]. The selected features in the fault classification step, are used to train artificial intelligence techniques [17], and finally by these techniques a determined mechanical health conditions is attained. Now, the concerns of adapting the increasing data’s volume into the value is a significant problem. The subjects generally comprises two features. The initial one is in what way to analyse as well as to predict failures quickly, moreover in real-time via new processing systems. The next approach is in what way to find the ‘big’ value of big data by enhancing the prevailing approaches or else leveraging new ones [18-20].
Contribution: IWSRJO_SSA method is proposed for the fault detection on big data. Squirrel search algorithm (SSA) is implemented for the best feature selection from the
extracted features. If all the extracted features are directly used for the fault detection process, then it will be more complex. Hence, some of the features are selected by using the squirrel search algorithm. Improved Weighted Softmax Regression (IWSR) is used as a classifier and the result of this softmax regression is adjusted by back propagation method. This fine-tuning makes the entire process more robust and enhances the fault detection accuracy. In this method, the result is concluded based on the voting concept. Through the experimental results it is shown that the proposed method IWSRJO_SSA attains high accuracy of fault detection.
Organization: Rest of this paper is structured as follows. Section 2 presents the related works. In Section 3, the proposed methodology is presented. The experimental results are presented in Section 4. Section 5 presents the conclusion of the work.
II. RELATED WORKS
Several reaches are done on intellectual fault diagnosis of rotating machinery intending to promptly deal with the immense fault data which indeed offers exact diagnosis outcomes. With these surveys, frequently the approaches based on ANNs are used, which for features extraction use signal processing approaches and for classifying faults the features are given as input to ANNs. However these approaches successfully functioned in intellectual fault diagnosis of rotating machinery, they yet possess two defects. (1) The features are extracted manually based on the facts of signal processing methods and diagnostic capability. Furthermore, concurring to a specific diagnosis issue these manual features are extracted and is undoubtedly inapt for additional problems. (2) In these methods the trivial designs of ANNs are implemented, which restricts the ANNs capacity in acquiring the non-linear interactions in fault diagnosis issues. In artificial intelligence as an innovation, deep learning maintains the ability to deal with the above-mentioned shortages. Through deep learning, deep neural networks (DNNs) using the deep manners, in preference to shallow ones, might be determined to extract the valuable info from raw data and estimated complex non-linear functions. A new intellectual technique is presented by Jia[21] based on DNNs to handle the deficits of the aforesaid intellectual diagnosis approaches. The proposed methods effectiveness is authenticated with the datasets from rolling element bearings and planetary gearboxes. They contain immense dignified signals concerning distinctive health statuses in several operating states. From the results it’s realized that the method offered even though adaptively mines accessible fault physiognomies from the obtained signals, likewise attains excellent diagnosis accuracy related with the prevailing approaches. Inefficient and unreliable human analysis are replaced by the intelligent fault diagnosis techniques, intensifying the effectiveness of
fault diagnosis. The
intelligent fault diagnosis accuracy can be improved
models. A new method has been proposed by Zhang [22] named as Deep Convolutional Neural Networks with Wide First-layer Kernels (WDCNN). As input this approach uses raw vibration signals (to generate more inputs data augmentation is used), and in the first convolutional layer for features extraction and high frequency noise smothering the wide kernels are used. For multilayer nonlinear mapping, small convolutional kernels are used in the previous layers. AdaBN is implemented to increase the models domain adaptation facility. For automatic pattern recognition, Kumar [23] using RHadoop programming environment proposed an agenda based fault diagnosis by enduring the concerns presented by data inequity problem. The Fault diagnosis in a manufacturing process is a real-world example in which the topic of class-imbalance is greatly related. Foremost of the system data will present the ordinary operating qualities whereas the faulty operating behaviour is limited. Condition-based Maintenance techniques do not rightly work on such datasets and as a solution it is challenging to form consistent patterns for the precise fault diagnosis. To deal with this problem, considering the proposed frameworks initial phase, numerous methods are presented to deal with the problem of data imbalance and collective radial basis kernel SVM and the Synthetic Minority Over-sampling Technique (SMOTE) classifier is employed. Also, with out-of-date data imbalance solver methods like under-sampling and SMOTE the proposed approaches oversampling performance is compared. In this frameworks second phase, the classifier output of SVM is replaced instead of target value of dataset to become stable in nature. In the final phase to train the logistic regression for automatic pattern recognition the modified dataset is used moreover for fault prediction by means of a steel plate manufacturing dataset in RHadoop programming environment. For immediate fault detection with the detection of industrial plants, a two-stage algorithm has been propose by Costa [24]. The work is fully based on the assessment of specific features by recursive density estimation and a novel evolving classifier algorithm. The presented method for the detection phase is associated with the conception of the data space density that is not as good as probability density function, however is a suitable scope for revealing the anomaly/outliers. A Cauchy function expresses this density and can be determined frequently, that improves its memory as well as power of computation and
so, relevant to connected applications. The
identification/diagnosis stage is based on Auto Class. When
a rule base subsists, the Auto Class could possibly progress/improve it additional matched with the recently faulty state data. With the improved operating time of the sulphur hexafluoride (SF6) electrical equipment, the distinct units of discharge possibly will ensue inside the equipment. Do to this the equipment will possess severe impairment. So, to analyse the fault and state for SF6 electrical equipment it is of viable impact. In the current years, the rate of monitoring this electrical equipment’s data acquisition has been always enhanced and the collection scope has always been extended. To instantly deal with condition monitoring data of the massive SF6 electrical equipment, Hongxia [25] proposed a two-level fault diagnosis model .At first the monitoring data is pre-processed before training the fault diagnosis model, for different missing values the first and different data filling methods are implemented. Then, on the Hadoop platform the fault diagnosis algorithms are parallelized. At last, the time taken for the fault diagnosis of SF6 electrical equipment in stand-alone mode and cluster mode is related by simulation, and the benefits of cluster mode in processing massive data are verified.
III. PROPOSED METHODOLOGY
Fault Detection using Unsupervised Feature Learning on Big Data Based on Improved Weighted SoftMax
Regression with Jaya Optimization
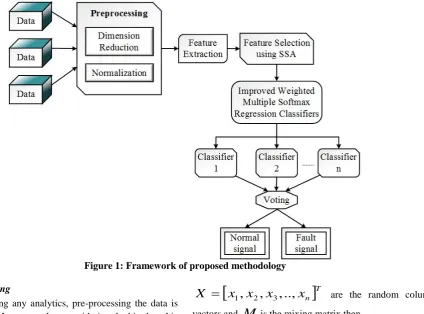
Figure 1: Framework of proposed methodology
1.1 Pre-processing
Before processing any analytics, pre-processing the data is the initial step. However, when considering the big data this important step has various challenges. One of the challenges is quality of data and in the context of big data the data quality should be highly considered. In this work dimensionality reduction and normalization processes are performed to pre-process the big data. Dimensionality reduction is performed to reduce the dimensions of the dataset whereas the normalization technique is carried out to normalize the data values into standard values. For the dimensionality reduction, the Independent Component Analysis (ICA) method is used and for normalization Z-score method is employed.
a) Dimensionality reduction
The extension of PCA (Principal Component Analysis) is named as ICA. Still the principal components are dependent due to the maximization and decorrelation of variance of data. Also for the real-time industrial process, the Gaussian distribution is followed by the hidden variables which may not be satisfied. ICA suspects that the non-Gaussian and independent restricted signals and uncorrelated signals are generated by various physical procedures which makes the ICA dominant than the PCA. Various methods of ICA are available; among them the ICA with fixed point iteration method is the most popular for finding the independent components effectively.
For ICA,
n
variablesx
1,
x
2,
x
3,
...,
x
n can be stated as the linear grouping ofk
unknown independentcomponents,
c
1,
c
2,
c
3,
...,
c
k. If
Tk
c
c
c
c
C
1,
2,
3,
..,
and
Tn
x
x
x
x
X
1,
2,
3,
..,
are the random columnvectors and
M
is the mixing matrix then,MC
X
(1)
DX
C
ˆ
is the reconstructed vector which becomes as independent as possible meanwhile a demixing matrix D is found by the ICA. For convenience the ICs have a unit variance when we make an assumption ask
equalsn
. In ICA, the observed variables arewhitened in the pre-processing step.QC
WMC
WX
Y
(2)where,
W
A
1/2V
T indicates the whitening matrix,from the eigen-decomposition of the covariance matrixT T
VAV
XX
(
)
,V
andA
are generated.Q
WM
denotes the orthogonal matrix and
1
. We couldobtain
D
fromQ
asD
Q
TW
. ThenC
is estimated asX
V
A
Q
WX
Q
Y
Q
C
ˆ
T
T
T 1/2 T (3)
2)]
(
[
)]
(
[
)
(
y
g
x
g
u
J
(4)where,the standard Gaussian variable is denoted as
u
, non-quadratic function is denoted asg
(
)
andg
(
x
)
is generally selected by Eqn. (5).)
2
/
exp(
)
(
x
x
2g
(5)b) Normalization
Z-score normalization considers a sample from the dataset and evaluates the number of standard deviations below or above it. It will return a normalized value based on the mean and standard deviation. A Z-score, or standard score, is used for standardizing scores on the same scale by dividing a score’s deviation by the standard deviation in a data set. The result is a standard score. The Z-score of a sample can be calculated by Eqn. (6).
S M X Zs
(6)
where,
X
represents the data value,M
represents the mean andS
denotes the standard deviation of all data values.1.2Feature Extraction
In this work, the features extracted from the power signals are STFT, 2-D correlation analysis, mean, standard deviation, variance, entropy and kurtosis. They are explained below.
3.2.1 Short Time Fourier Transform
STFT is the outcome of continuously multiplying the signal and the shifted short time windows and performing a Fourier Transform on it. The STFT for a signal
x
(
t
)
is defined as:
x
t
t
e
i ftdt
2)
(
)
(
f)
,
(
(7)
where, the windowing function is given as
(
t
)
. For dividing the signal into more segments, the windowing function is used and the divided signal segments are considered to be stationary. The local spectrum is the resultant spectrum of the signal and the window. For the complete range of time, to generate local spectra the localizing window is translated together with the time axis. With the same resolution, all the segments of the signal are evaluated because of the use of constant window in the STFT. Because of the constant windowing a good frequency resolution is required at the low frequency whereas, a good time resolution is required at the high frequency.The resolution oftime is proportional to the length of the windowing function while the resolution of frequency is proportional to the bandwidth of the windowing function.For the good resolution of frequency a long window is required whereas, for the good resolution of time a short window is required.
3.2.2 2-D correlation analysis
The time-frequency domain of all the signals is need to convert into the features for making the problem of fault detection solvable. The converted features will represent the particular faults in the system. From the healthy signal, the indicator signals show more deviations as there is an increase in the fault value of the system. Hence, with similar operating conditions, the correlation analysis between the healthy signal and each signal estimates the abnormality intensity of the system. As a detection feature of each fault state, a correlation coefficient is generated between the normal signal and the time-frequency representation of each signal. Eqn. (8) represents the correlation coefficient between two signals.
i j ij
i j ij
i j ij ij
C
2 2
)
(
)
(
)
)(
(
(8)
where,the mean value of
and
are represented as
and
respectively.3.2.3 Mean
The average value of a signal is defined as the mean, indicated by
. It is evaluated by adding all of the values of a signal together, and divide it by N. the mean can be evaluated by using Eqn. (9).
10
1
Ni i
x
N
(9)where,
denotes the mean,x
i is the signal value andN
denotes the total number of data in a signal.3.2.4 Variance and Standard Deviation
The average deviation and the standard deviation are similar but the only difference is that in standard deviation the averaging is performed with power whereas in average deviation it is performed with amplitude. Before taking the average this is accomplished by squaring the deviations. Finally, for the initial squaring a square root is taken to complete. Formula for the standard deviation is given in Eqn. (10).
1
)
(
1
0
2
N
x
Ni
i
Fault Detection using Unsupervised Feature Learning on Big Data Based on Improved Weighted SoftMax
Regression with Jaya Optimization
where,
is the mean,x
i is the signal value,N
represents the total number of values in a signal and
denotes the standard deviation of a signal. Variance is defined as the square of the standard deviation and it can be formulated as,1
)
(
1 0 2 2
N
x
N i i
(11) 3.2.5 EntropyEntropy can be useful for feature extraction in fault detection and diagnosis. The entropy is also widely used as a feature in speech recognition and biomedical signal processing. The equation for the entropy arises from the equations for the power spectrum and probability distribution for a signal. It can be formulated as follows:
N mm
p
m
P
H
12
(
)
log
)
(
(12)where,
H
is the entropy,P
(
m
)
denotes the probability distribution,N
is the total number of frequency points.3.2.6 Kurtosis
Kurtosis is the ratio of the fourth moment and the square of the second moment i.e. square of the variance. It can be represented as, 2 1 2 1 4
)
(
)
(
N i i N i ix
x
N
K
(13)1.3Squirrel Search Algorithm based Feature Selection Similar to the other algorithms based on the population, SSA also starts with the initialization of random locations of flying squirrels. In a dimensional search space, the flying squirrel’s location is denoted by a vector. Therefore, the flying squirrels can change the location vectors and can glide in any dimensional search space. The main objective of using this algorithm in this work is to select the best features for the classification of signals whether the signal is normal or a fault signal. The objective function is given in Eqn. (14).
)
(
max
classifica
tion
accuracy
f
(14)
3.3.1. Random initialization
There are
n
features extracted from the signals. The features are initialized randomly. The location of all the feature values can be given in a matrix.
d n n n d dF
F
F
F
F
F
F
F
F
F
, 2 , 1 , , 2 2 , 2 1 , 2 , 1 2 , 1 1 , 1
(15)where
F
i,jrepresents the feature values. A uniformdistribution is used to allocate the initial location of each feature value.
)
(
)
1
,
0
(
u ll
i
F
u
F
F
F
(16)where,
u
(
0
,
1
)
denotes a uniformly distributed randomnumber within the range of [0, 1],
F
u andF
lare the upperbound and lower bound respectively of the
i
th feature.3.3.2. Fitness evaluation
The fitness function used for the feature selection is represented as,
a
Fi
(17)where,
is a constant anda
is the classification accuracy. The fitness of each feature is evaluated by considering the decision variable values into thefitness function defined by the user which is represented in Eqn. (17) and the resultant values are stored as a given matrix in Eqn. (18).
)
,
,
,
(
)
,
,
,
(
)
,
,
,
(
, 2 , 1 , , 2 2 , 2 1 , 2 2 , 1 2 , 1 1 , 1 1 d n n n n d dF
F
F
f
F
F
F
f
F
F
F
f
f
(18)3.3.3. Sorting and selection
In ascending order the array is sorted after storing the fitness values of each feature. The feature with maximum fitness value is considered as the best feature. Some of the next best features also considered as the best features. Set of best feature values are selected for the fault detection process. In the fault detection step, we are using
n
number of classifiers. For then
number of classifiers,n
set of features are selected using this SSA method.1.4Improved Weighted Softmax Regression based Fault Detection
A classification approach which generalizes the logistic regression to the multiclass
problems is softmax
with the logistic regression, the softmax regression offers more than two possible choices for the class labels whereas, the logistic regressionprovides only two possible choices. Therefore, softmax regression is widely used for solving the classification problems with multiple classes. Because of the various separation boundaries formed with several learning parameters the classification results and the decisions based on the single classifier may not be reliable and vary.To overcome the mentioned problem and to enhance the performance of classification by the softmax regression, an algorithm referred to improved weighted softmax regression (IWSR) is proposed. In IWSR, several individual softmax regression classifiers are used. Each classifier is independently initialized with the learning parameters and all the classifiers are trained with the particular dataset. After obtaining all the results of the independent classifiers, majority voting is conducted to predict the final class. If there are
n
number of classifiers,n
results can be predicted for each sampleS
. For storing the results a vectorc S n
V
,
with the dimension which is same as the number of classes is employed. Let us consider the predicted class label by then
th classifier isi
, then the value of corresponding entry is incremented by one in the vector.
,
1
,
i
V
i
V
nS nS (19)By performing a majority voting the final class of the sample is obtainedafter all the
n
results are allocatedtoV
n,S .
V
i
i
class
arg
max
n,S (20)The process of each classifier is given as
follows.Let us consider a training set
x
1,
y
1,
x
2,
y
2,
(
x
3,
y
3),...
,
(
x
m,
y
m)
ofm
examples, now we have
y
i
1
,
2
,
3
,
...,
k
and for eachvalue of
j
1
,
2
,
3
,
...,
k
it isessential to evaluate theprobability
p
(
y
j
|
x
)
. The form ofh
(
x
)
is given in Eqn. (21).
xi
T k i x T i x T j i x T j
e
e
e
e
x
k
y
p
x
y
p
x
y
p
x
h
k j i i i i i i i
2 11
)
;
|
(
)
;
|
2
(
)
;
|
1
(
)
(
(21) where,
k j i x T je
11
normalizes the distribution so that it sums
to oneand the parameters are defined as
1 3
2
1
,
,
,
...,
n k
. Based on the log-likelihood, thecost function utilized by the softmax regression is written as Eqn. (22).
m i m i i i ii
h
x
y
h
x
y
m
J
1 1)
(
log
)
(
1
log
1
1
)
(
(22)The above equation can also be given as Eqn. (23).
m i k j k l i i x T l i x T je
e
j
y
m
J
1 1 1log
1
1
)
(
(23)For various inputs this model can be robust by adding a weight decay factor in Eqn. (23). Thus the above equation is changed as,
k i n j ij m i k j k l i i x T l i x T je
e
j
y
m
J
1 0 2 1 1 12
log
1
1
)
(
(24)Here, the parameters of
are the optimal values to obtain the minimum value of cost function.We are using JOA algorithm for the optimal weight selection of softmax regression classifier. Improving the fitness value of every solution is the main intention of JOA. By updating the values, this algorithm efforts the fitness value to shift towards the best solution. After the updation process, the new solutions and the old solutions are compared and for the next iteration only the best solutions are considered. Moreover, it only requires the tuning of the size of population and the number of iterations which leads to the implementation of the algorithm is simple as its solution is updated through only one phase using a single equation. It’s dominant over other optimization techniques with respect to low computational complexity and time and faster convergence speed. The implementation of this algorithm can be summarized briefly as follows:Initialize the populationsize, the number of iterations and the termination criteria. From the population, the best and worst solutions should be determined based on the objective function. The current solution based on the best and worst solutions should be adjusted by using Eqn. (25).
|)
|
(
|)
|
(
,
,
'
,
,
i
G
j
i
G
r
1,j,Gx
j,best,Gx
j,i,Gr
2,j,Gx
j,worst,Gx
j,i,Gj
x
x
(25)
where,
r
1,j,G andr
2,j,G are the random numbers in theFault Detection using Unsupervised Feature Learning on Big Data Based on Improved Weighted SoftMax
Regression with Jaya Optimization
G worst j
x
, , are the values of thej
th variable for the best weight and the worst weight respectively. The adjusted solution is compared with the previous solution. If the previous one is improved it will replace the previous solution else it will retain the previous solution. The process is repeated from until the termination criteria are achieved. From this JOA algorithm the best weight is used in the softmax regression for the diagnosis of fault.Table 1: Algorithm steps
Algorithm steps for the proposed system
Step 1: Pre-processing is performed with dimension
reduction and normalization.
Step 1.1: ICA method is used for reducing the
dimensions.
Step 1.2: Z-score normalization is applied to standardize
the values.
Step 2:
The features are extracted from the power signals like STFT, 2-D correlation analysis, mean, standard deviation, variance, entropy and kurtosis using the Eqns. (7) to (13).
Step 3:
Using the SSA algorithm, the best features are selected for the classification process with the objective of maximum classification accuracy.
Step 4:
Fault detection is carried out using the proposed improved weighted softmax regression with JOA optimization algorithm.
Step 4.1:
Jaya optimization algorithm is implemented for selecting the optimal weights in the IWSR classifier.
IV. EXPERIMENTAL ANALYSIS
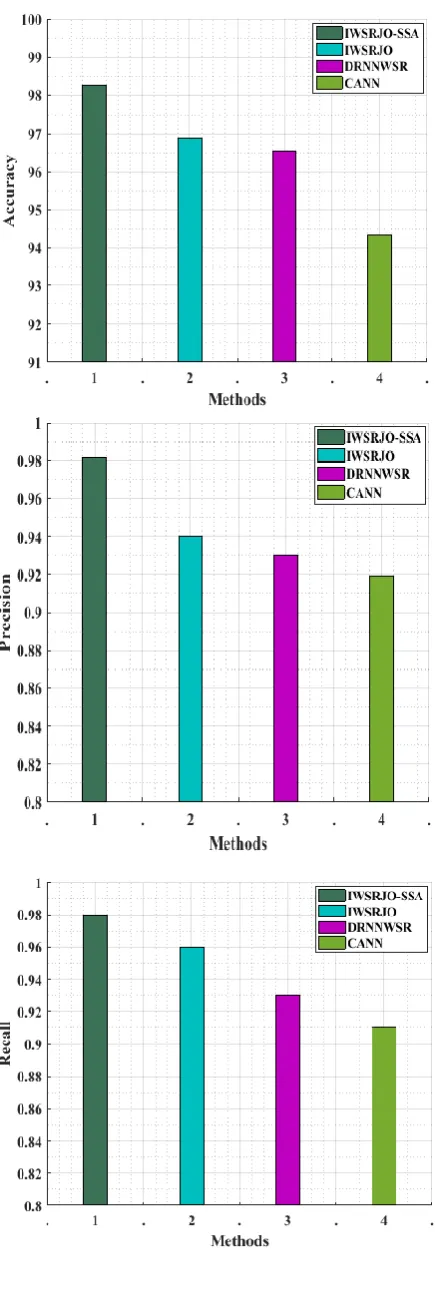
The proposed method IWSRJO_SSA is implemented in MATLAB 2018a and the performance are evaluated and compared with the other advanced techniques such as DRNNWSR (Deep Recurrent Neural Network based weighted Softmax regression) and CANN (Convolutional Auto encoder Neural Network). Also the results of the proposed method with feature selection (IWSRJO_SSA) are compared with the proposed method without performing the feature selection process (IWSRJO).
1.5 Dataset Description
The dataset is taken from the source
https://www.kaggle.com/c/vsb-power-line-fault-detection/data. The Faults in electric transmission lines can lead to a destructive phenomenon called partial discharge. If left alone, partial discharges can damage equipment to the point that it stops functioning entirely. The challenge is to detect partial discharges so that repairs can be made before any lasting harm occurs. Each signal contains 8,00,000
measurements of a power line's voltage, taken over 20 milliseconds. As the underlying electric grid operates at 50 Hz, this means each signal covers a single complete grid cycle. The grid itself operates on a 3-phase power scheme, and all three phases are measured simultaneously.
1.6 Performance Metrics
True Positive Rate, False Positive Rate, True Negative Rate and False Negative Rate are the four labels obtained from the confusion matrix are used to determine the efficiency of various machine learning approaches. The performance metrics used in this work includes, accuracy, precision, recall, f-measure. The trueness of the analytical result to the true value is defined as accuracy. The probability of the sample data test is correctly performed is called precision. Recall is the probability that a sample data test is positive. F-measure (F1 score) is a measure of a test's accuracy and is defined as the weighted harmonic mean of precision and recall. The formulas used for these performance evaluations are given as below.
Total
TN
TP
Accuracy
(24)
FP
TP
TP
ecision
Pr
(25)
FN
TP
TP
call
Re
(26)FN
FP
TP
TP
measure
F
2
2
(27)
where, TP is the true positive value, TN is the true negative value, FP is the false positive value and FN is the false negative value.
4.3 Performance Analysis
Figure 2: Original sample signal
Fault Detection using Unsupervised Feature Learning on Big Data Based on Improved Weighted SoftMax
Regression with Jaya Optimization
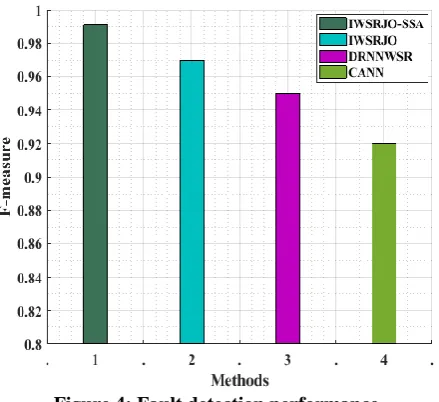
[image:10.595.307.548.60.250.2]Figure 4: Fault detection performance
Table 2: Performance of proposed and existing methods Performance
Metrics
IWSRJO-SSA IWSRJO DRNNWSR CANN
Accuracy % 98.24 96.88 96.54 94.34
Precision 0.98 0.94 0.91 0.90
Recall 0.98 0.97 0.93 0.91
F-measure 0.99 0.96 0.95 0.92
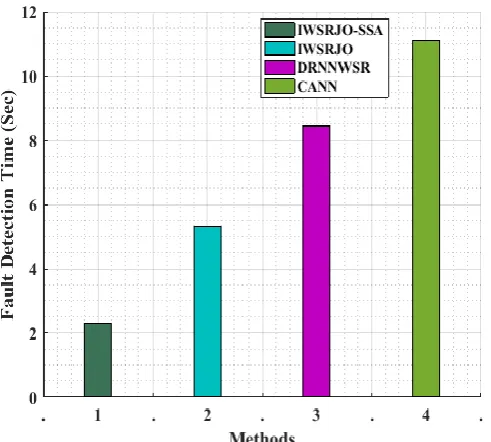
Fault Detection Time (sec)
2.29 5.31 8.45 11.11
Figure 4 and table 1 show that the proposed method IWSRJO_SSA achieved better results in terms of accuracy, precision, recall and f-measure. IWSRJO_SSA method attained high accuracy of 98.24% and the precision value, recall value and f-measure value achieved by the proposed method are 0.98, 0.98 and 0.99 respectively.
a)
b)
Figure 5: a) Training accuracy and testing accuracy b) False positive rate vs. True positive rate
[image:10.595.305.547.291.583.2]In figure 5, the first graph shows the comparison of training accuracy and testing accuracy of our proposed method IWSRJO_SSA. When compared to the testing accuracy, the training accuracy is high. The second graph shows the true positive rate with respect to the false positive rate. For the proposed method the true positive rate value increases linearly from 0 to 1.
[image:10.595.34.306.301.485.2] [image:10.595.51.299.583.763.2]Figure 8: Comparison graph of fault detection time Figure 8 shows the comparison graph of fault detection time of the proposed method and the existing methods. From the graph it is proved that the detection time is less for the IWSRJO_SSA method when compared to DRNNWSR, CANN and IWSRJO methods. The fault detection time of our proposed method is 2.29 sec and the fault detection time of IWSRJO is 5.31 sec. The fault detection time of DRNNWSR method and CANN method are 8.45 sec and 11.11 sec respectively.
V. CONCLUSION
An unsupervised learning approach is developed for the fault detection on big data based on improved weighted softmax regression with jaya optimization and squirrel search algorithm (IWSRJO_SSA). The implementation is carried out by using the power signals to detect whether the power signal is a normal or a fault signal. The proposed approach is simple and easy to carry out also it attains high accuracy when compared to that of other advanced techniques. Experimental analysis carried out on the power signals showed the applicability of the proposed approach in fault detection on big data. When compared with the existing methods, IWSRJO_SSA method attained nearly 2% accuracy more than the IWSRJO method and DRNNWSR, also it is nearly 4% accuracy more than the CANN method. In terms of precision, our proposed method attained 4% more than the IWSRJO method, 7% more than DRNNWSR and 8% more than the CANN method. When considering the recall, the IWSRJO_SSA method achieved 1% more than the IWSRJO method, 5% more than DRNNWSR and 7% more than the CANN method. Also the developed method achieved 3% more than the IWSRJO method, 4% more than DRNNWSR and 7% more than the CANN method in terms of F-measure. The experimental results prove that the proposed method attains high accuracy and is superior to the other existing methods.
REFERENCES
1. Lei, Yaguo, FengJia, Jing Lin, Saibo Xing, and Steven X. Ding. "An intelligent fault diagnosis method using unsupervised feature learning towards mechanical big data." IEEE Transactions on Industrial Electronics 63, no. 5 (2016): 3137-3147.
2. Shao, Haidong, Hongkai Jiang, Huiwei Zhao, and Fuan Wang. "A novel deep autoencoder feature learning method for rotating machinery fault diagnosis." Mechanical Systems and Signal Processing 95 (2017): 187-204.
3. Wen, Long, Xinyu Li, Liang Gao, and Yuyan Zhang. "A new convolutional neural network-based data-driven fault diagnosis method." IEEE Transactions on Industrial Electronics 65, no. 7 (2018): 5990-5998.
4. Qi, Guanqiu, Zhiqin Zhu, KeErqinhu, Yinong Chen, Yi Chai, and Jian Sun. "Fault-diagnosis for reciprocating compressors using big data and machine learning." Simulation Modelling Practice and Theory 80 (2018): 104-127.
5. Sun, Jiedi, Changhong Yan, and Jiangtao Wen. "Intelligent bearing fault diagnosis method combining compressed data acquisition and deep learning." IEEE Transactions on Instrumentation and Measurement 67, no. 1 (2018): 185-195.
6. Cheng, Ying, Ken Chen, Hemeng Sun, Yongping Zhang, and Fei Tao. "Data and knowledge mining with big data towards smart production." Journal of Industrial Information Integration9 (2018): 1-13.
7. Guo, Xiaojie, Liang Chen, and ChangqingShen. "Hierarchical adaptive deep convolution neural network and its application to bearing fault diagnosis." Measurement 93 (2016): 490-502.
8. Pan, Jun, YanyangZi, Jinglong Chen, Zitong Zhou, and Biao Wang. "LiftingNet: A novel deep learning network with layerwise feature learning from noisy mechanical data for fault classification." IEEE Transactions on Industrial Electronics 65, no. 6 (2018): 4973-4982. 9. Jing, Luyang, Taiyong Wang, Ming Zhao, and Peng Wang. "An
adaptive multi-sensor data fusion method based on deep convolutional neural networks for fault diagnosis of planetary gearbox." Sensors 17, no. 2 (2017): 414.
10. Haidong, Shao, Jiang Hongkai, Li Xingqiu, and Wu Shuaipeng. "Intelligent fault diagnosis of rolling bearing using deep wavelet auto-encoder with extreme learning machine." Knowledge-Based Systems 140 (2018): 1-14.
11. Zhou, Kaile, Chao Fu, and Shanlin Yang. "Big data driven smart energy management: From big data to big insights." Renewable and Sustainable Energy Reviews 56 (2016): 215-225.
12. Sargolzaei, Arman, Carl D. Crane, AlirezaAbbaspour, and ShirinNoei. "A machine learning approach for fault detection in vehicular cyber-physical systems." In 2016 15th IEEE International Conference on Machine Learning and Applications (ICMLA), pp. 636-640. IEEE, 2016.
13. Niggemann, Oliver, GautamBiswas, John S. Kinnebrew, HamedKhorasgani, SörenVolgmann, and Andreas Bunte. "Data-Driven Monitoring of Cyber-Physical Systems Leveraging on Big Data and the Internet-of-Things for Diagnosis and Control." In DX@ Safeprocess, pp. 185-192. 2015.
14. Hu, Hexuan, Bo Tang, Xuejiao Gong, Wei Wei, and Huihui Wang. "Intelligent fault diagnosis of the high-speed train with big data based on deep neural networks." IEEE Transactions on Industrial Informatics 13, no. 4 (2017): 2106-2116.
15. Zhao, Yang, Peng Liu, Zhenpo Wang, Lei Zhang, and Jichao Hong. "Fault and defect diagnosis of battery for electric vehicles based on big data analysis methods." Applied Energy207 (2017): 354-362.
16. Qi, Guanqiu, Wei-Tek Tsai, Yi Hong, Wenxiang Wang, GuangxinHou, and Zhiqin Zhu. "Fault-diagnosis for reciprocating compressors using big data." In 2016 IEEE Second International Conference on Big Data Computing Service and Applications (BigDataService), pp. 72-81. IEEE, 2016.
17. Lazarova-Molnar, Sanja, Hamid Reza Shaker, and Nader Mohamed. "Fault detection and diagnosis for smart buildings: State of the art, trends and challenges." In 2016 3rd MEC International Conference on Big Data and Smart City (ICBDSC), pp. 1-7. IEEE, 2016.
18. Dong, L. I., L. I. U. Shulin, and Hongli Zhang. "A method of anomaly detection and fault diagnosis with online adaptive learning under small training samples." Pattern Recognition 64 (2017): 374-385.
19. Wang, Feng, TianhuaXu, Tao Tang, MengChu Zhou, and Haifeng Wang. "Bilevel feature extraction-based text mining for fault diagnosis of railway systems." IEEE
Fault Detection using Unsupervised Feature Learning on Big Data Based on Improved Weighted SoftMax
Regression with Jaya Optimization
20. Miyazawa, Masanori, Michiaki Hayashi, and Rolf Stadler. "vNMF: Distributed fault detection using clustering approach for network function virtualization." In 2015 IFIP/IEEE International Symposium on Integrated Network Management (IM), pp. 640-645. IEEE, 2015. 21. Jia, Feng, Yaguo Lei, Jing Lin, Xin Zhou, and Na Lu. "Deep neural
networks: A promising tool for fault characteristic mining and intelligent diagnosis of rotating machinery with massive data." Mechanical Systems and Signal Processing 72 (2016): 303-315. 22. Zhang, Wei, GaoliangPeng, Chuanhao Li, Yuanhang Chen, and Zhujun
Zhang. "A new deep learning model for fault diagnosis with good anti-noise and domain adaptation ability on raw vibration signals." Sensors 17, no. 2 (2017): 425.
23. Kumar, Ajay, Ravi Shankar, AlokChoudhary, and Lakshman S. Thakur. "A big data MapReduce framework for fault diagnosis in cloud-based manufacturing." International Journal of Production Research 54, no. 23 (2016): 7060-7073.
24. Costa, Bruno SiellyJales, PlamenParvanovAngelov, and LuizAffonsoGuedes. "Fully unsupervised fault detection and identification based on recursive density estimation and self-evolving cloud-based classifier." Neurocomputing 150 (2015): 289-303. 25. Miao, Hongxia, Heng Zhang, Minghua Chen, Bensheng Qi, and Jiyong
Li. "Two-Level Fault Diagnosis of SF6 Electrical Equipment Based on Big Data Analysis." Big Data and Cognitive Computing 3, no. 1 (2019): 4.
AUTHORS PROFILE
Mr. Sangram Keshari Swain is a Research Scholar in the Department of Computer Science and Engineering, Centurion University of Technology & Management, Bhubaneswar, Odisha, India. He is currently working as an Assistant Professor in the Department of Computer Science and Engineering, Centurion University of Technology & Management, Bhubaneswar, Odisha, India. His research interests are Data Mining, Big Data, Data Analytics, Machine Learning and IoT.
Dr. Srinivas Prasad received his Ph.D. degree in Computer Science and Engineering from Utkal University, Bhubaneswar, Odisha, India. He is currently working as a Professor in the Department of Computer Science and Engineering, GITAM University, Andhra Pradesh, India. His research interests are Data Mining, Big Data Analytics and Machine Learning.