ENGINEERING PROPERTIES AND MICROSTRUCTURE OF BRICKWORK UNDER AGGRESSIVE ENVIRONMENT
by
MOHD HAZIMAN B WAN IBRAHIM
Thesis submitted in fulfillment of the requirement for the degree of
Doctor of Philosophy
iii
TABLES OF CONTENTS
Page
Acknowledgement
Table of Contents List of Tables List of Figures List of Plates List of Symbols Abstrak
Abstract
CHAPTER 1: INTRODUCTION 1.1 General
1.2 Problem Statement
1.3 Objectives
1.4 Scope of the Study
1.5 Masonry Materials
1.5.1 Fired Clay Brick
1.5.2 Calcium Silicate Brick
1.5.3 Mortar
1.6 Definition of Terms
1.6.1 Durability
1.6.2 Evaporation Process
1.6.3 Efflorescence
1.6.4 Moisture Movement
ii
iii
x
xiv
xxiii
xxiv
xxv
xxvi
1
3
5
6
7
8
10
11
12
12
13
13
iv 1.6.4.1 Expansion
1.6.4.2 Shrinkage
1.6.5 Compressive Strength
1.6.6 Modulus of Elasticity
CHAPTER 2: LITERATURE REVIEW 2.1 Introduction
2.2 Salt Attack in Masonry Material
2.3 Factors Affecting the Salt Attack in Masonry Structure
2.3.1 Soluble Salt
2.3.2 Microstructure
2.3.3 Mortar Mixes
2.3.4 Moisture
2.3.5 Temperature and Humidity
2.4 Mechanism of Salt Attack in Masonry Wall
2.4.1 Salt Crystallization
2.4.2 Chloride Attack
2.4.3 Sulphate Attack
2.5 Strength of Masonry Wall
2.5.1 Factor Affecting the Strength of Masonry Wall
2.5.1.1 Interaction Between Brick and Mortar
2.5.1.2 Geometry of Unit
2.5.1.3 Strength of Unit
2.5.1.4 Strength of Mortar
2.5.1.5 Suction of Units
14
15
15
15
17
17
20
21
23
25
26
27
29
30
33
36
39
40
40
43
44
46
v 2.5.1.6 Water Retentivity of Mortar
2.5.1.7 Joint Thickness
2.5.1.8 Loading Rate Applied for Strength
2.5.1.9 Other Factors
2.6 Movement of Brick Masonry Wall
2.6.1 Elastic Movement
2.6.1.1 Brick Units
2.6.1.2 Mortar
2.6.1.3 Masonry Structures
2.6.1.3.1 Factors Affecting Elastic Movement of Brickwork
2.6.2 Moisture Movement
2.6.2.1 Moisture Expansion of Fired-clay Brick and Brickwork
2.6.2.1.1 Factors Affecting the Moisture Expansion of
Fired-clay Brick and Brickwork
2.6.2.2 Shrinkage of Calcium Silicate Brick and Brickwork
2.6.2.2.1 Factors Affecting the Shrinkage of Calcium Silicate
Brick and Brickwork
2.6.2.3 Moisture Movement of Mortar
2.6.2.3.1 Factors Affecting the Moisture Movement of Mortar
2.7 Prediction Methods for Deformation of Masonry
2.8.1 Methods of Predicting Elasticity
2.8.2 Method of Predicting Moisture Movement
2.8 Summary
49
50
52
53
56
57
58
58
61
63
64
65
67
70
71
72
74
75
76
84
vi
CHAPTER 3: MATERIALS AND EXPERIMENTAL DETAILS 3.1 Introduction
3.2 Materials
3.2.1 Brick Units
3.2.1.1 Clay Brick
3.2.1.2 Calcium Silicate Bricks
3.2.2 Mortar
3.3 Tests for Material Properties
3.3.1 Porosity
3.3.2 Water Absorption
3.3.3 Suction Rate
3.3.4 Compressive Strength and Modulus Elasticity
3.4 Moisture Movement
3.5 Test for Microstructural Properties
3.5.1 X-Ray Fluorescence (XRF)
3.5.2 Scanning Electron Microscope (SEM)
3.5.3 X-Ray Diffraction (XRD)
3.6 Brickwork Construction
3.6.1 Composite Modeling
3.7 Strength and Stress-Strain Measurement
3.8 Preliminary Work
3.8.1 Salt Solution Preparation
3.8.2 Sealing of Units and Mortar Specimens
3.9 Environmental and Curing Conditions
89
91
91
91
91
92
96
96
97
98
98
107
112
112
114
115
116
120
120
121
121
122
vii
CHAPTER 4: EFFECT OF SULPHATE AND CHLORIDE ON THE PROPERTIES OF MASONRY WALL
4.1 Introduction
4.2 Properties of mortar
4.2.1 Compressive strength
4.2.2 Modulus of elasticity
4.2.2.1 Elasticity – strength relationship of mortar
4.2.3 Moisture movement of mortar
4.3 Properties of brick unit
4.3.1 Porosity and water absorption
4.3.2 Suction rate
4.3.3 Strength of unit
4.3.4 Modulus of elasticity of unit
4.3.4.1 Elasticity – strength relationship of unit
4.3.5 Moisture movement of unit
4.4 Properties of brickwork
4.4.1 Strength
4.4.2 Modulus of elasticity
4.4.2.1 Elasticity-strength relationship of brickwork
4.4.2.2 Reduction in modulus of elasticity of brickwork
4.4.3 Moisture movement of masonry
4.5 Rating in moisture movement of masonry wall
4.6 Composite modeling
4.7 Summary
127
127
127
132
136
137
147
147
148
148
155
157
160
170
170
174
181
183
185
210
214
viii
CHAPTER 5: PREDICTION OF MODULUS OF ELASTICITY AND MOISTURE MOVEMENT OF MASONRY WALL
5.1 Introduction
5.2 Modulus of Elasticity
5.2.1 Prediction by Codes of Practice
5.2.1.1 BS 5628: Part 2: 2005
5.2.1.2 Eurocode 6, ENV 1996: 2001
5.2.1.3 ACI 530-92/ASCE 5-92 (1996)
5.2.2 Prediction by previous researchers
5.2.2.1 Brook’s method
5.2.2.2 Ameny et. al’s method
5.2.2.3 Lenczner’s method
5.2.2.4 Sahlin’s method
5.2.2.5 Other methods of prediction
5.3 Moisture movement
5.3.1 Prediction by code of practices
5.3.1.1 BS 5628: Part 2 (2005)
5.3.1.2 ACI 530-92/ASCE 5-92 (1996)
5.3.1.3 Eurocode No. 6, ENV 1996-1-1 (2001)
5.4 Summary
CHAPTER 6: EFFECT OF SALT ATTACK ON BRICK MASONRY 6.1 Introduction
6.2 Chemical composition of brick and mortar
6.3 Crystallization of masonry materials
217
217
217
218
219
220
222
222
223
224
225
225
233
233
233
234
235
241
242
ix 6.3.1 Fired clay brick
6.3.2 Calcium silicate brick
6.3.3 Mortar
6.4 Compositions and characteristics of masonry materials
6.4.1 Fired clay brick
6.4.2 Calcium silicate brick
6.4.3 Mortar
6.4 Summary
CHAPTER 7 – CONCLUSIONS AND RECOMMENDATIONS 7.1 Introduction
7.2 Conclusions
7.3 Recommendations
REFERENCES
APPENDIX A Calculation for dimension ‘x’ single leaf wall and weight of soluble salt solution
APPENDIX B Plates of mortar prism APPENDIX C Plates of brick masonry wall
244
245
254
260
271
271
281
290
300
302
302
308
310
326
328
x
LIST OF TABLES
Page Table 1.1 Table 1.2 Table 2.1 Table 2.2 Table 2.3 Table 2.4 Table 2.5 Table 2.6 Table 2.7 Table 2.8 Table 2.9 Table 2.10 Table 2.11 Table 2.12 Table 2.13 Table 2.14 Table 2.15 Table 2.16 Table 2.17 Table 3.1
Chemical composition (wt%) of the four fired clay bricks types
Chemical composition of the mortar (wt%)
Category limits for active water soluble salts
Weight loss and porosity of limestone after salt crystallization test
Crystallization Pressure
Summary of strength reduction and expansion test results
The strength of bricks and prism in different directions
Loading rate
Brickwork prism result for slow and standard loading rate
Masonry mortar
Design values of initial elastic moduli of brickwork
Expansion of fired-clay brick due to change in moisture content
Moisture expansion of fired-clay brickwork
Moisture movement of concrete and calcium silicate masonry units
Shrinkage of mortar due to change in moisture content
Typical fine aggregate gradation
Typical average specific gravity and absorptivity for fine aggregate
Characteristic compressive strength of masonry
Elastic modulus of clay masonry
The number of brick specimens for strength and modulus of elasticity test
xi Table 3.2 Table 3.3 Table 3.4 Table 3.5 Table 3.6 Table 3.7 Table 3.8 Table 3.9 Table 4.1 Table 4.2 Table 4.3 Table 4.4 Table 4.5 Table 4.6 Table 4.7 Table 4.8 Table 4.9 Table 4.10
The number of mortar cube and mortar prism specimens for strength and modulus of elasticity test
The number of brickwork specimens for strength and modulus of elasticity test
The number of brick specimens for moisture movement test
The number of mortar prism specimens for moisture movement test
The number of brickwork specimens for moisture movement test
The number of specimens prepared for all testing
Volume-Surface area of single leaf wall masonry
Sealing of unbonded brick unit and mortar specimens
Compressive strength of mortar cube for fired-clay brickwork under water curing
Compressive strength of mortar cube for calcium silicate brickwork under water curing
Compressive strength of partly sealed unbonded mortar prisms for fired-clay brickwork
Compressive strength of partly sealed unbounded mortar prisms for calcium silicate brickwork
Modulus of elasticity of partly sealed unbonded mortar prisms for fired-clay brickwork
Modulus of elasticity of partly sealed mortar prisms for calcium silicate brickwork
Moisture movement of partly sealed mortar prisms for fired-clay brickwork
Moisture movement of partly sealed mortar prisms for calcium silicate brickwork
Initial rate of suction, water absorption and porosity of brick
Compressive strength of unsealed brick units
xii Table 4.11 Table 4.12 Table 4.13 Table 4.14 Table 4.15 Table 4.16 Table 4.17 Table 4.18 Table 4.19 Table 4.20 Table 4.21 Table 4.22 Table 4.23 Table 4.24 Table 4.25 Table 4.26 Table 5.1 Table 5.2 Table 5.3
Compressive strength of partly sealed fired-clay brick units
Compressive strength of partly sealed calcium silicate brick units
Modulus of elasticity of unsealed brick units
Modulus of elasticity of fired-clay brick units
Modulus of elasticity of calcium silicate brick units
Moisture movement of partly sealed fired-clay and calcium silicate brick units at 210 days
Compressive strength of fired-clay brickwork
Compressive strength of calcium silicate brickwork
Compressive strength of masonry wall panel with different thickness of mortar joint
Modulus of elasticity of fired-clay brickwork panels
Modulus of elasticity of calcium silicate brickwork panels
Modulus of elasticity of masonry wall panel with different thickness of mortar joint
Moisture movement of fired-clay brick masonry wall panel
Moisture movement of calcium silicate brick masonry wall panel
The rating and justification of moisture movement of fired- clay masonry wall exposed to aggressive environment
The rating and justification of moisture movement of calcium silicate masonry wall exposed to aggressive environment
Modulus of elasticity of fired-clay brickwork predicted by Code of Practice
Modulus of elasticity of calcium silicate brickwork predicted by Code of Practice
Modulus of elasticity of fired-clay and calcium silicate brickwork under control condition over 180 days predicted by previous researchers
xiii Table 5.4 Table 5.5 Table 5.6 Table 5.7 Table 5.8 Table 5.9 Table 5.10 Table 5.11 Table 5.12 Table 6.1 Table 6.2 Table 6.3 Table 6.4 Table 6.5 Table 6.6 Table 6.7
Modulus of elasticity of fired-clay and calcium silicate brickwork under sulphate condition over 180 days predicted by previous researchers
Modulus of elasticity of fired-clay and calcium silicate brickwork under chloride condition over 180 days predicted by previous researchers
Modulus of elasticity of fired-clay and calcium silicate brickwork under combination of sulphate and chloride condition over 180 days predicted by previous researchers
Comparison of error coefficient between the measured and predicted modulus of elasticity of fired-clay masonry by code of practice and other methods of prediction
Comparison of error coefficient between the measured and predicted modulus of elasticity of fired-clay masonry by code of practice and other methods of prediction
Moisture movement of control specimens of fired-clay and calcium silicate brickwork
Moisture movement of fired-clay and calcium silicate brickwork exposed to sodium sulphate solution
Moisture movement of fired-clay and calcium silicate brickwork exposed to sodium chloride solution
Moisture movement of fired-clay and calcium silicate brickwork exposed to sodium sulphate-sodium chloride solution
Chemical compositions of fired-clay brick, calcium silicate brick and cement lime mortar
The peak of halite and thenardite within fired-clay and calcium silicate brick
The peak of halite and ettringite within mortar for fired-clay and calcium silicate brickwork
Percentage of atom for elements in fired-clay brick
Percentage of atom for elements in calcium silicate brick
Percentage of atom for elements in mortar
The crystal shape within mortar joint after exposed to different types and concentration of soluble salts
xiv
LIST OF FIGURES
Page Figure 1.1 Figure 1.2 Figure 2.1 Figure 2.2 Figure 2.3 Figure 2.4 Figure 2.5 Figure 2.6 Figure 2.7 Figure 3.1 Figure 3.2 Figure 3.3 Figure 3.4 Figure 3.5 Figure 3.6 Figure 3.7 Figure 3.8 Figure 3.9 Figure 4.1 Figure 4.2
Moisture movement of unloaded specimen
Modulus of elasticity for masonry
Water absorption process in masonry exposed to water spray
Mechanism of sodium sulphate attack
Restraining effect of the testing machine platens
Effect of joint thickness on brickwork strength
Effect of moisture absorption from mortar bed movement of bricks after laying results in pillow shaped mortar bed
Stress-strain behavior of masonry
Composite model layout for vertical elasticity of masonry
Flow chart for testing program
Sieve analysis result for sand
The measurement of modulus of elasticity using tangent method
Partially sealed brick unit
Partially sealed mortar prism
Single leaf wall (1.5 unit wide x 5 unit height)
1 unit wide x 5 unit height masonry prism
History of test laboratory temperature with time
History of test laboratory humidity with time
Relationship between the modulus of elasticity and strength of mortar prism
xv Figure 4.3 Figure 4.4 Figure 4.5 Figure 4.6 Figure 4.7 Figure 4.8 Figure 4.9 Figure 4.10 Figure 4.11 Figure 4.12 Figure 4.13 Figure 4.14 Figure 4.15 Figure 4.16
Moisture movement of control calcium silicate brickwork mortar prism
Moisture movement of fired-clay brickwork mortar prism exposed to different concentration of sodium sulphate
Moisture movement of calcium silicate brickwork mortar prism exposed to different concentration of sodium sulphate
Moisture movement of fired-clay brickwork mortar prism exposed to different concentration of sodium chloride
Moisture movement of calcium silicate brickwork mortar prism exposed to different concentration of sodium chloride
Moisture movement of fired-clay brickwork mortar prism exposed to different concentration of sodium sulphate-sodium chloride solutions
Moisture movement of calcium silicate brickwork mortar prism exposed to different concentration of sodium sulphate-sodium chloride
Comparison of moisture movement of fired-clay brickwork mortar exposed to 5% concentration of soluble salt
Comparison of moisture movement of calcium silicate brickwork mortar exposed to 5% concentration of soluble salt
Comparison of moisture movement of fired-clay brickwork mortar exposed to 10% concentration of soluble salt
Comparison of moisture movement of calcium silicate brickwork mortar exposed to 10% concentration of soluble salt
Comparison of moisture movement of fired clay brickwork mortar exposed to 15% concentration of soluble salt
Comparison of moisture movement of calcium silicate brickwork mortar exposed to 15% concentration of soluble salt
Relationship between the modulus of elasticity and strength of fired clay brick units
xvi Figure 4.17 Figure 4.18 Figure 4.19 Figure 4.20 Figure 4.21 Figure 4.22 Figure 4.23 Figure 4.24 Figure 4.25 Figure 4.26 Figure 4.27 Figure 4.28 Figure 4.29 Figure 4.30 Figure 4.31 Figure 4.32 Figure 4.33
Relationship between the modulus of elasticity and strength of calcium silicate brick units
Moisture movement of control fired clay brick units
Moisture movement of fired clay brick units exposed to different concentration of sodium sulphate
Moisture movement of fired clay brick units exposed to different concentration of sodium chloride
Moisture movement of fired clay brick units exposed to different concentration of sodium sulphate-sodium chloride
Moisture movement of control calcium silicate brick units
Moisture movement of calcium silicate brick units exposed to different concentration of sodium sulphate
Moisture movement of calcium silicate brick units exposed to different concentration of sodium chloride
Moisture movement of calcium silicate brick units exposed to different concentration of sodium sulphate-sodium chloride
Comparison of moisture movement of fired-clay brick exposed to 5% concentration of soluble salt
Comparison of moisture movement of fired-clay brick exposed to 10% concentration of soluble salt
Comparison of moisture movement of fired-clay brick exposed to 15% concentration of soluble salt
Comparison of moisture movement of calcium silicate brick exposed to 5% concentration of soluble salt
Comparison of moisture movement of calcium silicate brick exposed to 10% concentration of soluble salt
Comparison of moisture movement of calcium silicate brick exposed to 15% concentration of soluble salt
Relationship between modulus of elasticity of fired-clay brickworks and fired-clay brick units
Relationship between modulus of elasticity of calcium silicate brickwork and calcium silicate brick unit
xvii Figure 4.34 Figure 4.35 Figure 4.36 Figure 4.37 Figure 4.38 Figure 4.39 Figure 4.40 Figure 4.41(a) Figure 4.41(b) Figure 4.42(a) Figure 4.42(b) Figure 4.43(a) Figure 4.43(b) Figure 4.44(a) Figure 4.44(b) Figure 4.45(a)
Relationship between the modulus of elasticity of fired-clay brickwork and mortar prism
Relationship between the modulus of elasticity of calcium silicate brickwork and mortar prism
Relationship between the modulus of elasticity and strength of fired-clay brickwork
Relationship between the modulus of elasticity and strength of calcium silicate brickwork
Reduction in modulus of elasticity of calcium silicate brickwork at the age of 180 day
Reduction in modulus of elasticity of fired-clay brickwork at the age of 180 day
The attraction of fired-clay brick masonry wall panels due to the expansion of mortar joints under sulphate environment
Vertical moisture movement of control fired-clay brickwork
Horizontal moisture movement of control fired-clay brickwork
Vertical moisture movement of fired-clay brickwork exposed to different concentration of sodium sulphate
Horizontal moisture movement of fired clay brickwork exposed to different concentration of sodium sulphate
Vertical moisture movement of fired clay brickwork exposed to different concentration of sodium chloride
Horizontal moisture movement of fired clay brickwork exposed to different concentration of sodium chloride
Vertical moisture movement of fired clay brickwork exposed to different concentration of sodium sulphate-sodium chloride
Horizontal moisture movement of fired clay brickwork exposed to different concentration of sodium sulphate-sodium chloride
xviii Figure 4.45(b) Figure 4.46(a) Figure 4.46(b) Figure 4.47(a) Figure 4.47(b) Figure 4.48(a) Figure 4.48(b) Figure 4.49(a) Figure 4.49(b) Figure 4.50(a) Figure 4.50(b) Figure 4.51(a) Figure 4.51(b) Figure 4.52(a) Figure 4.52(b)
Horizontal moisture movement of control calcium silicate brickwork
Vertical moisture movement of calcium silicate brickwork exposed to different concentration of sodium sulphate
Horizontal moisture movement of calcium silicate brickwork exposed to different concentration of sodium sulphate
Vertical moisture movement of calcium silicate brickwork exposed to different concentration of sodium chloride
Horizontal moisture movement of calcium silicate brickwork exposed to different concentration of sodium chloride
Vertical moisture movement of calcium silicate brickwork exposed to different concentration of sodium sulphate-sodium chloride
Horizontal moisture movement of calcium silicate brickwork exposed to different concentration of sodium sulphate-sodium chloride
Comparison of vertical moisture movement of fired-clay brickwork exposed to 5% concentration of soluble salt
Comparison of horizontal moisture movement of fired-clay brickwork exposed to 5% concentration of soluble salt
Comparison of vertical moisture movement of fired-clay brickwork exposed to 10% concentration of soluble salt
Comparison of horizontal moisture movement of fired-clay brickwork exposed to 10% concentration of soluble salt
Comparison of vertical moisture movement of fired-clay brickwork exposed to 15% concentration of soluble salt
Comparison of horizontal moisture movement of fired-clay brickwork exposed to 15% concentration of soluble salt
Comparison of vertical moisture movement of calcium silicate brickwork exposed to 5% concentration of soluble salt
xix Figure 4.53(a) Figure 4.53(b) Figure 4.54(a) Figure 4.54(b) Figure 4.55 Figure 4.56 Figure 4.57 Figure 4.58 Figure 4.59 Figure 4.60 Figure 6.1 Figure 6.2 Figure 6.3 Figure 6.4
Comparison of vertical moisture movement of calcium silicate brickwork exposed to 10% concentration of soluble salt
Comparison of horizontal moisture movement of calcium silicate brickwork exposed to 10% concentration of soluble salt
Comparison of vertical moisture movement of calcium silicate brickwork exposed to 15% concentration of soluble salt
Comparison of horizontal moisture movement of calcium silicate brickwork exposed to 15% concentration of soluble salt
Moisture movement of fired-clay masonry prism with different thickness of mortar joint exposed to 5% concentration of sodium sulphate
Moisture movement of calcium silicate masonry prism with different thickness of mortar joint exposed to 5% concentration of sodium sulphate
Relationship between degree of expansion and the reduction in modulus of elasticity of fired-clay masonry wall
Relationship between degree of expansion and the reduction in modulus of elasticity of calcium silicate masonry wall
The classification of moisture movement of fired-clay masonry wall due to aggressive environment
The classification of moisture movement of calcium silicate masonry wall due to aggressive environment
X-ray diffraction analysis for fired-clay brick under control conditions
X-ray diffraction analysis for fired-clay brick exposed to sodium sulphate solutions
X-ray diffraction analysis for fired-clay brick exposed to sodium chloride solution
X-ray diffraction analysis for fired-clay brick exposed to sodium sulphate-sodium chloride solutions
xx Figure 6.5 Figure 6.6 Figure 6.7 Figure 6.8 Figure 6.9 Figure 6.10 Figure 6.11 Figure 6.12 Figure 6.13 Figure 6.14 Figure 6.15 Figure 6.16 Figure 6.17 Figure 6.18 Figure 6.19 Figure 6.20 Figure 6.21
X-ray diffraction analysis for control calcium silicate brick
X-ray diffraction analysis for calcium silicate brick exposed to sodium sulphate solutions
X-ray diffraction analysis for calcium silicate brick exposed to sodium chloride solutions
X-ray diffraction analysis for calcium silicate brick exposed to sodium sulphate-sodium chloride solutions
X-ray diffraction analysis for control fired-clay brickwork mortar
X-ray diffraction analysis for control calcium silicate brickwork mortar
X-ray diffraction analysis for fired-clay brickwork mortar exposed to sodium sulphate solutions
X-ray diffraction analysis for calcium silicate brickwork mortar exposed to sodium sulphate solution
X-ray diffraction analysis for fired-clay brickwork mortar exposed to sodium chloride solutions
X-ray diffraction analysis for calcium silicate brickwork mortar exposed to sodium chloride conditions
X-ray diffraction analysis for fired clay brickwork mortar exposed to sodium sulphate-sodium chloride solutions
X-ray diffraction analysis for calcium silicate brickwork mortar exposed to sodium sulphate-sodium chloride solutions
SEM micrograph of fired-clay brick exposed dry condition
SEM micrograph of fired-clay brick sample exposed to wet condition
SEM micrograph of 5% concentration of sodium chloride crystals in fired-clay brick
SEM micrograph of 10% concentration of sodium chloride crystals in fired-clay brick
SEM micrograph of 15% concentration of sodium chloride crystals in fired-clay brick
xxi Figure 6.22 Figure 6.23 Figure 6.24 Figure 6.25 Figure 6.26 Figure 6.27 Figure 6.28 Figure 6.29 Figure 6.30 Figure 6.31 Figure 6.32 Figure 6.33 Figure 6.34 Figure 6.35 Figure 6.36 Figure 6.37 Figure 6.38
SEM micrograph of 5% concentration of sodium sulphate crystals in fired-clay brick
SEM micrograph of 10% concentration sodium sulphate crystals in fired-clay brick
SEM micrograph of 15% concentration sodium sulphate crystals in fired-clay brick
SEM micrograph of 5% concentration of sodium sulphate – sodium chloride crystals in fired-clay brick
SEM micrograph of 10% concentration of sodium sulphate –sodium chloride crystals in fired-clay brick
SEM micrograph of 15% concentration of sodium sulphate–sodium chloride crystals in fired-clay brick
SEM micrograph of calcium silicate brick sample exposed to dry condition
SEM micrograph of calcium silicate brick sample exposed to wet condition
SEM micrograph of 5% concentration of sodium chloride crystals in calcium silicate brick
SEM micrograph of 10% concentration of sodium chloride crystals in calcium silicate brick
SEM micrograph of 15% concentration of sodium chloride crystals in calcium silicate brick
SEM micrograph of 5% concentration of sodium sulphate crystals in calcium silicate brick
SEM micrograph of 10% concentration sodium sulphate crystals in calcium silicate brick
SEM micrograph of 15% concentration of sodium sulphate crystals in calcium silicate brick
SEM micrograph of 5% concentration of sulphate-chloride crystals in calcium silicate brick
SEM micrograph of 10% concentration of sodium sulphate-sodium chloride crystals in calcium silicate brick
SEM micrograph of 15% concentration of sodium sulphate-sodium chloride crystals in calcium silicate brick
xxii Figure 6.39
Figure 6.40
Figure 6.41
Figure 6.42
Figure 6.43
Figure 6.44
Figure 6.45
Figure 6.46
Figure 6.47
Figure 6.48
Figure 6.49
SEM micrograph for mortar sample exposed to dry condition
SEM micrograph for mortar sample exposed to wet condition
SEM micrograph for mortar sample exposed to 5% concentration of sodium chloride
SEM micrograph for mortar sample exposed to 10% concentration of sodium chloride
SEM micrograph for mortar sample exposed to 15% concentration of sodium chloride
SEM micrograph for mortar sample exposed to 5% concentration of sodium sulphate
SEM micrograph for mortar sample exposed to 10% concentration of sodium sulphate
SEM micrograph for mortar sample exposed to 15% concentration of sodium sulphate
SEM micrograph for mortar sample exposed to 5% concentration of sodium sulphate–sodium chloride
SEM micrograph for mortar sample exposed to 10% concentration of sodium sulphate–sodium chloride
SEM micrograph for mortar sample exposed to 15% concentration of sodium sulphate–sodium chloride
291
291
292
292
293
294
295
295
297
297
xxiii
LIST OF PLATES
Page Plate 3.1 Plate 3.2 Plate 3.3 Plate 3.4 Plate 3.5 Plate 3.6 Plate 3.7 Plate 3.8 Plate 3.9 Plate 3.10 Plate 3.11 Plate 3.12 Plate 3.13 Plate 3.14 Plate 3.15 Plate 4.1 Plate 4.2 Plate 4.3 Plate 4.4
Fired clay brick
Calcium silicate brick
Dropping ball test equipment for controlling mortar workability
Porosity test equipment using water immersion under vacuum method
1000 kN capacity universal testing machine
3000 kN capacity universal testing machine
Brickwork in curing condition under polythene sheet in control room
Demec gauge equipment
Sample for x-ray fluorescence test
Mould for sample preparation in x-ray fluorescence test
Fired-clay brickwork in control room
Calcium silicate brickwork in control room
Calcium silicate brickwork with different mortar thickness (1 unit wide x 5 unit height)
Fired clay brickwork with different mortar thickness (1 unit wide x 5 unit height)
Sealing mortar prism, calcium silicate brick and fired clay brick
Failure pattern of unsealed calcium silicate brick
Failure pattern of partly sealed calcium silicate brick
Failure pattern of unsealed fired clay brick
Failure pattern of partly sealed fired clay brick
xxiv
LIST OF SYMBOLS
Dv Pore size distributiom ri Pore size
Pconc Connected porosity
P Pressure generated by a growing crystal in atmosphere C The saturation concentration in the pore
Cs The saturation concentration in bulk solution Vc The molar volume of solid salt (m3 .mol-1) R The molar gas constant (8.3 J.K-1 mol-1) T Absolute temperature
Em Elastic modulus of masonry
fk Characteristic compressive strength of masonry E Modulus of elasticity of masonry
fb Mean compressive strength of unit fm Compressive strength of mortar by Depth of brick unit
C Number of course H Height of masonry
xxv
SIFAT-SIFAT KEJURUTERAAN DAN STRUKTUR MIKRO KERJA BATA DI BAWAH PERSEKITARAN AGRESIF
ABSTRAK
xxvi
ENGINEERING PROPERTIES AND MICROSTRUCTURE OF BRICKWORK UNDER AGRESSIVE ENVIRONMENT
ABSTRACT
1 CHAPTER 1
INTRODUCTION
1.1 General
Masonry walls are composite structures defined as macroscopic combinations
of two or more distinct materials having a finite interface between them. The quality
of raw materials and the method of brick manufacturing can influence the strength
and durability of brickwork. Surej et al. (1998) revealed the various factors that may
adversely affect the performance of a material during the course of time, such as
material properties, masonry structures, environmental conditions and maintenance.
Considering the factors affecting durability is very important because these
properties can influence brick/mortar compatibility. The durability properties of
bricks should also be evaluated for the proper selection of building materials in
construction to ensure that the strength and performance of brick walls are
maintained when subjected to an aggressive environment during their service life.
Khalaf and DeVenny (2002) found that the main factor influencing the
durability of masonry is the degree to which it becomes saturated with water.
Saturation can occur in three ways: directly through rainfall, indirectly when water
moves upward by capillary action from foundation, or laterally from retained
2
the severity of the environmental conditions to which the units are exposed, such as
moisture and the availability of soluble salts. These two are the main factors for the
salt attacks. The salt attack occurs when the soluble salt drawn into its pores cannot
be evaporated with the moisture. As a result, the salts build up as crystals underneath
the wall surface and the expansion pressure develops could be sufficient to
deteriorate and rupture the masonry structure, causing crumbling, even for strong
masonry materials.
Masonry structure design is focused mainly on the ability of the structure to
resist applied loads, however deformations that arise from other effects such as
variations in temperature and moisture content (Bremner, 2002). The design and
subsequent use of these structures are therefore limited by the properties of the
material. The material properties are depends on the manufacturing process which
would influencing the microstructure of the materials.
Fernandes and Lourenco (2007) noted that mechanical characterization is a
fundamental task for safety assessment and structural work, where the compressive
strength is a key parameter in the case of masonry structures. In fact, Kaushik et al.
(2007) believed that the strength and stiffness of the masonry lies between the
strength of the bricks and that of mortar. Furthermore, in the case of fired-clay
bricks, the mechanical properties of the brick are very relevant because the resistance
and durability of the masonry depend significantly on the characteristics of the bricks
3
The ability to resist salt attacks is one of the main considerations because salt
attacks cause damage to masonry materials in sub-tropical and tropical climates
(Philips and Zsembery, 1982). Malaysia experiences hot and moist conditions with
heavy rains; therefore, it has the potential to encounter the same problems. The lack
of consciousness among Malaysians in the salt attack problems in the brickwork
hinders the government from solving the problems efficiently and at the same time
causes the increase in the cost of brickwork maintenance. Therefore, the aim of this
study is to investigate the influence of aggressive environments, such as sodium
sulphate and sodium chloride, on the engineering properties and microstructure of
masonry walls.
1.2 Problem statement
Salt attack is one of the major causes of decay to masonry wall materials such
as brick and mortar. This phenomenon occurs due to the presence of soluble salt in
the material after the evaporation process. The process normally produces
efflorescence or salt crystals. The methods of formation of both phenomena have
similar chemical reactions.
Efflorescence or flowering on the wall surface normally occurs when the
soluble salt transported by the moisture to the surface cannot evaporate during
wetting and drying periods. This salt is left behind and is deposited as a white bloom.
The point at which the salt appears in solid form is exactly where the majority of the
4
Salt crystallization begins when the moisture cannot dissolve all the salt
present. Bremner (2002) indicated that when the rate of the migration of the salt
solution through the masonry material pores is lower than the rate of evaporation, the
drying zone forms below the surface. The salts will grow as minute crystals within
the pores and may lead to expansion due to the crystallization pressure. More
importantly is a degradation process that leads to the reduction in the strength or
ultimately the destruction of the masonry material affected.
In practice, sodium sulphate and sodium chloride cause most cases of salt
attacks (Zsembery, 2001). Sodium sulphate is normally present in many bricks and
stones, in Portland cements, and in some groundwater. They are formed from sulfur
dioxide and sulfurous acid in the atmosphere (Jordan, 2001). Chloride comes from
the salt-laden air near the sea through the mixture of water and groundwater. Salts in
the masonry wall are either present in the masonry at the time of building or
absorbed from the atmosphere or groundwater during the life of the building. The
source of salts may be one or a combination of the following (Young, 1995):
(i) Saline soils and groundwater
(ii) Sea spray
(iii) Air-borne salt
(iv) Air pollutants
(v) Biological, such as pigeon poop, microorganism, leaking sewers
(vi) Salt naturally occurring in stone, brick clay, or mortar sand
(vii) Salt water used for puddling brick clay or mixing mortar
(viii) Salts used for de-icing roads in cold climates
5
In a study on the restoration of a municipal building in Penang, Malaysia,
Ahmad (2004) found that the percentage of sulphate exceeded the safe level of
0.020%, with the highest level recorded at 6.27%. The presence of a very high level
of sodium sulphate may deteriorate the surface of the brick and mortars, causing the
loss of binders and cohesion. In the latest findings, Kamal et al. (2007) indicated that
since the 1970s, many of the heritage buildings in Malaysia have been demolished
because the defects were not noticed due to the lack of technical knowledge and the
high cost of repair and maintenance. Building defects normally occur along the
external wall due to chemical action, dampness, salt crystallization, and so on.
Malaysia also has many peat soil areas, and according to Wan Ibrahim et al. (2007),
the acid level in this area is very high with a water pH of 2 to 4. This clearly
indicates that Malaysia, as a tropical country, is highly susceptible to salt attacks.
A number of previous studies have been conducted on salt attacks on
masonry materials and these are discussed in Chapter 2. However, most studies did
not focus on the influence of the degree of salt attack and the consequence on the
structural performance of masonry walls. This issue is very important, because the
understanding of the mechanism of deterioration will be useful in the production of
more durable materials and determining an effective repair scheme.
1.3 Objectives
This study is primarily focused on the effects of sulphate and chloride attacks
on the mechanical properties and structural performance of masonry walls under
6
(i) To characterize the effects of aggressive salt exposure on masonry walls
(ii) To investigate the effects of aggressive salt exposure on the properties and
performance of masonry walls
(iii) To study the influence of aggressive salt exposure on the microstructure of
fired-clay and calcium silicate brick.
(iv) To determine the elastic modulus and moisture movement of fired-clay
brick and calcium silicate brick masonry walls due to aggressive salt
environment
1.4 Scope of the study
This study involves the construction of a single leaf wall combined from two
types of bricks, i.e., fired-clay brick and the calcium silicate brick, with the selected
mortar ratio of 1:1:6 (Ordinary Portland cement: lime: sand) throughout the
investigation. The fired-clay brick selected because it is very famous brick and
widely used in the country. Meanwhile, the calcium silicate brick selected because
the study on this type of brick in Malaysia is very limited and still lacking the
technical information under local saline environment.
This study carried out in three phase. In the first phase, the walls and their
corresponding unbonded brick units and mortar prisms were cured under a polythene
sheet for 14 days and were then exposed to sodium sulphate and sodium chloride
environments, as well as to a double salt environment, which is a combination of
sodium sulphate and sodium chloride solution. The compressive strength and
7
out only up to 180 days because the overall effect of the solution obviously appears
at this age. The basic properties, such as water absorption, porosity, initial rate of
suction and etc of the masonry materials were also measured.
In the second phase, the shrinkage or moisture movement of the masonry
walls and unbonded mortar prisms and units were monitored up to seven.
Measurement to determine the modulus of elasticity and shrinkage or moisture
movement were made and compared with the prediction data using an existing
model. Finally, in the third phase the deteriorated parts of the broken samples tested
after 180 days were chosen for microstructure observation. Scanning electron
microscopy (SEM) was carried out to identify the element or compound formed by
the soluble salts solution. X-ray powder diffraction (XRD) was used to support the
SEM observation result in determining the mineralogical compositions of the
fired-clay brick masonry.
1.5 Masonry materials
Bricks, especially fired-clay bricks, have been used as building materials for
thousands of years; they comprise about 15% to 17 % of building materials.
Currently, the method of production is modern and more advanced. Calcium silicate
or sand lime bricks are produced in Malaysia but only constitute a small percentage
of the total demands in the market. Calcium silicate bricks are also not as popular as
fired-clay bricks. In Malaysia, the standard size is similar with the British Standard,
which is 215 mm long x 102.5 mm wide x 65 mm high, and is bonded with a 10 mm
8
no literatures in terms of their performance in local saline environments were
discussed in-depth locally from previous researchers.
1.5.1 Fired-clay brick
Fired-clay brick is made from selected clay and is produced by shaping it to
the standard shape and size. The brick is then fired for 10 to 40 hours in a kiln at a
temperature of 750 to 1300 ºC. The time and firing temperature vary, depending on
the raw material used and the type of kiln. However, if the brick is under-fired, the
brick produced will be weak due to the poor bonding between the clay particles.
According to Lynch (1993), under-burnt brick is generally softer than its
counterparts, whereas an over-burnt brick is harder, darker, and often smaller.
Nevertheless, fired-clay bricks still have a similar size, shape, and function compared
with other types of bricks such as cement sand bricks and calcium silicate bricks but
may possess different deformation characteristics.
BS 3921:1985 classifies fired-clay brick into three classes with different
advantages and appearances: the engineering brick for situations demanding high
strength and durability, the common brick for general building work, and the facing
brick for interior work. Fired-clay bricks are also classified according to their
resistance to soluble salt content and frost; however, due to the climatic conditions in
Malaysia, MS 76: 1972 did not consider frost resistance in the design.
The classification of fired-clay bricks depends on compressive strength and
9
compressive strength, which is relevant to the strength of a masonry wall. The
compressive strength depends on the dimensions and types of units. Bingel (1993)
reported that the clay used in brick production is a very variable material and as a
result, the properties of brick, such as water absorption, elastic modulus, and
strength, can vary widely even if the bricks come from the same batch of units. Wild
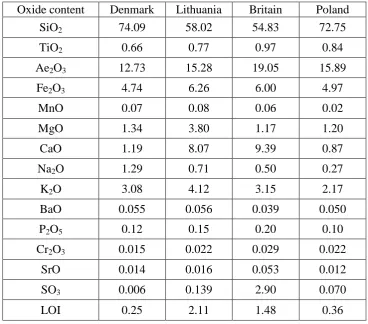
et al. (1997) analysed the chemical composition of the four fired-clay brick types
from Britain, Denmark, Lithuania and Poland (Table 1.1). There found that the
[image:34.595.134.503.359.683.2]chemical composition of the four fired-clay brick types are similar.
Table 1.1: Chemical composition (wt%) of the four fired clay brick types (Wild et al.1997)
Oxide content Denmark Lithuania Britain Poland
SiO2 74.09 58.02 54.83 72.75
TiO2 0.66 0.77 0.97 0.84
Ae2O3 12.73 15.28 19.05 15.89
Fe2O3 4.74 6.26 6.00 4.97
MnO 0.07 0.08 0.06 0.02
MgO 1.34 3.80 1.17 1.20
CaO 1.19 8.07 9.39 0.87
Na2O 1.29 0.71 0.50 0.27
K2O 3.08 4.12 3.15 2.17
BaO 0.055 0.056 0.039 0.050
P2O5 0.12 0.15 0.20 0.10
Cr2O3 0.015 0.022 0.029 0.022
SrO 0.014 0.016 0.053 0.012
SO3 0.006 0.139 2.90 0.070
10 1.5.2 Calcium silicate brick
Calcium silicate bricks are considered advanced building materials
manufactured by mixing silica sand, lime, and water. Aggregates such as crushed
rocks or flints may be incorporated to alter the performance and appearance.
According to Nurdeen (2011) indicated that the main oxide that comprised the
highest mass was silica (SiO2) with a mass about, 84%; lime (CaO), 5 to 10%;
alumina and oxide of iron, 2%; water, magnesia and alkalis, 7%, respectively. The
mixture is then pressed with a high pressure and undergoes autoclaving, which
involves curing in high pressure steam about 400°F for several hours.
In the autoclave, the lime reacts chemically with the silica to produce calcium
silicate hydrate, which acts as the binding medium. They are also available in several
colors, depending on the pigment added at the mixing stage. In contrast to that of
fired-clay bricks, the strength of calcium silicate bricks is lower, and its size also
shrinks with time. Its dimensional control is also better than that of fired-clay brick.
Calcium silicate bricks are also suitable for use in both external and internal
walling. They are available as common or facing bricks. As for fired-clay bricks, the
calcium silicate bricks also are available in a solid or a frogged units and are made to
11 1.5.3 Mortar
Mortar is the second component in brickwork, accounting for as little as 7
percent of the volume of a masonry wall. Good mortar is a vital importance in all
brickwork because it bonds the units together, to carry the weight placed on the wall
and seals the joint to provide a weatherproof wall. However, the role it plays and the
influence it has on performance and appearance are far greater than the proportion
used (Beningfield, 1999).
BS 5628-3:2001 describes mortar for building to be composed of one part
binder, which is cement or lime or both, and three parts sand to give a workable mix;
this has been used for a very long time. BS 5628: Part 1 gives the specifications for
the various mortar grades used. Sufficient water is added to achieve suitable
workability for the bricklayer to spread the mortar smoothly. However the
satisfactory mix for most works is one part hydrated lime, one part cement and six
parts sand by volume. Lime cement mortar is most suitable because it combines the
advantages of good workability with early strength. It should be used up within an
hour of mixing, however, it is not suitable for works below the damp course level.
In define the quality of mortar, ASTM C270 focuses on three masonry
properties such as water retention, air content and compressive strength. However,
these parameters only present a limited view of characteristics of the mortar. Other
parameters such as workability, durability and chemical composition of the mortar
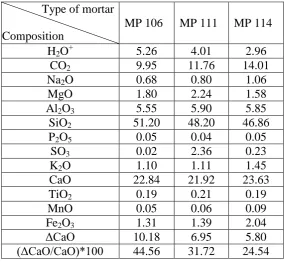
are also important. In study the chemical composition of the samples from medieval
city walss, Franzini et al. (2000) found that, the mortar is mainly composed of SiO2
12
The cement lime mortars generally have low strength but are able to
accommodate large movements without signs of distress. However, cement mortars
are not suitable for use with some other types of masonry units. The selection of the
mortar mix depends on such factors as consistency, durability, and its ability to bond
with the masonry unit (Lawrence, 2008). In addition, although similar mixes are
[image:37.595.176.461.290.552.2]used, the strength of mortar in practice may vary.
Table 1.2: Chemical composition of the mortar (wt%), Franzini et al. (2000)
MP 106 MP 111 MP 114
H2O+ 5.26 4.01 2.96
CO2 9.95 11.76 14.01
Na2O 0.68 0.80 1.06
MgO 1.80 2.24 1.58
Al2O3 5.55 5.90 5.85
SiO2 51.20 48.20 46.86
P2O5 0.05 0.04 0.05
SO3 0.02 2.36 0.23
K2O 1.10 1.11 1.45
CaO 22.84 21.92 23.63
TiO2 0.19 0.21 0.19
MnO 0.05 0.06 0.09
Fe2O3 1.31 1.39 2.04
ΔCaO 10.18 6.95 5.80
(ΔCaO/CaO)*100 44.56 31.72 24.54
1.6 Definition of terms
1.6.1 Durability
Durability is defined as the ability of the material to remain serviceable for an
acceptable period without excessive or unexpected maintenance. For brickwork, it
refers to the resistance of the masonry wall to attacks by soluble salts. Durability also Composition
13
depends on the environmental condition because the difference in exposure has
obvious effects on durability. In general, mortar is less durable than fired-clay and
calcium silicate bricks because it contains reactive and binders such as ordinary
Portland cement. It also has a high porosity and lower hardness and abrasion
resistance.
1.6.2 Evaporation process
Evaporation is a thermal separation process that occurs only on the surface of
the specimens. The evaporation rate for the external surface of masonry materials is
related to the nature of the wall surface and environmental condition. In most cases,
the concentrate resulting from the evaporation process is the final product. For the
masonry wall, the final products of evaporation process are efflorescence, which
grows on the surface of the masonry walls, and crystal, which grows underneath the
surface.
1.6.3 Efflorescence
Efflorescence occurs when soluble salts transported by moisture cannot
evaporate and are left behind on the wall surface as white efflorescence. The
presence of this compound does not deteriorate the masonry structure but causes
problems in aesthetics. Efflorescence depends on the soluble salt content as well as
14 Time
Shrinkage
Expansion
M
oi
st
ur
e M
ove
m
ent
(mic
ro
str
ain
)
1.6.4 Moisture movement
Moisture movements in masonry depend on the type of masonry unit and are
related to the percentage of moisture absorbed. They also depend on the deformation
properties of mortar. They can either shrink or expand and may either be reversible
or irreversible. However, the total moisture movement is very dependent on the
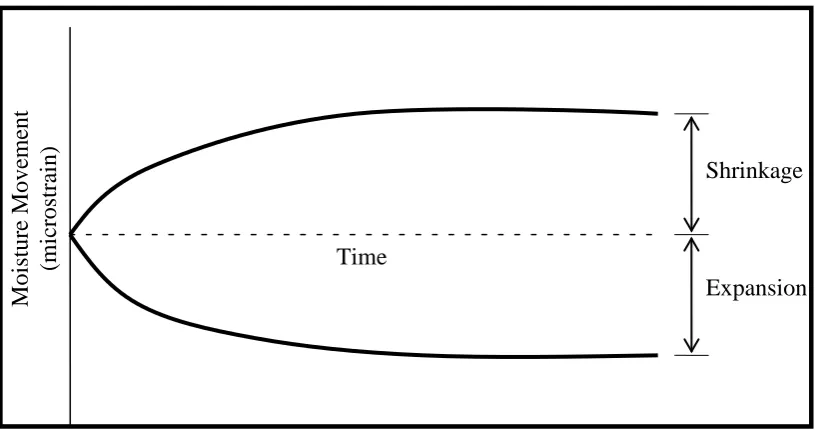
difference between the shrinkage and the moisture expansion of the masonry wall. In
this research, the moisture movements for unloaded masonry are defined, as shown
[image:39.595.112.525.304.519.2]in Figure 1.1.
Figure 1.1: Moisture movement of unloaded specimen
1.6.4.1 Expansion
Moisture expansion is the main cause of volume instability in masonry
materials. The moisture expansion is generated by the fired-clay brick. After removal
from the kiln, the fired-clay units exhibit a small growth due to its exposure to water
vapor or water. The fired-clay units start to expand from the time they begin to cool
15 1.6.4.2 Shrinkage
Shrinkage is defined as the time-dependent strain generated due to moisture
loss through evaporation at a constant temperature without load. The shrinkage is
generated by the mortar and calcium silicate bricks. It is a volumetric effect and is
expressed as a linear strain because it is normally measured on a structural element
by the determination of length change.
1.6.5 Compressive strength
The strength of a material is its ability to resist force, which is equal to the
stress that the material can resist. It is the most important property and can be used to
assure the engineering quality in the application of building materials. Strength is
also normally proportional to the modulus of elasticity; thus, when strength
decreases, a reduction in elasticity occurs. Mortar has a tendency to influence the
strength of masonry wall. Although bricks have high strength and elasticity, when
combined with the mortar, they can resist the vertical load. If the strength of the
mortar joint is low, the masonry wall strength is not reduced, but if the thickness
varies, the strength could be inconsistent. Furthermore, incomplete mortar bed joints
give rise to stress concentration, which causes the failure of the masonry under
relatively low strength.
1.6.6 Modulus of elasticity
The modulus of elasticity is defined as the ratio of stress to a corresponding
16
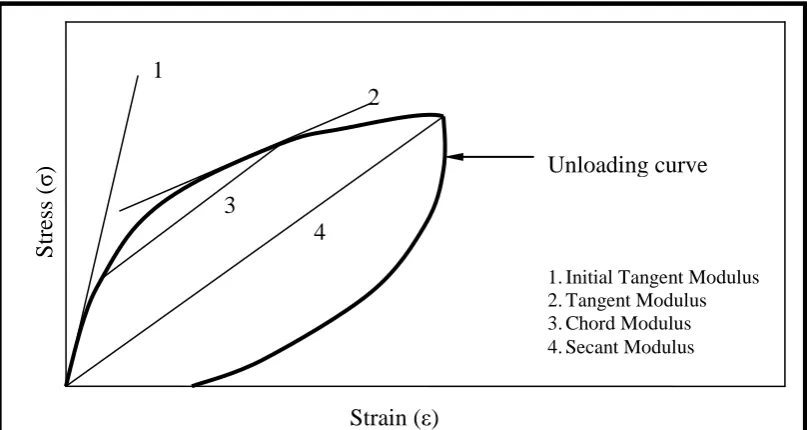
masonry is classified as non-elastic and non-linear. There are four different
definitions of elastic modulus for masonry: secant modulus, chord modulus, initial
tangent modulus, and tangent modulus (Figure 1.2). In this report, the elastic
modulus cited the tangent moduli at the elastic range of the stress-strain curves as
[image:41.595.118.522.225.440.2]shown in curve 2 in Figure 1.2.
Figure 1.2: Types of elastic modulus measurement for masonry
S
tr
ess (
σ
)
Strain (ε)
1. Initial Tangent Modulus 2. Tangent Modulus 3. Chord Modulus 4. Secant Modulus Unloading curve
4 3
1
17 CHAPTER 2
LITERATURE REVIEW
2.1 Introduction
This chapter discusses the effect of salt attack and the factors that influence
the formation of the crystallizing salt in masonry structures. A general literature
review of research carried out on elasticity and moisture movement affecting
masonry structures is also presented.
2.2 Salt attack in masonry material
Salt attack is a process that needs a combination of permeable masonry,
moisture, soluble salt, and evaporation. The effect of salt attack on masonry material
and structures can present in different forms, i.e., efflorescence, scaling, cracking,
crumbling, and softening.
Salt attack is also one of the physical phenomena that is strictly controlled
and prevented to make the material more durable. This phenomenon can cause the
decay and deterioration of masonry material. Decay and deterioration occur when
evaporation process takes place underneath the surface, leaving the salts to grow as
crystals in the masonry pores. In addition, the growth pressure of developing crystals
18
the physical properties of brick unit and mortar joint. Espinosa et al. (2008a),
Rijniers et al. (2005), and Buchwald and Kaps (2000) agreed that the cause of decay
and deterioration is due to the influence of the existence and movement of water and
damaging salt. In Australia, salt attack has been the primary mechanism of more
severe masonry decays (Young, 1995). Espinosa et al. (2008b) noted that a
significant part of the damage of building material is due to the salts contained in the
pores of the material caused by the hygroscopic properties of soluble salts solutions.
Zsembery (2001) revealed that not all salts that exist in moisture can cause
damage, more so are liable to attack. In addition, Zsembery (2001) indicated that, in
practice the most common case of salt attack are due to the existence of sodium
sulphate and sodium chloride. It contrast, Young (1995) found that the types of salt
commonly presence in masonry walls are sodium chloride and calcium sulphate.
Binda and Molina (1990) revealed that sulphate is one of the salt types most
frequently found and is destructive for masonry materials. The nature of the masonry
is very important because it is influence the amount of salt required to cause damage.
However, more than 0.5% by weight is considered a cause for concern.
Bucea et al. (2005) studied the effect of sodium sulphate and sodium chloride
in the brick-mortar stack. The sulphate and chloride solution used are about 6.2% and
14% by weight volume (w/v) as recommended by AS4456.10. These are then
exposed to seven cycles with seven days wet and seven days dry for each cycle.
After one cycle, the salt appeared on the surface of the brick, and the mortars
deteriorated, causing the binder to lose its cohesion. However, after seven cycles, the
19
due to the crystallization of sodium sulphate and sodium chloride. According to
Benevente et al. (2004), who studied salt crystallization in porous stone,
efflorescence is produced if salt crystallization in porous stone occurs on the surface
of the stone, whereas subflourescence is produced if salt crystallization occurs in the
porous media of the stone. Salt subflorescence usually produces more decay than salt
efflorescence.
Salt resistance on fired-clay brick was studied by Phillips and Zsembery
(1982) using a cycling test method. The bricks were exposed for 2 hours to sodium
chloride and sodium sulphate, both having a concentration of 14% (w/v). These were
then dried for 22 hours at 110 ºC. The number of cycles ranged from 1 to 80 cycles,
depending on the type and quality of the brick such as firing temperature. The study
reported that less sodium chloride cycles with an average of 4 to13 cycles are needed
to cause failure in specimens fired at a lower temperature ranging from 900 to1000
°C compared with the case with sodium sulphate with an average of 8 to15 cycles. In
specimens fired at 1050°C, sodium sulphate caused failure in a limited number of
cycles, whereas many of the specimens survived a large number of sodium chloride
cycles. This is parallel with the study conducted by Van Hees and Brocken (2004),
which also reported that sodium sulphate provides more severe conditions than
sodium chloride because with sodium sulphate, brick masonry showed intensive
brick spalling and scaling and was pushed out of the mortar joints. However, when
the masonry was treated with siloxane after contamination with salt, the damage of
the masonry exposed to sodium chloride was more serious than that exposed to
20
The effects of sodium and magnesium sulphate on the masonry mortar were
explored by Lee et al. (2008) and Santhanam et al. (2002). Lee et al. (2008) cured
the specimens in the solutions up to 15 month. After 15 months, the mortar
specimens deteriorated due to sulphate attack; as a result, surface damage and
reduction in compressive strength occurred. Moreover, the expansion of the mortar
specimens affected with magnesium sulphate solution was lower than that of the
mortar specimens affected with sodium sulphate solution. This situation occurred
because in different pH environments, the sulphate expansion properties are
significantly related to the stability of products caused by sulphate attack (Al
Amoudi et al. 1995).
Brickwork is a composite material made up of a combination of mortars and
bricks. When expansion occurs in mortar, the effect is normally on the overall
expansion of the brickwork. DeVekey (2008) explained that sometimes, small
horizontal cracks are visible in the center of the wall because mortar is typically
affected more within the body of the wall than on the surface. Due to the greater
expansion in the center of the wall, which remains wetter for longer periods than the
outside, axial cracks may appear on the external elevation in thick masonry.
However, lateral cracking may occur as well, but it is expected to be less obvious
when there is a high axial load stress.
2.3 Factors influencing salt attack in masonry structure
The factors influencing the salt attack are very important and will be
21
mortar mixes, moisture, and temperature and humidity must be present for salt decay
to occur because if any one factor is removed from the process, salt attack could be
prevented (DeVekey, 2008).
2.3.1 Soluble salt
Soluble salt is one of the main factors as if desirable for salt attack. It can be
derived from an external source, as discussed in Section 1.2, and can also occur
naturally in the material’s body, such as fired-clay brick. Soluble salts in fired-clay
brick are developed by the reaction between sulfur oxides formed during firing and
minerals present in the brick (Edgell, 2005). The common problem associated with
soluble salt in masonry wall is the formation of efflorescence on the surface.
However, efflorescence is an aesthetic problem and can be removed with water. A
more serious effect occurs when a high level of soluble salt is present in the masonry
materials, causing the crystallization of salt to occur underneath the surface of the
brickwork material, as discussed in Section 2.2.
Bricks are classified according to their resistance to soluble salt content and
frost. However, due to humid and warm climates, resistance to frost attack was
neglected in the conditions set in Malaysia. The soluble salt limits for fired-clay
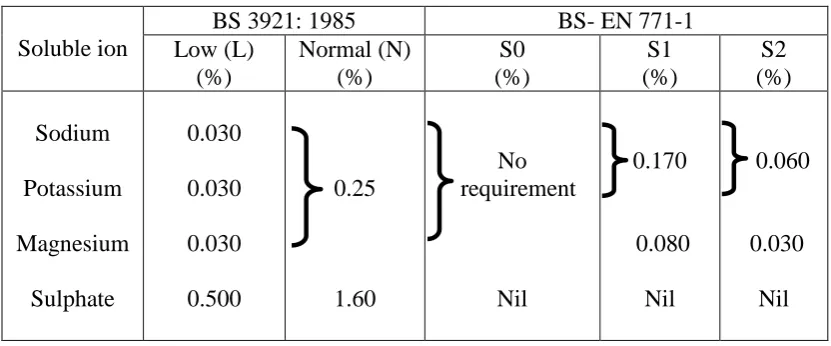
bricks as given in BS EN 771 Part 1 and BS 3921:1985, is shows in Table 2.1.
However, BS EN 771 Part 2 and BS 187: 1978 do not discuss the soluble salt limits
22
Table 2.1: Category limits for active water soluble salts
BS EN 771-1 classifies three categories of soluble salt contents, namely, S0,
S1, and S2, as presented in Table 2.1. Category S0 comprises bricks not subject to
any limit on specified soluble salt. It is intended for use in situations where the total
protection against water penetration is provided. However, category S1 gives a limit
for bricks on soluble salt, including sodium, potassium, and magnesium contents. In
category S2, bricks have a lower limit than those in S1. In contrast, BS 3921:1985
limits the soluble salt content of fired clay brick unit into two categories. The first
category is Low (L) class with restrictions on the ions of magnesium, potassium, and
sodium as well as on the total amount of sulphate. The second category is the Normal
(N) class with limits on the amount of specific soluble salts as a combination of
sodium, magnesium, and potassium as well as on the total amount of sulphate. This
classification is very important for the durability of the masonry wall aspect because
soluble salt can damage and deteriorate the cement mortar if it is continuously
exposed to moisture or wet conditions. Soluble ion
BS 3921: 1985 BS- EN 771-1
Low (L) (%)
Normal (N) (%)
S0 (%)
S1 (%)
S2 (%)
Sodium
Potassium
Magnesium
Sulphate
0.030
0.030
0.030
0.500
0.25
1.60
No requirement
Nil
0.170
0.080
Nil
0.060
0.030
23
2.3.2 Microstructure
The movement of soluble salt within the bricks unit is one of the most
important factors in the development of crystallization pressure. Salt crystallization
greatly depends on the pore structure parameter. Benavente et al. (2006) classified
the main pore structure parameters into three: porosity, pore size distribution, and
pore shape. Porosity is defined as the ratio of the volume of voids to the total volume
of bricks and is expressed as percentage. Specifically, connected porosity is related
to the flow of weathering agents and the remaining moisture or dampness in such a
way that it produces negative effects on the durability of the brick. Additionally,
porous bricks with high porosity and a large percentage of pores measuring less than
1–2.5 micrometer in radius have a tendency to decay (Benevente et al. 2006).
Most masonry building materials, such as fired-clay and calcium silicate
bricks, are permeable or, to some extent, porous that they contain voids or pores.
Such permeable structures allow water vapor to be transmitted and also allow water
to penetrate. Water or moisture can penetrate permeable masonry materials due to
natural capillary absorption such that the masonry in contact with the soil draws
ground water into its pores by capillary action. According to BS 3921:1985, a water
absorption test can be carried out using 24 hours of cold water test or 5 hours of
boiling water test. BS3921 classifies water absorption for Engineering Class A (≤
4.5%) and Engineering Class B (≤ 7.0%). However, for design purposes, BS5628:
Part 1 has three categories of water absorption to characterize flexural strength: less
than 7%, between 7% and 12%, and more than 12%. Water or moisture generally
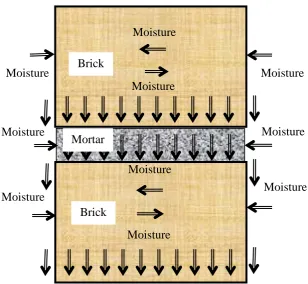
carries the soluble salt to the masonry material. Figure 2.1 shows the schematic
24
Figure 2.1: Water absorption process in masonry exposed to water spray
The rate of crystallization pressure depends on the size of the pore, where low
pressure will be generated if the pore size is large (Scherer, 1999). Ordonez et al.
(1997) recognized the durability of the stone based on the fact that crystallization
pressure is inversely related to pore size, extrapolating salt stress from one pore to
the whole porous stone. This fact is established by defining the durability
dimensional estimator (DDE) as follows:
(
−1)
m
DDE µ =
∑
[
Dv( )
ri /ri]
Pconc [2.1]where,
Dv = pore size distribution
ri = pore size
Pconc = connected porosity
Porosity is related to the mineralogical composition of the raw material, as
clay bricks manufactured with a high sand fraction have a tendency to be extremely Moisture
Moisture Moisture
Moisture Moisture
Moisture Brick
Brick Mortar
Moisture
Moisture Moisture
310 REFERENCES
Abdullah C. S. (1988), Influence of geometry on creep & moisture movement of clay, calcium silicate and concrete masonry, PhD Thesis Department of Civil
Engineering, University of Leeds, United Kingdom.
Abu Bakar, B. H. (1998) Influence of anisotrophy and curing on deformation of masonry. Ph.D Thesis, Department of Civil Engineering, University of Leeds,
United Kingdom.
Ahmad, A. G. (2004), Scientific Studies And Laboratory Tests In The Restoration Of Old Town Hall, Georgetown, Penang, Persidangan Kebangsaan Sains dan Teknologi Dalam Pemuliharaan Warisan Negara:
Mengintegrasi Sains, Teknologi dan Warisan, Kuala Lumpur: Jabatan
Muzium dan Antikuiti Malaysia, pp. 47- 59.
ACI-530-92/ASCE-5-92. (1996) Building code requirement for concete masonry structures. ACI Manual of Concrete Practice Part 5.
Al-Amoudi, O. S. B. (2002) Durability of plain and blended cements in marine environments. Journal of Advances in Cement Research. Vol. 14, No. 3, pp. 89 – 100.
Al-Amoudi, O. S. B., Maslehuddin, M & Abdul-Al, Y. A. B. (1995) Role of chloride ions on expansion and strength reduction in plain and blended cements in sulfate environments. Construction and Building Materials. Vol. 9, No. 1, pp. 25-33.