Using SERVQUAL: A Framework for Determining and
Prioritizing Critical Factors in Delivering Quality Services
for the Mobile Operator
Hana Stverkova
Faculty of Economics, VSB – Technical University of Ostrava, Czech Republic
Copyright © 2015 by authors, all rights reserved. Authors agree that this article remains permanently open access under the terms of the Creative Commons Attribution License 4.0 International License
Abstract
In today's turbulent world, the most important element for each organization is the satisfied customer. This necessity underlines the need for developing measures that can estimate the current level of services provision, since measurement is the first step towards improvement. Measuring the existing level of services provided can help managers make better decisions for improving customer satisfaction. The purpose of the present study is to (a) measure the level of services provided by mobile operators’ in the Czech Republic, (b) evaluate the satisfaction of the mobile operators customers and (c) the present study investigated the gap between customer expectations and customer perceptions with regard to the level of the services offered by the mobile operators in the Czech Republic. Field survey was conducted in October 2014, respondents were users of mobile operator. The paper presents a practical demonstration of the application of the SERVQUAL method for a mobile operator. This simple procedure can be applied to all areas of service provision. Results showed that customers have a negative perception about the services offered by mobile operators.Keywords
Service, Quality, Competitiveness, Customer, Satisfaction, SERVQUAL1. Introduction
In today's turbulent world, the most important element for each organization is the satisfied customer. In the current business environment, only the innovative businesses which meet the needs of its customers are competitive. In a global environment of intense competition and continuous change, companies need to focus on improving the level of their services and enhance the satisfaction of their customers in order to stay competitive and achieve long-term survival. An idea is not enough, but the important is the implementation and commercial applications. Customers are more
demanding, they have access to a wide range of information, from competitive products through price comparison to reference of other consumers, so they are very good oriented in the market offer. Companies should therefore pay close attention not only to existing customers but also potential customers and, ultimately, dissatisfied customers to be able to attract new clients and of their weaknesses transform into opportunities. Research on quality of services should be in the current competitive environment for every business strategic objective. Based on a literature review was SERVQUAL method chosen as the most widely recognized scale in service quality. [12, 11, 13] Even many researchers using the SERVQUAL addressed, some questioned its reliability and validity of the scale. However, SERVQUAL has maintained its position as a pioneering tool that is used by service providers in search of consumer data. The aim of this paper is to present a model measuring the customer satisfaction – the service quality assessment called SERVQUAL. The objective of this study is to examine the service quality of mobile operator in the Czech Republic as perceived by its customers. SERVQUAL covers five service quality dimensions including 22 items. The second aim is to evaluate the contribution by each SERVQUAL dimensions and the third objective is to estimate gap analysis between expected and perceived service quality. The priority of every company should therefore be keeping a regular customer, ideally loyal and satisfied. The main benefit of using these tools measure the quality of both the questionnaire survey, SERVQUAL method, or other methods of measuring customer satisfaction as ECSI method, or QFD, is to reduce costs, time savings, including the administrative simplification operation of the business and ultimately greater insight about customers.
It is essential that companies devote time to their customers, identify their needs and wishes so that they develop positive relationships. A satisfied customer is a source of income and means half of the success.
acquisition and retention of customers. The competitiveness of a company depends on the ability of the company to flexibly and quickly react to changes in the business environment, especially to changes in requirements and wishes of the customers. Enterprise management creates principles and methods for achieving competitiveness through business strategy, philosophy and strategic goals. A satisfied customer is a key element for the company competitiveness. [8]
2. Materials and Methods
Quality of service and customer satisfaction are very important concepts that affect competitiveness and hence growth business. Without understanding these concepts cannot exist companies in the market, keep or be handed over to its successor. It is therefore necessary that the companies are able to analyse customer requirements and at the same time they were able to understand, assess level of fulfilment of their requirements and on the basis of these analyses draw implications to improve the quality of their services or products to meet customer needs. Quality is considered as a very important area of business management, because management quality leads to higher customer satisfaction, profitability, cost reduction, customer loyalty and retention on the market.
Customer cares together with innovation are key factors of competitiveness, which help to enhance the image of each organization. The primary starting point is the knowledge of the real needs of the customer, continuous monitoring of their needs, motives and habits so as to be able to implement this knowledge into business plans and activities. The goal of each organization must be to obtain and maintain strategic customers who will regularly bring enterprise profit. Research has proven that 10% of strategic customer brings in more than 50% of total sales. [7]
In the first stage of the customer life cycle is needed the identification of the customers and their needs, requirements and expectations so that customers can be segmented into target groups. According to Blecharz [1] there are four basic principles of customer care and openness, proactivity, fair and customer knowledge. Openness can be described as the cornerstone of a long-term partnership that is based on mutual trust. Proactivity are seen not only in response to complaints from customers, but also foresight in terms of identifying the needs and desires of customers. In order to grow and maintain the client must be identified characters satisfaction.
2.1. Customer Satisfaction
Character of satisfaction is the formulation of requirements so that they understand the customer. The requirement of the customer is the customer's ideal that you created on the basis of their own needs, experience and
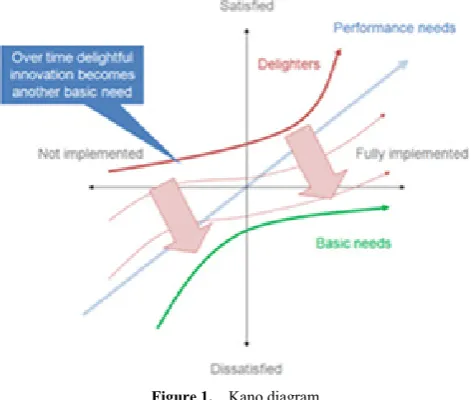
neighborhood information obtained. Characteristics of customer needs help the team to focus attention on areas that ensure higher competitiveness. [4, 5] Characteristics are performed in two ways using Kano model (Kano characteristics) or importance (weight). Kano Model Analysis is a useful technique for deciding which features you want to include in a product or service. [3]It helps you break away from a profit-minimizing mindset that says you've got to have as many features as possible in a product, and helps you think more subtly about the features you include. This can be the difference between a product or service being profitable or unprofitable.
[image:2.595.314.550.334.534.2]More than this, it helps you develop a product that will truly delight your customers. According to the Kano Model (developed by Dr Noriaki Kano in the 1984), a product or service can have three types of attribute (or property). Threshold Attributes affect customers' satisfaction with the product or service by their absence: If they're not present, customers are dissatisfied. And even if they're present, if no other attributes are present, customers aren't particularly happy. [3] Figure 1 shows the Kano characteristics.
Figure 1. Kano diagram
2.2. SERVQUAL
One way to faithfully and reliably assess customer requirements, their expectations, and to discover the level of quality of services provided is generally recognized method of evaluating the quality of services known as SERVQUAL model. Service Quality Assessment is a method of measuring the quality of services developed in the 80s in the US and gradually revised and developed. Its cornerstone is the so-called paradigm conflict between the ideas of customers and what service they receive. Research using SERVQUAL method is based on GAP model. The methodology therefore works with gaps between the different components of the process of providing services that the customer perceives.
The authors of the methods are A. Parasuraman, V. A. Zeithaml and L. L. Berry. On the basis of the qualitative research was in 1985, generated ten spaces and on the basis of 97 questions. The criteria used by consumers in assessing service quality fit 10 potentially overlapping dimensions. These dimensions are tangibles, reliability, responsiveness, communication, credibility, security, competence, courtesy, understanding or knowing the customer and access. The gap between expectations and perceptions form the basis for measurement of the perceived quality of the services. [2] The subsequent modifications which led to the improvement of the model have been generated for five areas, which are used today. Overlapping was reduced and the five dimensions were finalized through the scale purification approach. These are tangibles, reliability, responsiveness, assurance and empathy. The measures about customers´ expectation and perception of service quality are developed in a questionnaire for each of the five dimensions. The customers are obtained on a 7 point scale. Scores are computed as perception minus expectation, and after statistical processing the perceived quality is revealed. [4, 6] Thus the SERVQUAL model became the major approach for perception of service quality.
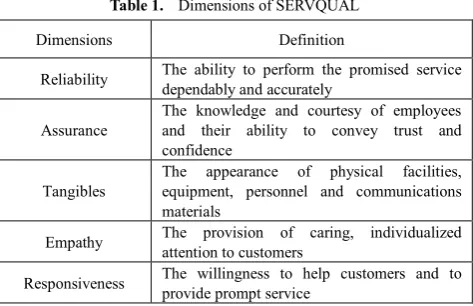
[image:3.595.60.297.554.707.2]The five dimensions of service quality are m tangibles, reliability, responsiveness, assurance and empathy. [2]
Table 1. Dimensions of SERVQUAL
Dimensions Definition
Reliability The ability to perform the promised service dependably and accurately
Assurance The knowledge and courtesy of employees and their ability to convey trust and confidence
Tangibles The appearance of physical facilities, equipment, personnel and communications materials
Empathy The provision of caring, individualized attention to customers
Responsiveness The willingness to help customers and to provide prompt service
These five areas are also interviewing customers on sub-area expectations and satisfaction, which is divided further 21 properties that describe the various aspects of the
described levels from two perspectives of the client, and the expectations and perceptions. The resulting system consists of 42 questions and statements that the customer evaluates the questionnaire using Likert scale, usually on a scale from 1 to 7 points (from full consent to the full disagreement). The greater the difference between the expected and perceived quality represented by the average mark point, the higher the level of service provided. Respondents also assessed the relative importance of all five dimensions and their order. Using the SERVQUAL method to evaluate the research can be conducted by the analysis of the individual questions in the questionnaire, by the analysis of each dimension and finally can make the assessment of overall satisfaction.
The actual interpretation of the resulting figures based on thresholds determining satisfaction or dissatisfaction with the quality of services. This feature is usually a value of -1. If the value is higher, then the respondents are satisfied with the offered services (with minor reservations). Otherwise, the property becomes lower, which indicates the relative dissatisfaction of the interviewee. As a result, this limit value multiplied by personal preferences. In case such a value becomes a number less than -20, the property is functional quality is considered poor. [6]
The advantage of SERVQUAL methodology is general use, for example for comparison service levels with other firms in the industry. The method tries to accommodate service area as fully and get the most reliable data. It provides information about the degree of fulfilment or non-fulfilment of customer expectations and helps reveal the biggest shortcomings of quality services. This allows companies to choose the most effective measures to enhance customer satisfaction.
The relative importance of these variables is also measured. This enables you to compute the relative importance of any gaps between expectation and perceptions. Management can then focus on strategies and tactics to close the important gaps.
SERVQUAL can be used or adapted to measure service quality in variety of service settings. Another advantage is that it can be used for compare competitors and wide range of services.
2.4. GAP Model
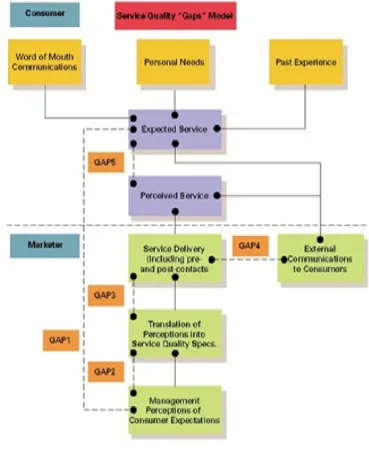
There exist 5 gaps. The first gap presents the difference between what the customer expects and what the company's management believes that expected. In order to reduce this gap, it is necessary to survey opinions of customers and record important dates, listen to staff who come into contact with clients or flatten the hierarchical structure of society. Management always perceive what customers really want. The second gap occurs when disagreement characteristics of services that create business and customer expectations. Management might correctly perceive customer, but does not provide performance standards. Gap 3 is created when
[image:4.595.118.488.243.700.2]systems of service delivery (staff, technology and processes) to comply with the standards guaranteed customers. Employees may be, for example, poorly trained, unwilling or unable to follow the established standards. Gap 4 happens when the firm through other media proclaims a different level of service than finally provides fulfilled promises of advertising. Consumer expectations are affected by statements by representatives of the company and just ads. Gap 5 is the result of all previous gaps, spacing from 1 to 4 ads the resulting difference between what customers expect and what the company offers. Now this gap is evaluated by customers using the SERVQUAL model. The GAP model is shown on this figure.
2.5. SERVQUAL for Mobile Operator
[image:5.595.327.534.250.423.2]The survey instrument or questionnaire was adapted from the standard SERVQUAL scales. The original 22 SERVQUAL items were translated into Czech language, and their content validity (wording and meaning) was checked carefully by the researcher of this study. A pre-test was then conducted with a group of mobile operator customers, and minor changes to the survey were made accordingly. A five-point Likert scale was used for each of the 22 statements of service quality. The first section of the questionnaire contained the 22 statements for measuring customer expectations of ideal mobile operator, whereas the second section was composed of the same 22 statements for measuring customer perceptions of mobile operator service quality. Satisfaction was measured using five-point scales (1=not satisfied at all to 5=very satisfied). The three behavioral variables were scaled from 1 (not at all) to 5 (absolutely true). For a practical demonstration is a specific example of evaluation of services the mobile operator. Evaluation of the first dimension is based on the answers of the respondents used the services of the provider. Hundred respondents were interviewed, 41 women and 59 men.
Table 2. Tangibles - values
Tangibles Expectation Perception Claim gap Gap
Modern–look equipment 4,61 3,63 -0,98
-0,62
Equipment attacks attention 4,39 3,98 -0,41
Appearance of personnel 4,43 3,72 -0,71
Engaging materials 4,44 4,08 -0,36
The quality of the tangibles was defined by four
indicators listed in the table 2 that were defined in the questionnaire. Evaluated data can also be visualized using a jet chart.
For a comprehensive illustration is available table 3 with response rates of individual respondents in the first dimension.
The other four quality areas are evaluated in the same manner. For a comprehensive evaluation is also necessary to assign a weight to each area of importance in consumer preferences. Each respondent has 100 points, which redistributed to the five areas (tangibles, reliability, responsiveness, assurance and empathy). Figure 3 show the personal customer preferences are evaluated on the basis of the arithmetic average of all respondents.
Figure 3. Personal customer preferences.
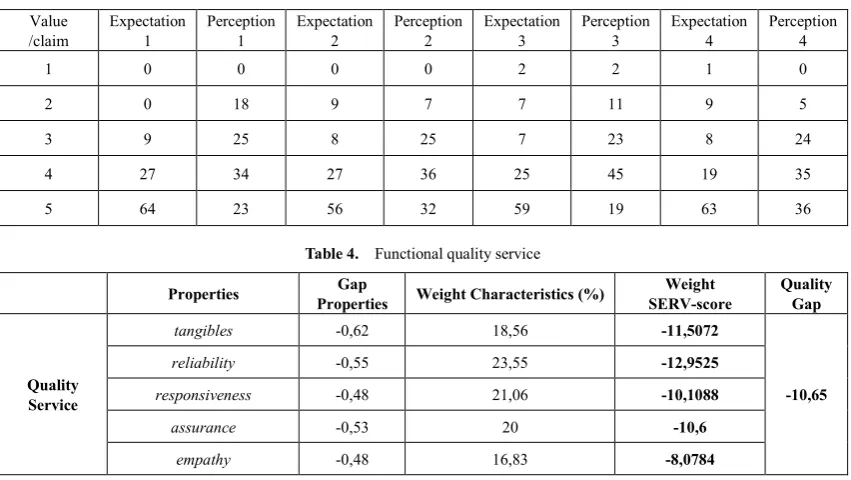
[image:5.595.56.302.358.463.2]To obtain verified data, it is necessary to incorporate personal preferences final functional values of quality of service shown in table 4.
Table 3. Response rate Value
/claim Expectation 1 Perception 1 Expectation 2 Perception 2 Expectation 3 Perception 3 Expectation 4 Perception 4
1 0 0 0 0 2 2 1 0
2 0 18 9 7 7 11 9 5
3 9 25 8 25 7 23 8 24
4 27 34 27 36 25 45 19 35
5 64 23 56 32 59 19 63 36
Table 4. Functional quality service
Properties Properties Gap Weight Characteristics (%) SERV-score Weight Quality Gap
Quality Service
tangibles -0,62 18,56 -11,5072
-10,65
reliability -0,55 23,55 -12,9525
responsiveness -0,48 21,06 -10,1088
assurance -0,53 20 -10,6
[image:5.595.93.519.501.741.2]From these data it is possible to obtain basic information on the achieved quality of service of mobile operator and on that basis to draw the consequences and measures leading to customer satisfaction and thereby enhance the competitiveness of the enterprise. As can be seen, the mean of perceptions on each item differs very significantly from that of expectations on the corresponding item. Hence, in general, the perceived service quality offered by mobile operator in the Czech Republic did not meet customers’ expectations. An individual item analysis revealed that the customers appeared to be most dissatisfied with mobile operator performance in the following areas (the most severe gaps between expectations and perceptions under each item):
The biggest gap is in reliability, the problem was in keep promises and show sincere interest in solving customer problems. The second dimension with high score of gap was tangibles, the problem is in modern–look equipment and employees are net-appealing. In the dimension of responsiveness is problem in prompt service and willingness to help by the employees.
To help the company identify areas for improvement and implement changes to enhance service quality, the results of the analyses were presented to and discussed with a group of senior managers. After careful discussion and analysis of the gaps identified above, there was identified the following specific areas as areas that would benefit from improvement. The first and very important point is to provide more training to their front-line service staff to enhance their customer service skills. The training should focus on employees’ ability to help customers resolve their queries and problems quickly. In the process of resolving such problems, they should show a caring attitude and a sincere interest in helping their customers. Furthermore, employees should improve their knowledge and skills so that they can provide a fast and dependable service to their customers. Training will be conducted cyclically, will be conducted mystery shopping that employees are evaluated and their knowledge could be continuously evaluated. The training costs within regional branches will be in the order of 50,000 crowns for all employees, ie. an average of 1,000 crowns per person per year and selected managers will be training for specific soft skills and they lead their subordinates and train them. To improve generally the managers and author suggested that the company must provide more support to empower the employees so that they would be able to provide a more prompt and higher quality service. Furthermore, that front-line staff should be trained to be more polite to customers.
To reduce the gap in the dimension labeled tangibles, the group proposed designing new uniforms for front-line service employees. They also suggested developing guidelines for front-line employees aimed at encouraging these employees to look their best at all times. New uniforms will mean an increase in costs per employee by 1000 crowns per year. The employee will be penalize for failure to wear uniforms.
In general, the SERVQUAL scale appeared to be useful in identifying specific service problems and priorities necessary to address in order to provide quality service experiences for the customers.
3. Conclusions
The company would meet for the proper functioning of all processes, including their permanent improvement should be based on the knowledge and requirements of satisfied and even unsatisfied customers. A satisfied customer comes back and recommends in particular services to their friends. However, the company must seek as well as a disgruntled client. It is necessary to ascertain the reason for his discontent and seek ways to remedy the problem, how do you get the customer back to your side. Continuous monitoring of customer satisfaction and needs is the first key building block of success.
The customer is according Mateides [7] satisfied either, and is expected to repeat purchases, re-use of services, loyalty, good references and obtaining new clients, or dissatisfied, which does the opposite. The priority of every company should therefore be keeping a regular customer, ideally loyal and satisfied. The main benefit of using these tools measure the quality of both the questionnaire survey, SERVQUAL method, or other methods of measuring customer satisfaction as ECSI method, or QFD, is to reduce costs, time savings, including the administrative simplification operation of the business and ultimately greater insight about customers.
Despite the problem and criticisms related to SERVQUAL model as measure of service quality, many scholars and practitioners have applied this instrument to a variety of services sectors. [14] In using this instrument, questions have often been raised about the usefulness of the scale as a diagnostic tool in monitoring and managing service development, the adequateness of its dimensionality, and how well the scale can be used to predict service outcomes such as overall satisfaction and switching behavior. The collective findings have shown mixed support for SERVQUAL as a standard measure of satisfaction within service industries (see [10] for a review). Significant variations have been found with regard to the reliability and validity of SERVQUAL across different service sectors and national contexts. [14] Since services are intangible, heterogeneous and inseparable, it is difficult to measure service quality objectively. Over the years, many researchers have proposed and evaluated alternative service quality models and instruments for measuring service quality. Among these models, SERVQUAL made by Parasuraman et al., is the most prominent and the most widely used. Using the SERVQUAL instrument, we were able to help a company identify important areas for improvement in its business.
the quality is not the same in all European countries? How do Czech consumers evaluate service quality? How do cultural factors influence customer evaluation of service quality? These questions and others still remain as central questions for future research activities.
REFERENCES
P. Blecharz, H. Stverkova, Product Quality and Customer [1]
Benefit“ in International Symposium on Applied Economics, Business and Development, ISAEBD 2011, vol. 208, Berlin: SPRINGER-VERLAG BERLIN, 2011, 382 - 388 p. B. Wai Fong Yu, Using SERVQUAL to Measure Users' [2]
Satisfaction of Computer Support in Higher Educational Environments. Ann Arbor , US: ProQuest, 2008.
J. Nenadal, Measurement of quality management systems. [3]
(Měření v systémech managementu jakosti). Prague, Czech Republic: Management Press, 2004.
L. Wankhade and B. Dabade, Quality Uncertainty and [4]
Perception: Information Asymmetry and Management of Quality Uncertainty and Quality Perception. New York, US: Springer Science & Business Media, 2010.
S. Dodrajka, Total Quality Management. New Delhi, India: [5]
Deep & Deep Publications, 2007.
A. Gilmore, Services Marketing and Management. Thousand [6]
Oaks, CA: SAGE, 2003.
A. Mateides, Customer satisfaction and its methods of [7]
measurement 2 (Spokojnosť zákazníka a metódy jej merania 2). Slovakia: Epos, 2000.
H. Stverkova, The SMEs competitiveness & service quality [8]
evaluating not only in the CZ. Saarbrücken, Germany: LAP LAMBERT Academic Publishing, 2013.
ICASMT 2014. Service quality assessment of the mobile [9]
operator. Proceedings of ICASMT 2014. Mudranik Technologies Pvt. Ltd (e-book), 2014.
F. Buttle, SERVQUAL: Review, Critique, Research Agenda, [10]
Journal of Marketing, 30, 8-32, 1996.
N.K. Avkiran, Quality Customer Service Demands Human [11]
Contact, The International Journal of Bank Marketing, 17, 61-71, 1999.
N.K Avkiran, Developing an Instrument to Measure [12]
Customer Service Quality in Branch Banking, The International Journal of Bank Marketing, 12, 10-18, 1994. K.Bahia, and J. Nantel, A Reliable and Valid Measurement [13]
Scale for the Perceived Service Quality of Banks, The International Journal of Bank Marketing, 18, 84-91, 2000. Lianxi Zhou, Ye Zhang, and Jia Xu, A Critical Assessment of [14]