Evaluation of Reference Genes for Differential Gene
Expression Study of Bovine Tuberculosis
Ailam Lim
1,2,*, Steven Bolin
21Breathitt Veterinary Center, Murray State University, United States
2Department of Pathobiology and Diagnostic Investigation, Michigan State University, United States
Copyright©2017 by authors, all rights reserved. Authors agree that this article remains permanently open access under the terms of the Creative Commons Attribution License 4.0 International License
Abstract
Relative quantitative real-time PCR (qPCR) assays serve as important tools for validating differential gene expression data. A reference gene that is stably expressed across sample types and experimental treatments is crucial for accuracy in interpretation of relative qPCR data. Twelve previously validated reference genes were evaluated in this study to identify a most suitable reference gene that can be used for gene expression study of bovine tuberculosis (bTB) infected and bTB test-false positive cattle, in peripheral blood mononuclear cells after a 4 hour or after an overnight stimulation with bovine tuberculin antigen. Stability of the candidate reference genes were evaluated using the BestKeeper, geNorm and NormFinder programs. The SDHA was found to be the most stably expressed reference gene, regardless of infection status and varying length (4 hours or overnight) of antigen stimulation, while expression of many widely used reference genes are not stable under the studied experimental conditions. We also confirmed that the geNorm and NormFinder programs yielded similar findings in determining the stability of reference genes, which differ largely from the BestKeeper program. This finding stresses the importance of validating the reference gene(s) chosen for each experimental study, and the need for using multiple programs for the evaluation.Keywords
Reference Genes, Gene Expression,Quantitative Real-time PCR, Bovine Tuberculosis, Peripheral Blood Mononuclear Cells
1. Introduction
Quantitative real-time PCR (qPCR) has become the method of choice for quantification of gene expression levels. It is a very sensitive and accurate method for quantification of mRNA transcripts, allowing a direct measure of differential transcription of mRNA for genes of interest, and an indirect measure of regulation of gene expression in
biological process [1, 2]. Relative qPCR is a rapid and robust method for quantification, and is preferred over the absolute qPCR when the absolute copy number of mRNA is not required [1]. In relative qPCR, a reference gene is used to normalize disparities in RNA recovery and cDNA synthesis efficiency. This permits true comparisons of gene regulation between samples from within a group, and between samples among different groups [1, 3, 4]. The reference gene is subjected to the same experimental conditions as the genes of interest, and thus serves as a normalizer for correction of experimental variability. The underlying assumption is that the reference gene is expressed at a constant level, and the level of expression remains unchanged across sample types and experimental treatments. Thus, the detected level of expression of the reference gene will correlate with experimental error, which can be normalized directly. Use of a reference gene with an expression level that fluctuates randomly can lead to increased non-specific variation, and use of a reference gene with an expression level that changes with the sample type or with experimental treatments can lead to erroneous interpretation of data [1, 5, 6].
qPCR amplification plots for rRNA target that affects the baseline subtraction step in qPCR analysis [2]. Proper validation of reference genes under specific experimental conditions and sample types is critical for accurate gene quantification by the relative qPCR method [6].
Several programs such as BestKeeper [12], geNorm [10] and NormFinder [13] have been developed to evaluate the stability of candidate reference genes. These programs employ different algorithms for calculation of stability values, which may result in different estimates for a stability value. Side by side evaluations using 2 or all 3 of these programs have shown that the best agreement is between geNorm and NormFinder for ranking the most and least stable genes [14-16]. To date, there is no single best program for ranking of suboptimal reference genes. The ranking of the candidate genes by 2 or all 3 programs may be necessary before deciding on the best choice for a reference gene [17]. Alternatively, a normalization factor based on 2 to 3 reference genes has been proposed for use as the normalizer. Use of multiple reference genes for a normalization factor can improve the accuracy of quantification [10]. However, this method is costly, labor intensive, and not practical for use with a large number of samples or when resources are limited. This is because all of the normalizer genes must be included on every qPCR plate for every sample [10, 18].
Bovine tuberculosis (bTB) is a high impact disease for both animal and human health [19]. A microarray hybridization study was used to examine gene expression profiles from small groups of bTB infected and antemortem test-false positive cattle in the state of Michigan in the United States [20-21]. The overall results showed that differential gene expression profiles exist between test-false positive and true bTB infected cattle. Quantitative real-time PCR (qPCR) assays were chosen to validate differential gene expression data derived from the microarray hybridizations, and to test selected molecular markers for differential diagnosis of the disease.
In this study, a search for a suitable reference gene was performed to identify the best candidate gene that can be used for qPCR of gene expression profile of bTB infected and bTB test-false positive cattle, using mRNA harvested from peripheral blood mononuclear cells (PBMC) after a 4 hour or overnight stimulation with bovine tuberculin antigen (bPPD). Before the initiation of the study, a literature search was performed to identify reference genes previously used in gene expression studies employing i) various bovine sample types, ii) leukocytes or peripheral blood mononuclear cells (PBMC) of species other than bovine, or iii) antigen stimulation studies of human tuberculosis patients. Twelve commonly used and previously validated reference genes were chosen for evaluation using the BestKeeper, geNorm and NormFinder programs. The objective of this study was to determine the most suitable reference gene (with minimal variability in expression level) for qPCR assays of differential gene expression of bTB infected and bTB
test-false positive cattle after a 4 hour or overnight stimulation with bPPD.
2. Materials and Methods
A total of 12 commonly used reference genes as listed in Table 1 were selected from the literature to be considered for use in this study. Published primer sequences for those genes were evaluated in bioinformatics software (a). Primers that met the study criteria were used as published, otherwise new primers were designed using available software (a, b). All primers were synthesized commercially (c), concentration of the PCR primers and qPCR conditions were evaluated and optimized prior to testing of the samples (Table 1).
2.1. Experimental Animals and bTB Infection Status Experimental animals in this study consisted of cattle culled from herds because they showed positive reactions in antemortem diagnostic tests for bTB. The cattle were transported to the Diagnostic Center for Population and Animal Health at Michigan State University the day before a regulatory bTB postmortem examination was done.
Three study groups of cattle were used, which included bTB positive cattle (bTBP) that were positive reactors in antemortem diagnostic tests for bTB and confirmed positive for bTB by postmortem examination; double test-false positive reactor cattle (DFP) that were positive reactors on primary and secondary antemortem diagnostic tests and were negative for bTB on postmortem examination; and single test-false positive cattle (SFP) that originated from bTB positive farms. This last group of cattle was positive reactors in primary and negative on secondary antemortem diagnostic tests, and was negative for bTB on postmortem examination.
2.2. Blood Collection and Antigen Stimulation
Table 1. Reference genes selected for qPCR evaluation, with sequence and concentration (nM) of PCR primers used [forward primer (F) and reverse primer (R)] and amplicon sizes (bp).
gene name symbol gene sequences (5’ -3’) amplicon size (bp) concentration ( nM)
actin, beta ACTB R: GGGTGTAACGCAGCTAACAG F: TGTCCACCTTCCAGCAGATG 108 50
beta-2-microglobulin B2M R: GCGCAAAACACCCTGAAGAC F: AGTAAGCCGCAGTGGAGGTG 110 50
glyceraldehyde-3-phosphate dehydrogenase GAPDH F: GCATCG TGGAGG GACTTA TGA R: GGGCCA TCCACA GTCTTC TG 67 50
histone H2A.l H2A R: AGTTACCCTTGCGGAGCAG F: GTCGTGGCAAGCAAGGAG 111 900
H3 Histone, family 3A H3F3A F: ATGGCTCGTACAAAGCAGAC R: ACCAGGCCTGTAACGATGAG 135 50
hydroxymethylbilane synthase HMBS F: GCATGCTTTGGAGAGGAATGA R: AATGGTGAAGCCAGGAGGAA 85 300
hypoxanthine phosphoribosyltransferase 1 HPRTI R: TGTTGTGGGATATGCCCTTGAC F: CGGACTCTCATCTTAGGCTTTG 109 100
regulator of chromosome condensation 1 RPII R: GCATAGCTCACCCTCAGTTC F: TCTACTTACTCGCCCACCTC 115 100
succinate dehydrogenase complex
subunit A SDHA R: CGTAGGAGAGCGTGTGCTTC F: CCACGCCAGGGAGGACTTC 116 50
TATA box binding protein TBP R: GTGGAGTCAGTCCTGTGCCGTAA F: ACAACAGCCTCCCACCCTATGC 111 900
tyrosine 3-monooxygenase/tryptophan 5-mono-oxygenase
activation protein, zeta polypeptide YWHAZ R: AGGCAAAGACAATGACAGAC F: GCATCCCACAGACTATTTCC 122 50
ubiquitin carboxyl-terminal hydrolase L5 UBC F: CTCCCTACCTGCATCATGTG R: GGAATTTGGGCCAGTGCTC 72 50
2.3. Isolation of Peripheral Blood Mononuclear Cells, and Purification of RNA
After stimulation, the blood was centrifuged at 1200 x g for 15 minutes at 18°C to form layers of plasma, buffy coat cells, and red blood cells. Buffy coat cells and 2 ml of red blood cells immediately below the buffy coat cell layer were harvested and transferred to new 50 ml conical tubes. Two rounds of hypotonic lysis of red blood cells were performed by addition of ice-cold diethyl pyrocarbonate treated-sterile de-ionized water for 2 minutes, followed by addition of an equal volume of ice-cold diethyl pyrocarbonate-treated sterile 2X saline (1.7 % w/v NaCl). Intact cells were pelleted by centrifugation at 1200 x g for 15 minutes at 18°C after the first round of hypotonic lyses, then at 190 x g for 10 minutes at 4°C after the second round. After the second round of hypotonic lyses, the supernatant was decanted and 1 ml TRIzol Reagent (e) was added to the loose cell pellet for each 9 ml beginning volume of whole blood. This mixture was frozen at -84°C until use. For isolation of RNA, the mixture was thawed on ice, and subjected to 10 passages through a 20 gauge needle. The resulting homogenate was divided into 1 ml aliquots and the remainder of the RNA extraction procedure was performed according to the manufacturer’s recommendations. The total cellular RNA from each animal was then pooled into a single tube and treated with RQ1 RNase-Free DNase (f) according to manufacturer’s recommendations. The treated RNA was extracted again using equal volumes of phenol-chloroform, followed by purification using MEGAclear Purification Kit (g). The purified RNA was immediately stored at -84°C until use.
Before use, the RNA from each of the study cattle was thawed on ice and the integrity and concentration of the RNA was determined using an Agilent 2100 Bioanalyzer and RNA Nano 6000 Kit (h).
2.4. cDNA Synthesis
Synthesis of cDNA was performed with 2 µg of total RNA from each study animal using Superscript™ II Reverse Transcriptase and Oligo (dT) 12-18 Primer (e), according to manufacturer’s recommendations. Upon completion of cDNA synthesis, the RNA template in each reaction was removed with 1U of RNase H (e). The cDNA was purified using QuickClean Enzyme Removal Resin (i) according to the manufacturer’s recommendations. The concentration of purified cDNA was measured using NanoDrop ND-1000, and diluted to final concentration of 10 ng/µl. All cDNA were stored at -20°C until use in qPCR assays.
2.5. qPCR Assay
obtained.
2.6. qPCR Data Analysis
The raw cycle threshold (Ct) value for each reaction was exported into an Excel spreadsheet; the ΔCt value was
calculated as the difference in Ct of a stimulated sample (4 hours/overnight) from the Ct of the non-stimulated sample from a given animal [Ct(stimulated) minus Ct(unstimulated)].
The stability of each reference gene was evaluated and compared in BestKeeper, geNorm and NormFinder programs. The most stable gene, as determined by use of all programs, was selected and used as the reference gene for subsequent qPCR assay.
3. Results
Initially, RNA samples from 6 cattle (2 from each group) were used to test the 12 selected reference genes (Table 1) using qPCR assay. The qPCR data (Ct value) of the 12 reference genes were generated for each animal using RNA that was subjected to 3 different treatments (samples without stimulation, 4 hours or overnight antigen stimulation). The data were then evaluated using the BestKeeper, geNorm and NormFinder programs. Both the geNorm and the
NormFinder programs used the ΔCt value for calculation of
the stability value, while the BestKeeper used the raw Ct
value. The ΔCt value was calculated as [Ct(4
hours/overnight stimulated sample)] minus [Ct (no antigen stimulation sample)], and the 2
^
-ΔCt value was used to compute the stability value in the NormFinder or the geNorm programs.In the geNorm program, the gene expression stability measure (M) for a reference gene was calculated as the average pairwise variation (V) for that gene with all other tested reference genes. Stepwise exclusion of the gene with the highest M value then allowed ranking of the tested genes according to their expression stability. The NormFinder program utilized a mathematical model to estimate the reference gene’s stability based on direct estimation of expression variation and the taking into account of sample subgroups within the data (no sample subgroup was defined in the current study). In the BestKeeper program, the raw Ct values of all data points were used to compute the geometric means, arithmetic means and standard deviation for each reference gene. Stability of the reference gene was determined based on repeated pair-wise correlation analysis and standard deviation of geometric means.
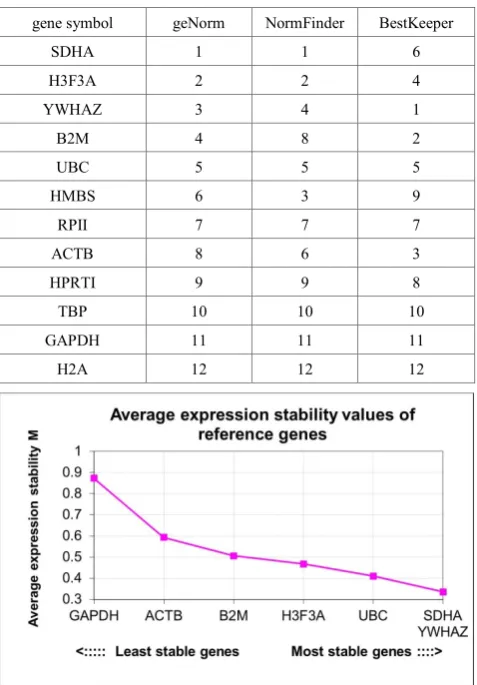
The ranking of the stability values for all 12 reference genes by the three programs is listed in Table 2. The stability ranking for the reference genes varied among the 3 programs, especially with the BestKeeper program that was not based on ΔCt values. Significant discrepancies were observed for a few genes, such as SDHA, B2M and ACTB. Some consistency in ranking was observed among the very
unstable gene candidates. The H2A was determined as the least stable gene, with GAPDH, TBP and HPRTI also considered as unstable genes. The most stable gene was not clearly identified using data from 6 animals tested.
[image:4.595.313.552.318.661.2]Based on the initial results, 5 of the most stable genes ranked by all 3 programs were selected for further evaluation; these genes are SDHA, H3F3A, YWHAZ, B2M and UBC. Despite the lower stability ranking, ACTB and GAPDH were also selected for further evaluation because these were the most commonly used reference genes in the published literature. Additionally, 12 blood samples that represented all 3 study groups were added to increase the sample size to 18 cattle. The qPCR assays were performed on RNA of 18 animals (each with 3 treatments, as mentioned above) for the 7 selected reference genes. Data analysis was performed as the initial run.
Table 2. Stability ranking of the 12 selected reference genes as analyzed by the geNorm, NormFinder and BestKeeper software. An 1 represents the most stable gene, while 12 represents the least stable gene determined by the program.
gene symbol geNorm NormFinder BestKeeper
SDHA 1 1 6
H3F3A 2 2 4
YWHAZ 3 4 1
B2M 4 8 2
UBC 5 5 5
HMBS 6 3 9
RPII 7 7 7
ACTB 8 6 3
HPRTI 9 9 8
TBP 10 10 10
GAPDH 11 11 11
H2A 12 12 12
Figure 1. Analysis output of the average expression stability value of the final 7 reference genes by the geNorm program.
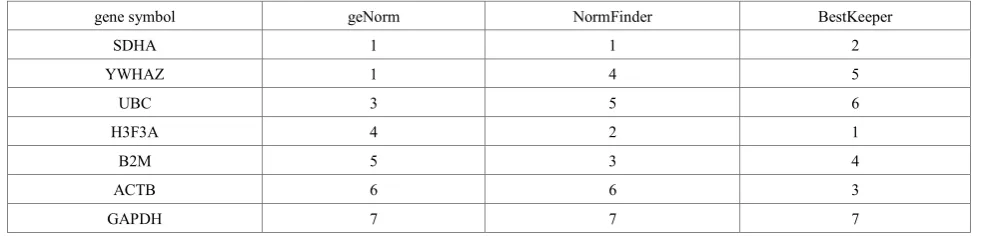
observed in stability rankings among the 3 programs. The GAPDH gene remained the most unstable among the 7 selected genes. Interestingly, ACTB was ranked the third most stable gene by the BestKeeper program and was ranked
[image:5.595.67.548.261.748.2]as second least stable gene by the other 2 programs. Overall, SDHA was shown to be the most stable gene by all 3 programs. Based on this result, SDHA was determined as the most stable reference gene for this study.
Table 3. Analysis output for the final 7 reference genes by the NormFinder program.
Gene name Stability value Standard error
SDHA 0.209 0.059
H3F3A 0.248 0.060
B2M 0.249 0.060
YWHAZ 0.254 0.060
UBC 0.278 0.061
ACTB 0.480 0.081
GAPDH 1.049 0.154
Best gene SDHA
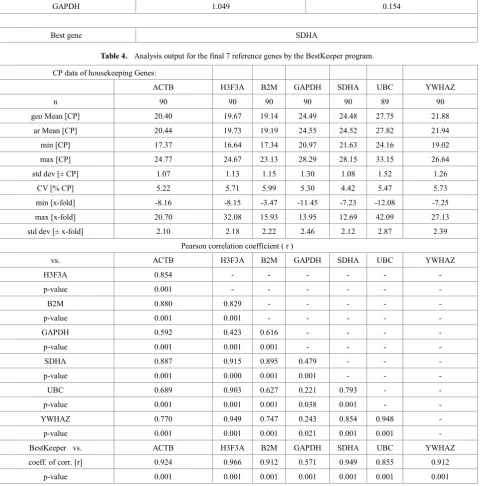
Table 4. Analysis output for the final 7 reference genes by the BestKeeper program. CP data of housekeeping Genes:
ACTB H3F3A B2M GAPDH SDHA UBC YWHAZ
n 90 90 90 90 90 89 90
geo Mean [CP] 20.40 19.67 19.14 24.49 24.48 27.75 21.88
ar Mean [CP] 20.44 19.73 19.19 24.55 24.52 27.82 21.94
min [CP] 17.37 16.64 17.34 20.97 21.63 24.16 19.02
max [CP] 24.77 24.67 23.13 28.29 28.15 33.15 26.64
std dev [± CP] 1.07 1.13 1.15 1.30 1.08 1.52 1.26
CV [% CP] 5.22 5.71 5.99 5.30 4.42 5.47 5.73
min [x-fold] -8.16 -8.15 -3.47 -11.45 -7.23 -12.08 -7.25
max [x-fold] 20.70 32.08 15.93 13.95 12.69 42.09 27.13
std dev [± x-fold] 2.10 2.18 2.22 2.46 2.12 2.87 2.39
Pearson correlation coefficient ( r )
vs. ACTB H3F3A B2M GAPDH SDHA UBC YWHAZ
H3F3A 0.854 - - - -
p-value 0.001 - - - -
B2M 0.880 0.829 - - - - -
p-value 0.001 0.001 - - - - -
GAPDH 0.592 0.423 0.616 - - - -
p-value 0.001 0.001 0.001 - - - -
SDHA 0.887 0.915 0.895 0.479 - - -
p-value 0.001 0.000 0.001 0.001 - - -
UBC 0.689 0.903 0.627 0.221 0.793 - -
p-value 0.001 0.001 0.001 0.038 0.001 - -
YWHAZ 0.770 0.949 0.747 0.243 0.854 0.948 -
p-value 0.001 0.001 0.001 0.021 0.001 0.001 -
BestKeeper vs. ACTB H3F3A B2M GAPDH SDHA UBC YWHAZ
coeff. of corr. [r] 0.924 0.966 0.912 0.571 0.949 0.855 0.912
Table 5. Stability ranking of the final 7 selected reference genes as analyzed by the geNorm, NormFinder and BestKeeper programs. An 1 represents the most stable gene, while 7 represents the least stable gene determined by the program.
gene symbol geNorm NormFinder BestKeeper
SDHA 1 1 2
YWHAZ 1 4 5
UBC 3 5 6
H3F3A 4 2 1
B2M 5 3 4
ACTB 6 6 3
GAPDH 7 7 7
4. Discussion
It is clear from the literature that expression of many housekeeping genes can be influenced by different experimental conditions, which should prevent their use in qPCR assays when those conditions are encountered [6, 7]. Based on this knowledge, 12 candidate reference genes were selected for evaluation under this study, with the goal to find the most stable reference gene that can be used in the qPCR assays for validation of differential gene expression associated with the bovine tuberculosis disease status. The experimental design of this study includes comparison of animals with and without M. bovis infection (cause of bovine tuberculosis), as well as samples with and without exposure to antigen stimulation. Under these experimental conditions, expression levels of H3F3A, YWHAZ, B2M, UBC, HMBS, RPII, ACTB, HPRTI, TBP, GAPDH and H2A were all shown to be unstable. Surprisingly, GAPDH and ACTB, the 2 most widely used reference genes in early gene expression studies by many researchers, were found to be the least stable genes. In a similar gene expression study of human tuberculosis; GAPDH, ACTB, and B2M were found unstable when tuberculin antigen stimulation was used [5]. Furthermore, the use of GAPDH as a reference gene has been reported to result in erroneous interpretation of the IL-4 gene expression in TB patients [18]. The influence of a stimulant on the expression of housekeeping genes in various cell cultures has also been reported [9, 23]. Our findings are in agreement with previous findings, suggesting that stimulation of samples with bPPD antigen has impact on the expression level of those commonly used housekeeping genes tested in this study. Wedlock et al. [22] reported increased expression of housekeeping molecules such as gamma-actin, ACTB, and B2M in M. bovis infected macrophages. Our study using comparisons of animals with and without M. bovis infection yields similar results, confirming the influence of infection status on the expression level of many commonly used housekeeping genes.
Expression levels of housekeeping genes have been found to vary among different cell types (normal versus cancerous cells) [24], different physiological states of cells [25] or infectious status [26]. All of these previous findings stressed the importance for validation of reference gene(s), to ensure
that expression is stable irrespective of the experimental conditions. In the current study, the data clearly shows the instability of many candidate reference genes under our experimental conditions. The SDHA gene encodes the succinate dehydrogenase complex subunit A protein, which is a major catalytic subunit of succinate-ubiquinone oxidoreductase, a complex of the mitochondrial respiratory chain. The SDHA gene appears stable in its expression level, and therefore has been evaluated for use as a reference gene in many research studies. For the design of this experimental study, SDHA was found to be the most stable reference gene, across the infection status (bTB positive or negative) and across experimental conditions (4 hours or overnight antigen stimulation). Stability of SDHA has been previously validated in gene expression studies involving bovine polymorphonuclear leukocytes [27], the developing bovine embryo [8], and bovine liver and pituitary tissues [28], which is in agreement with our findings.
[image:6.595.60.552.100.218.2]programs for researchers to utilize for reference genes evaluation. Without extra cost, by putting in a little extra time and effort in data analysis, researchers can be assured that they have chosen a suitable reference gene for their study and avoid possible erroneous interpretation of expression study using relative qPCR assays.
5. Conclusions
Results from this study showed that SDHA was found to be the most stable reference gene, across the infection status (bTB positive or negative) and across experimental conditions (4 hours or overnight antigen stimulation), and is thus the reference gene of choice for use under these experimental conditions. Our results also showed that expression levels of many widely used reference genes are not stable under the studied experimental conditions, thus stressing the importance of validation of suitable reference gene(s) for each experimental study. An adequate reference gene must show stable expression irrespective of the experimental conditions. In the current study, we found discrepancies among 3 commonly used programs in determining the stability of reference genes, where geNorm and NormFinder programs yield similar findings, and were seldom in agreement with the BestKeeper program. Our findings confirmed the need for using multiple programs for evaluation of candidate genes before deciding on the best choice for a reference gene for relative qPCR assays.
Notes
(a) Clone Manager Suite 7, Scientific & Educational Software, Denver, CO
(b) Primer Express 3.0, Applied Biosystems, Foster City, CA
(c) Integrated DNA Technologies, Skokie, IL (d) Prionics AG, Switzerland
(e) Invitrogen, Carlsbad, CA (f) Promega, Madison, WI (g) Ambion, Austin, TX
(h) Agilent Technologies, Santa Clara, CA (i) Clontech Laboratories, Mountain View, CA (j) Applied Biosystems, Foster City, CA
REFERENCES
[1] Bustin, S.A. Absolute quantification of mRNA using real-time reverse transcription polymerase chain reaction assays. J Mol Endocrinol25, 169-193, 2000.
[2] Hendriks-Balk, M.C., Michel, M.C., Alewijnse, A.E. Pitfalls in the normalization of real-time polymerase chain reaction data. Basic Research in Cardiology102, 195-197, 2007.
[3] Huggett, J., Dheda, K., Bustin, S., Zumla, A. Real-time RT-PCR normalisation; strategies and considerations. Genes Immun6, 279-284, 2005.
[4] Pfaffl, M.W. A new mathematical model for relative quantification in real-time RT-PCR. Nucleic Acids Research 29 (9), e45, 2001.
[5] Dheda, K., Huggett, J.F., Bustin, S.A., Johnson, M.A., Rook, G., Zumla, A. Validation of housekeeping genes for normalizing RNA expression in real-time PCR. BioTechniques 37, 112-119, 2004.
[6] Kozera, B., Rapacz, M. Reference genes in real-time PCR. Journal of Applied Genetics 54, 391-406, 2013.
[7] Bustin, S.A. Quantification of mRNA using real-time reverse transcription PCR (RT-PCR): trends and problems. J Mol Endocrinol29, 23-39, 2002.
[8] Goossens, K., Van Poucke, M., Van Soom, A., Vandesompele, J., Van Zeveren, A., Peelman, L.J. Selection of reference genes for quantitative real-time PCR in bovine preimplantation embryos. BMC Developmental Biology 5, 27 doi: 10.1186/1471-213X-5-27, 2005.
[9] Schmittgen, T.D., Zakrajsek, B.A. Effect of experimental treatment on housekeeping gene expression: validation by real-time, quantitative RT-PCR. Journal of Biochemical and Biophysical Methods46, 69-81, 2000.
[10] Vandesompele, J., De Preter, K., Pattyn, F., Poppe, B., Van Roy, N., De Paepe, A., Speleman, F. Accurate normalization of real-time quantitative RT-PCR data by geometric averaging of multiple internal control genes. Genome Biology 3, research0034.0001 - research0034.0011. doi: 0010.1186/gb-2002-0033-0037-research0034, 2002.
[11] Solanas, M., Moral, R., Escrich, E. Unsuitability of using ribosomal RNA as loading control for Northern blot analyses related to the imbalance between messenger and ribosomal RNA content in rat mammary tumors. Analytical Biochemistry288, 99-102, 2001.
[12] Pfaffl, M.W., Tichopad, A., Prgomet, C., Neuvians, T.P. Determination of stable housekeeping genes, differentially regulated target genes and sample integrity: BestKeeper - Excel-based tool using pair-wise correlations. Biotechnology Letters26, 509-515, 2004.
[13] Andersen, C.L., Jensen, J.L., Orntoft, T.F. Normalization of real-time quantitative reverse transcription-PCR data: A model-based variance estimation approach to identify genes suited for normalization, applied to bladder and colon cancer data sets. Cancer Research64, 5245-5250, 2004.
[14] Perez, R., Tupac-Yupanqui, I., Dunner, S. Evaluation of suitable reference genes for gene expression studies in bovine muscular tissue. BMC Molecular Biology 9, 79 doi: 10.1186/1471-2199-9-79, 2008.
[15] Skovgaard, K., Mortensen, S., Poulsen, K.T., Angen, O., Heegaard, P.M.H. Validation of putative reference genes for qRT-PCR normalization in tissues and blood from pigs infected with Actinobacillus pleuropneumoniae. Veterinary Immunology and Immunopathology118, 140-146, 2007. [16] Wood, S.H., Clements, D.N., McEwan, N.A., Nuttall, T.,
[17] Robinson, T.L., Sutherland, I.A., Sutherland, J. Validation of candidate bovine reference genes for use with real-time PCR. Veterinary Immunology and Immunopathology115, 160-165, 2007.
[18]Dheda, K., Huggett, J.F., Chang, J.S., Kim, L.U., Bustin, S.A., Johnson, M.A., Rook, G.A.W., Zumla, A. The implications of using an inappropriate reference gene for real-time reverse transcription PCR data normalization. Analytical Biochemistry344, 141-143, 2005.
[19]Anon., Bovine Tuberculosis Eradication: Uniform methods and rules, effective January 1, 2005. United States Department of Agriculture, Animal and Plant Health Inspection Service, Washington, 2004.
[20]Lim, A., Steibel, J.P., Coussens, P.M., Grooms, D.L., Bolin S.R. Differential gene expression segregates cattle confirmed positive for bovine tuberculosis from antemortem tuberculosis test-false positive cattle originating from herds free of bovine tuberculosis. Veterinary Medicine International, volume 2012, Article ID: 192926. http://dx.doi.org/10.1155/2012/192926, 2012.
[21]Lim, A. Identification of diagnostic molecular markers for detection of bovine tuberculosis. PhD dissertation, 2011. [22]Wedlock, D.N., Kawakami, R.P., Koach, J., Buddle, B.M.,
Collins, D.M. Differences of gene expression in bovine alveolar macrophages infected with virulent and attenuated isogenic strains of Mycobacterium bovis. International Immunopharmacology6, 957-961, 2006.
[23]Roge, R., Thorsen, J., Torring, C., Ozbay, A., Moller, B.K., Carstens, J. Commonly used reference genes are actively regulated in in vitro stimulated lymphocytes. Scandinavian
Journal of Immunology65, 202-209, 2007.
[24] Wang, X., He, J., Wang, W., Ren, M., Gao, S., Zhao, G., Wang, J., Yang, Q. Validation of internal reference genes for relative quantitation studies of gene expression in human laryngeal cancer. PeerJ 4:e2763; doi 10.7717/peerj.2763, 2016. [25] Die, J. V., Baldwin, R. L., Rowland, L.J., Li, R., Oh, S., Li, C.,
Connor, E.E., Ranilla, M-J. Selection of internal reference genes for normalization of reverse transcription quantitative polymerase chain reaction (RT-qPCR) analysis in the rumen epithelium. PLOS ONE; doi:10.1371/journal.pone.0172674, 2017.
[26] Zhao, H., Liu, J., Li, Y., Yang, C., Zhao, S., Liu, J., Liu, A., Liu, G., Yin, H., Guan, G., Luo, J. Validation of reference genes for quantitative real-time PCR in bovine PBMCs transformed and non-transformed by Theileria annulata.
Korean Journal of Parasitology 54 (1), 39-46, 2016.
[27] De Ketelaere, A., Goossens, K., Peelman, L., Burvenich, C. Validation of internal control genes for gene expression analysis in bovine polymorphonuclear leukocytes. Journal of Dairy Science89, 4066-4069, 2006.
[28] Lisowski, P., Pierzchala, M., Goscik, J., Pareek, C.S., Zwierzchowski, L. Evaluation of reference genes for studies of gene expression in the bovine liver, kidney, pituitary, and thyroid. Journal of Applied Genetics49, 367-372, 2008. [29] Hosseini, A., Sauerwein, H., Mielenz, A. Putative reference
genes for gene expression studies in propionate and
![Table 1. Reference genes selected for qPCR evaluation, with sequence and concentration (nM) of PCR primers used [forward primer (F) and reverse primer (R)] and amplicon sizes (bp)](https://thumb-us.123doks.com/thumbv2/123dok_us/8794360.910844/3.595.50.559.100.365/reference-selected-evaluation-sequence-concentration-primers-reverse-amplicon.webp)