ORIGINAL RESEARCH ARTICLE
DEVELOPMENT OF CAPACITIVE EXTENSOMETER WITH VERSATILITY SUPERIOR TO THE
RESISTIVE EXTENSOMETER
1,2,
Josivaldo G. Silva,
1Isabella F. Rondon,
1Andrés B. Cheung and
1Felipe S. Matos
1
Faculty of Engineering, Architecture and Geography, Federal University of Mato Grosso of Sul, State of Mato
Grosso of Sul, BRA
2
Post-Graduation Health Center-West, School of Medicine - FAMED, Federal University of Mato Grosso do Sul,
State of Mato Grosso do Sul, BRA
ARTICLE INFO ABSTRACT
The objective of this work was to develop a capacitive extensometer containing four identical capacitives sensors that went connected in the two branches of a Wheatstone Bridge. The electrodes of the capacitives sensors were made of stainless steel to avoid corrosion with the humidity that would impair the response of the extensometer. Each sensor has an immobile electrode measuring 8.0 mm in length, 5.0 mm in width and 0.1 mm in thickness by being bonded onto an insulation holder developed with PAI66 polyamide polymer. There are two identical mobile electrodes measuring 40.0 mm in length, 5.0 mm in width and 0.1mm in thickness, which are common to four capacitives sensors. These electrodes were bonded to the opposite faces of the same polyethylene polymer that moves when the extensometer undergoes stretching or shortening. It was verified that the extensometer can be stimulated with sinusoidal voltage higher than 10 Vac and frequency higher than 59 Hz, its response was linear with hysteresis of 3.0%, response time of 8.0 ms, resolution of 0.09 N. The new extensometer has higher sensitivity, 1.0 V while resistive extensometer presented 0.20 V. This capacitive extensometer has the potential to do measure several different physical magnitudes.
Copyright © 2018, Josivaldo G. Silva et al. This is an open access article distributed under the Creative Commons Attribution License, which permits unrestricted use, distribution, and reproduction in any medium, provided the original work is properly cited.
INTRODUCTION
The extensometers are devices that respond electrically to the deformation suffered that is due to the accomplishment of mechanical effort in the mechanical structure where they are bonded. In the case of the electrical methodology in general, the electric extensometer is used in which the deformation that occurs in the mechanical material causes variations in the capacitance, inductance or electrical resistance (Areny, 1991). Due to the importance of extensometers, scientists and companies have developed several important devices for their applications. Relevant searches showing different applications are presented in the next few paragraphs (Cobbold, 1974).
*Corresponding author: Josivaldo G. Silva
1Faculty of Engineering, Architecture and Geography, Federal University of
Mato Grosso of Sul, State of Mato Grosso of Sul, BRA
2Post-Graduation Health Center-West, School of Medicine - FAMED, Federal
University of Mato Grosso do Sul, State of Mato Grosso do Sul, BRA
Zeiser, Fellner and Wilde (2014) developed a novel capacitive strain gage with interdigital electrodes, which was processed
on Polyimide and Liquid Crystal Polymer (LCP) foil
substrates. The metallization is deposited and patterned using thin-film technology with structure sizes down to 15 µm. The characterization of the strain sensors after fabrication revealed
the gage factor (GF) as well as the cross sensitivities on
temperatures up to 100 oC and relative humidity up to 100%.
The GF of a sensor with an electrode width of 45 µm and a
clearance of 15 µm was −1.38 at a capacitance of 48 pF. The
GF of a sensor half-bridge consisting of two orthogonal
capacitors was 2.3. Zens et al. (2015) developed proposed
polydimethylsiloxane strain (PS) as a non-invasive, highly
accurate and easy to use measurement method to quantify the anterolateral and rotational loops of the knee joint during active and passive movement. In this work a prototype was developed and measurements were made using a knee test equipment, which was designed for this purpose.
ISSN: 2230-9926
International Journal of Development Research
Vol. 08, Issue, 07, pp.21736-21740, July,2018
Article History:
Received 15st April, 2018
Received in revised form 17th May, 2018
Accepted 20th June, 2018
Published online 30th July, 2018
Citation: Josivaldo G. Silva, Isabella F. Rondon, Andrés B. Cheung and Felipe S. Matos, 2018. “Development of capacitive extensometer with versatility
superior to the resistive extensometer”, International Journal of Development Research, 8, (06), 21736-21740.
ORIGINAL RESEARCH ARTICLE
OPEN ACCESS
Key Words:
Source: Author
Figure 1. CS structure
The sensitivity of the sensor was determined to be 2.038. Optimal positions of the sensors to capture the bone-to-bone displacement as the projected displacement on the skin were identified. Kim SR, Kim JH and Park JW (2017) developed
capacitive sensor(CS) or to measure deformation (ε) made with
transparent and extensible thin film based on Ag nanoparticles
(AgNWs). The AgNWs employed a capillary force lithography
(CFL) method and were incorporated into the surface of the
polydimethylsiloxane substrate. The sensitivity of the sensor
was controlled by the standardization of AgNWs in electrodes
using interdigitated form. This interdigitated capacitive
deformation sensor (ICSS) presented a GFof -1.57 at 30%
considered higher than the sensitivity of capacitive deformation sensors of traditional parallel plates. Because of
the interdigitated electrode pattern, the GF was increased to
-2.0. The ICSS did not show hysteresis for values of ε up to
15% and presented stable performance during the repeated
elongation test with ε values of 10% for 1000 cycles. The ICSS
was used to detect muscular movements of the fingers and the pulses of the human body.
This paper presents a new capacitive extensometer (Ec),
developed to be used in load cells to determine mechanical
magnitudes such as force (F), vibration, deformation εand
pressure in structural systems. The result was not affected by
the ambient temperature variationD(t), even by dielectric
permissivity variationD(x). The device is simple to build,
rugged, has affordable cost and great versatility.
Theoretical foundations: The CS structure was idealized
because the capacitance variation (Δc) due spacing variation
(ΔDmf) between the fixed electrode (Ef) and the mobile
electrode (Em) being than ΔDmf arises in the occurrence of the
force F. Figure 1 shows the fundamental structure of the CS.
Applying the Hook`s Law is obtained the equation (1) shows
the relationship between F, eL, E and As of the metal rod (B).
=e (1)
Being E: Young's Module;eL: longitudinal deformation on the
B and As: metal rod cross-sectional area. The CS or has smooth
and parallel electrodes whose initial capacitance (Ci) shown in
equation (2) does not suffer the effect of the temperature variation and also does not suffer the variation of the dielectric permittivity.
= (2) (2)
Being xi: initial dielectric permittivity; Li: initial length of Ef
and Wi: initial width of Ef. In equation (3), therefore, eL is
reformulated considering application of F normal of traction, F
normal of compression or F of shear in the B as shown below.
e = ( ) (3)
Being cf: final capacitance.
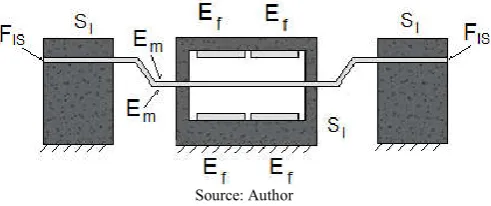
Figure 2shows the side view of the Ec developed containing
the four capacitives sensors. This Ec was bonded onto a B in
which it can be applied F. The Ef were bonded to the acrylic
insulation support (Si) while Em were separated from each
other by a flexible insulation film (Fis).
Source: Author
Figure 2. Capacitive Extensometer
If F of traction occurs on B, the vertical displacement of Em
will be upwards, reducing Dmf and therefore the Dc will be
positive. Equation (4) shows the relationship between the Dc
and F.
=D (4)
(4)
Doing , will get the equation (5).
= D (5)
If F of compression occurs on the B, the vertical displacement
of Em will be down, increasing Dmf and, therefore the Dc, will
be negative. Equation (6) shows the relationship between Dc
and F.
= − Dc (6)
Besides that, figure (2) shows three effects that occur being
that in the first caused by F the capacitives sensors S1C and
S2Cgenerate identical responses while the capacitives sensors
S3C and S4C also generate identical responses. The second
effects to consider is the of the temperature variation Dt in Li,
Wi and xi that causes Dc(t)equal in the four CS. The third effect
to consider that causes Δc of the capacitives sensors is the
variation of the external environment that causes the variation
in dielectric permittivity (Dξ). However, since the four CS are
identical Δc (ξ) is the same in all. Thus, the responses of S1C
and S2CifF of traction is shows in the equation (7).
D ( ,x, ) =D ( ) + D (x) + D ( ) (7)
While, the responses of S3C and S4Cis shows in the equation
(8).
D ( ,x, ) =D ( ) + D (x) − D ( ) (8)
Thus, the responses of S1C and S2CifF of compression is shows
in the equation (9).
[image:2.595.311.557.179.282.2]While, the responses of S3C and S4Cis shows in the equation
(10).
D ( ,x, ) =D ( ) + D (x) + D ( )
(10)
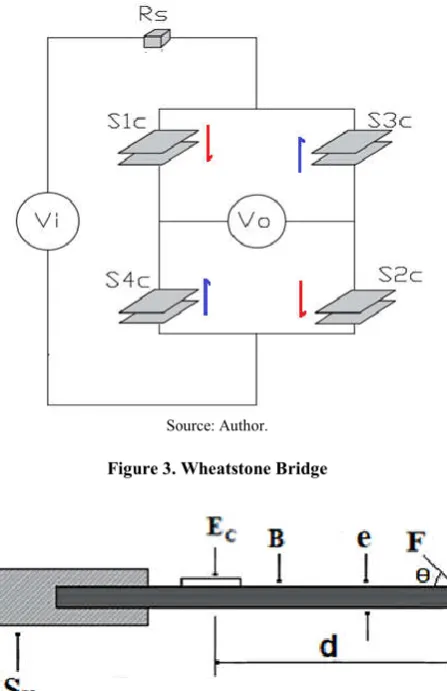
Figure 3 shows the Wheatstone Bridge circuit containing the capacitives sensors. The Ec was implemented, aiming to obtain sensitivity and to eliminate in the response V0 the undesirable
effects of ∆c(t) and ∆c(ξ). The resistance (RS) is necessary to
avoid short circuit and the positions occupied by the capacitives sensors are fundamental. Figure 4 shows the
mechanical structure of the load cell. Where the Ec was bonded
and B underwent deformation due to the application of F.
Being Su: support; e: thickness; d: distance of F to Ec.
[image:3.595.53.277.238.584.2]Source: Author.
Figure 3. Wheatstone Bridge
Source: Author
Figure 4. Load cell structure
Finally, the capacitive extensometer response is defined by equation (11).
=e ( ) (11)
Being: Poisson`s Coefficient.
Relating eL of equation (11) with quation (1) is obtained
equation (12).
= ( ) (12)
(12)
Equation (13) presents a constant k2.
= ( ) (13)
Equation (14) corresponds to the introduction of k2in the
equation (12).
=
(14)
(14)
METHODOLOGY AND MATERIALS
The current research was developed on the laboratory of Sensors, Electronic Instrumentation and Metrology of Federal University of Mato Grosso do Sul – UFMS. The project
consisted on the implementation of an Ec formed by one
capacitive Wheatstone Bridge with four identical capacitives
sensors. The design of the Wheatsonte Bridge with CSis shown
in figure 3. A resistor, made of metallic film with 150iΩ, was
connected in series with the circuit in Wheatstone Bridge,
aiming to avoid short circuit in S1C, S2C, S3Cand S4C. Each
sensor has an immobile electrode measuring 8.0 mm in length, 5.0 mm in width and 0.1 mm in thickness by being bonded
onto an insulation holder developed with PAI66 polyamide
polymer. Dmfi was 0.5 mm. The adesive used to fix Ef, Emand
Ec was a generic use cyanoacrylate, and the SIwas developed in
acrylic. The advantage of used methodology is to compare the electric potential difference in the two branches of the bridge, to eliminate the undesirable temperature variation effect and
the permittivity dielectric. Figure 3 shows the Ec formed by
one Wheatstone Bridge using one sinusoidal voltage source to
guarantee the charging (Vi), electric current and necessaries
frequency. Besides, the same Viwill allow to compensate the
Δc(t) and Δc(ξ). Vi applied by the source was about 10iVac
with frequency of 20 kHz. The model of the voltage source is
DEGEM PU 2222 (Minipa). Figure 4 shows Ec attached to B
thus constituting a type of load cell in which F was applied at
the extremity. The signal conditioning circuit was developed to process the electrical potential difference between the adjacent
branches of the Ec. The operational amplifiers (OA) LF356
(National Semiconductor), used in the signal conditioning circuit, were powered by the constant voltage source MPC 3006D (Minipa) which provided +12 V and -12 V.
Signal Conditioning Circuit: An electronic signal conditioning circuit was implemented to treat the response of
EC. The circuit was formed by five blocks (B1, B2, B3and B4)
containing OA. The block B1, made in Wein Bridge, generates
a 10 Vac voltage with a frequency of 20 kHz, to stimulate Ec.
V0was submitted to the inverting amplifier (B2) to perform
other amplification with gain of 3.103 was connected to the
bandpass filter (B3) to exclude electromagnetic noise whose
frequencies were less than 19 kHz and 21 kHz. B3 is of fourth
order with has MFB structure to operate with bandwidth of 2
kHz and gain of 10and your response was connected to the
peak detector (B4)to obtain the amplitude of the Ec response,
measured by a digital two-channel oscilloscope model 54603 B (HP).
Answer Comparison: The comparison between EC and the
conventional resistive extensometer (ER), developed with four
To apply F, a stainless steel rod with the following
characteristics was used E= 2.1x10⁵N/m2, wMR = 40.0 mm and
d = 120.0 mm. F was applied through a basket containing
standardized masses that were hung by a nylon thread. Static calibration was performed by means of five distinct additive masses in a vessel in the range of 0 g to 250.0 g, adding 50.0 g mass to the limit of 250.0 g. Then the masses were removed from the vessel gradually until returned to 0. Each mass measurement was repeated six times and table 1 shows loading of the masses into the vessel while table 2 shows the unloading of masses from the vessel. The least squares method was used to perform the linear regression, to obtain the linearization
curve and to determine the sensitivity of Ec. The calculations
involving the measurements were obtained by equation (15) and equation (16).
=
∑(15) (15)
Being A: average; Ri: measurements performed; N: number of
measurements.
. = ( ) (16) (16)
Being S.D: standard deviation. The hysteresis refers to the
difference between two exit values for the same mass, depending on the sense (increase or decrease mass) of successive values. Equation 17 shows how to calculate the hysteresis.
% ℎ
=
(17) (17)
Being MOD: maximum response difference for the same
entrance and FSO: back scale output. The resolution was
defined as the smallest change in the measured value at which the system is able to detect. The dynamic response of the new device was evaluated by applying force in the form of a pulse. The applied force was abruptly removed from the mass basket. The descent time is defined as the time required for the response of the extensometer to reach the value of 63% of the regime value.
RESULTS
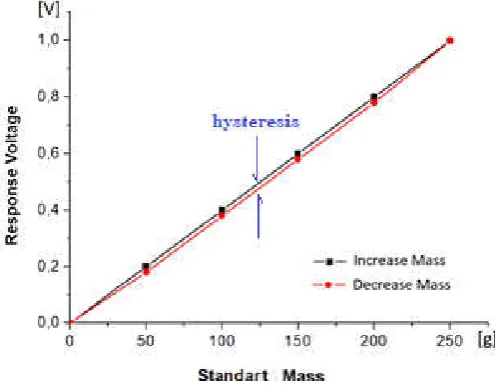
The sensor structure was projected to operate in the elastic region. Figure 5 shows the static calibration of the new extensometer being the maximum hysteresis obtained was 3%.
The MOD occurred for the force of 1.35 N. The resolution of
Ec containing the signal conditioning circuit was 0.09 N, its
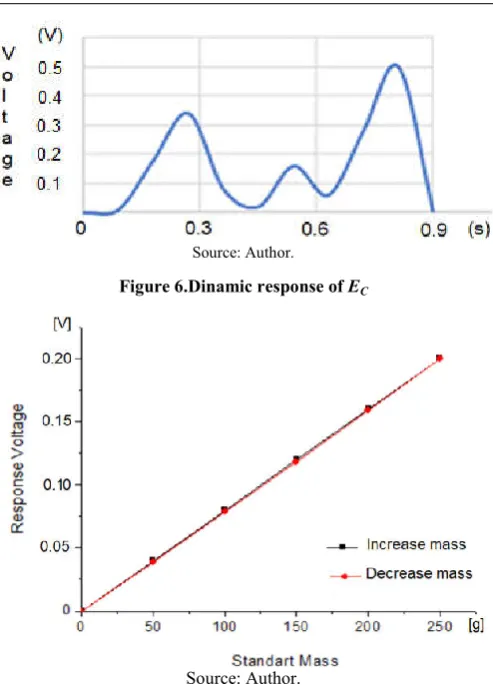
dynamic response time when cutting the wire that contained the dish containing the standardized masses was 8.0 ms, correlation coefficient was 0.9988 and the maximum response in voltage to maximum load was 1.0 V. Figure 6also shows
another dynamic response of the Ec, in a small time variation,
F was applied thereto using the hand resting on Su. Since this
response is too low, it was obtained with the utilization of a digital multimeter MDM8156 of 5.5 digits. In the case of
conventional ER, it wasn’t verified hysteresis, the dynamic
response time was 6.0ms, correlation coefficient was 0.9999 and the maximum response in voltage for maximum load was of the masses was 0.20 V. Figure 7 shows the behavior of the resistive extensometer with the loading and unloading of the same standard 50 g masses, the same container and the same limits.
[image:4.595.100.495.69.148.2] [image:4.595.96.498.195.270.2]Source: Author Figure 5. Static response of EC
Table 1. Response addingmass
MassAdded(g) Response (V) A S. D
R1 R2 R3 R4 R5 R6
00 0.00 0.00 0.00 0.00 0.00 0.00 0.00 0.00
50 0.23 0.21 0.22 0.23 0.22 0.23 0.23 0.01
100 0.50 0.48 0.49 0.50 0.49 0.49 0.49 0,01
150 0.70 0.69 0.68 0.70 0.69 0.69 0.69 0,01
200 0.93 0.90 0.91 0.93 0.93 0.92 0.92 0,01
250 1.17 1.15 1.16 1.17 1.17 1.17 1.17 0.01
Source: Author
Table 2. Response removingmass
MassDecrease(g) Response (V) A S. D
R1 R2 R3 R4 R5 R6
250 1.17 1.15 1.16 1.17 1.17 1.17 1.17 0.01
200 0.92 0.92 0.91 0.93 0.93 0.92 0.92 0.01
150 0.69 0.67 0.67 0.68 0.67 0.68 0.68 0.01
100 0.48 0.49 0.49 0.49 0.49 0.48 0.49 0.01
50 0.23 0.23 0.21 0.23 0.23 0.23 0.23 0.01
00 0.00 0.00 0.00 0.00 0.00 0.00 0.00 0.00
[image:4.595.310.558.553.747.2]Source: Author.
Figure 6.Dinamic response of EC
Source: Author.
Figure 7. Response of the ER
DISCUSSION
Is understood that the reason for the voltage response of the Ec
was much greater than the response of the ER by the fact that
the first extensometer offers less opposition to the elongation
or shortening of B. The verified hysteresis for the Ec is thought
to be caused by the excess of inappropriate adhesive in the
development of the flexible insulation film FIS located between
Em. Another factor that contributes to the appearance of the
hysteresis is due to the fact that Ec has not been submitted to
high dynamic effort in order to increase the elasticity of the
adhesive used between Em. The response time of the 8.0 ms of
Ec is worse than the response time of ER. This fact is certainly
related again to both the type and the high amount of adhesive
used to attach Em to the FIS. The small standard deviation
verified for both extensometers shows the stability of the same signal conditioning circuit applied for both cases. Although the
constructive process of Ec can still be improved with the
replacement of the adhesive, the results show the great
potential of this extensometer when composite to the ER.
The dynamic test that was performed with the right hand finger that flexed the metal rod showed that the response of the
equipment depends on the speed in applying F on B.
Conclusion
The project consisted in the implementation of a capacitive extensometer that presented robustness and sensitivity when
compared to the ER. The new extensometer has higher
sensitivity, 1.0 V while ER presented 0.20 V and was also more
versatile, as well as presented a virtually linear response, hysteresis of 3.0%, dynamic response time of 8.0 ms,
resolution of 0.09iN and maximum standard deviation of
0.01.iECshows a response frequently from 59 Hz. His setup at
Wheatstone Bridge made his response insensitive to the temperature of the place he is exposed to. The hysteresis and response time certainly resulted from the use of the type and the amount of adhesive used in the implementation of the
mobile electrodes Em. The device can be used in the
development of load cells with the objective of determining mechanical magnitudes such as force, deformation and displacement of structural systems of civil construction and Mechanical Engineering.
Acknowledgements
The National Council of Scientific and Technological Development - CNPq for the financial support in the development of this research. And finally, everyone who contributed to the accomplishment of this work, whether directly or indirectly, is registered here, thank you very much!
REFERENCES
Areny, R. P., Webster, J. W. 1991.Sensor and Signal Conditioning. New York: Wiley.
Cobbold, R. S. C. 1974. Transducers for Biomedical Measurements. New York: Wiley.
Kim, S. R., Kim, J. H. Park, J. W. 2017. Wearable and Transparent Capacitive Strain Sensor With High Sensitivity
Base on Patterned Ag Nanowire Networks. Journal of ACS
Appl Mater Interfaces. 9(31): 26407-16.
Zeiser, R., Fellner, T. Wilde, J. 2014. Capacitive strain gauges on flexible polymer substrates for wireless, intelligent
systems. Journal of Sensors and Sensor Systems – JSSS, 3,
77–86.
Zens, M., Niemeyer, P., Bernstein, A., Feucht, M. J., Kühle, J., Südkamp, N. P., Woias, P., Mayr, H. O. 2015. Novel
approach to dynamic knee laxity measurement
using capacitive strain gauges. Journal of Knee Surg Sports
Traumatol Arthrosc. 23(10):2868-75.