GA-SVC BASED SEARCH APPLIED FOR OPTIMIZATION OF IMAGE
FEATURES SUBSET IN QUALITY ESTIMATION SYSTEM OF BULK
GREEN COFFEE BEAN
Radi
1, 2, Muhammad Rivai
1and Mauridhi Hery Purnomo
11Department of Electrical Engineering, Faculty of Industrial Technology, Institut Teknologi Sepuluh Nopember, Surabaya, Indonesia 2Department of Agricultural Engineering, Faculty of Agricultural Technology, Gadjah Mada University, Yogyakarta, Indonesia
E-Mail: [email protected]
ABSTRACT
This research aims to develop a quality estimation system of bulk coffee grain based on machine vision technique that was mainly focused on finding the best subset of image feature combination. The subset was defined as the minimum number of features for achieving the reasonable level of identification or interpretation. For this purpose, a heuristic searching method based on genetic algorithm (GA) was applied to find the best feature subset from 26 image features extracted from gray channel (9-color features and 17-co-occurrence-based-textural features). The GA with binary code chromosome was designed with a support vector classifier (SVC)-based fitness function which also played as pattern recognition software for such developed-machine vision system. The experiment was started with data collection of image samples captured by a constant illumination of 200 lux of an imaging system. Besides varied the sample (7-grades for Arabica and 8-grades for Robusta), the study also evaluated some preconditioning treatments for the initial image. With a constant population of 80 chromosomes, the selection step was performed until the 20th generation with standard genetic
operations (selection, crossover, mutation, elitism), the algorithm was able to obtain an optimal feature subset consisting in average number of 5-7 features for all tested data sets. Evaluation on the analysis result shows that the best identification level was achieved from directly image processing (without preconditioning). By the pre-processing step, a quality estimation system based on selected feature subset was potentially able to estimate the quality of green coffee beans in bulk with accuracy of 86% for Arabica and 87% for Robusta coffee.
Keywords: green coffee bean, quality estimation, image feature optimization, genetic algorithm, support vector classifier.
1. INTRODUCTION
Secondary coffee processing is the downstream coffee industry which aims to produce ground coffee and other derivate products from the primary coffee grain (green coffee bean). The process includes a series of steps beginning of raw material preparation, continued with the process of roasting, blending, grinding, and packaging as well as product development of coffee derivates [1]. In the early stages, besides for management control, quality information of the raw materials is necessary for determining an appropriate treatment to be applied. Since the treatment is needed to obtain an optimum flavor of the final product, quality monitoring system of the raw materials becomes main role on the processing of coffee. Although quality classification of coffee grain in detail based on ISO standard can only be done through to the defect test, as well as it requires expert and takes a long inspection time, this technique is less appropriate to be applied in the coffee processing that runs quickly and continuously. With the standard, the raw material quality is determined based on the percentage of grain defects contained in the samples. Because the defective grains (grains burst, black, dirty) appear on the surface when such grains are exposed in bulk, assuming that the whole are homogeneous, quality of the bulk coffee grains is possible to be estimated from visual analysis of the surface appearance. In this issue, the development of machine vision may become an appropriate solution for predicting the quality of the coffee grains quickly so as to follow the processing line in the secondary coffee industry.
As a system designed for providing information or such a specific decision from an image analysis particularly focused on tasks in industry, a machine vision system includes a set of imaging technology, image acquisition, pre-processing, and software for interpretation or classification [2-3]. In other word, it consists of a set of hardware and software. Because the decision-making is inferred solely from information obtained from the image as representation of the analyzed object, the software package plays as a central role for developing a reliable and accurate-machine vision system. As usual, machine vision software includes algorithms of image processing and machine learning for identification or interpretation. Corresponding to the estimation system of green coffee bean, in which decision is interpreted from information obtained from the image surface, thus such image analysis algorithm particularly for feature extraction may become the main task.
www.arpnjournals.com
the limited number of features used in this study which only focused on combination of three-color features (mean of R, G, B) with four-features of gray level co-occurrence matrix (GLCM), i.e. the feature of energy, entropy, contrast, homogeneity. Several similar researches show that such machine vision applying more complete features provides a better level of identification. Those are the development of a machine vision system for corn variety identification [6], discrimination of wheat grain varieties [7], identification of nine Iranian wheat seed varieties [8], wheat class identification [9]. These studies generally use a fuller number of color and textural features. Therefore, we expect that a reliable quality estimation system for coffee grain can be designed by applying combination of more complete features. Because of the usefulness of color and textural features for such image retrieval, especially for the purpose of classification or identification of agricultural products [10], then the feature combination is deemed sufficient for the quality estimation system of the coffee grains.
Generally, the image textural features include four categories, namely statistical feature, model-based texture, structural texture, and transform-based texture; among them the statistical feature plays as the most widely used for classification or identification of such agricultural products [10]. Some methods have been developed for obtaining the statistical features, i.e. based on gray level co-occurrence matrix (GLCM), gray level run-length matrix (GLRM), local binary pattern (LBP), a local similarity number (LSN), and local similarity pattern (LSP). Among them, the GLCM has advantages for representing the surface profile of an image. Since the statistical feature can not be separated from the information of spectral (color), the study will be directed to evaluate the combination of GLCM and color features as descriptor features simultaneously. Because a number of GLCM features can be extracted [4,11], combined with spectral features, as well as the possibility of the use of true color coordinates (RGB) as the basis for analysis, the size of the input feature becomes large enough. Beside effects to the level of identification, a large number of feature is also contributes significantly to the computational load which may decrease performance of the system. Therefore, optimization of the combination of image features is needed in order to maximize the performance of the quality estimation system of the bulk coffee grains. This study aimed to adopt a GA-based heuristic search method for obtaining the best subset of the image features.
2. MATERIAL AND METHOD
Optimization of the feature subset for developing the quality estimation system of bulk coffee grains was carried out as follow. The study was started with designing an imaging system, at the same time, an experimental sample was prepared. The research was then continued with image data collection by capturing each sample grade (7-grades of Arabica and 8-grades for Robusta). The image data obtained from the same coffee variety was
collected as a main data set. They were two main data sets being observed, i.e. data set of Arabica and Robusta. Five pairs of training and testing data set were randomly generates from each main data set. Thus, the total of ten-pairs of training-testing data sets, each consists of a half number of the main data set, were investigated for this experiment. The training data set was needed to optimize combination of the features, while the testing data set was used to evaluate performance of the selected subset as input features of the quality estimation system. Since the testing data set is different to the testing data set, the obtained accuracy can demonstrate the estimation system performance in practice application. Schematically, procedure of this study is presented in Figure-1.
Figure-1. Experimental procedure
a) Imaging system and data collection
This experiment focused on two varieties of coffee prepared with SNI standard of green coffee bean. They are a set of Arabica coffee consisted of 7-categories (Grade I, Grade II, Grade III, Grade IV, Grade V, Grade VI, and Off Grade), and a set of Robusta coffee combined from 8-categories (Grade I, Grade II, Grade III, Grade IVA, Grade IVB, Grade V, Grade VI, and Off Grade). For image acquisition, we prepared a closed imaging chamber with size of 60x60x60 cm designed under a constant illumination of 200 lux. A camera webcam (Logitech HD C920) mounted on the centre-top of the chamber with a round of 20 cm distance to the sample. For each capturing, each sample was prepared on the area of 40x30 cm on a sample board. Each sample was captured thirty times with randomization prior to measurement. Thus, the data set of Robusta consists of 240 images, while the Arabica consists of 210 images (bitmap with size of 640x480 pixels). For this experiment, five data sets were prepared randomly from each sample variety, thus we had 10-pairs of training and testing data set (each grade consists of 15 images).
b) Preprocessing
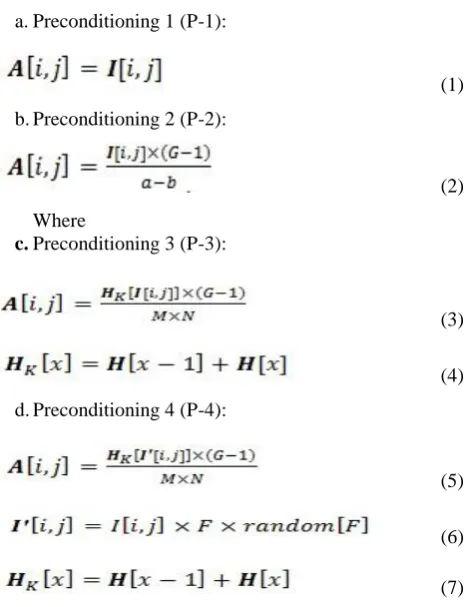
initialized by determining region of interest (ROI) of the image being analysed. Since it was obtained by cropping out 10 pixels in width of the image sample outside, the ROI of each had size of 620x460 pixels. For optimizing this stage, we investigated four different methods for preconditioning to the initial image. Suppose that I[i,j] is the initial image being processed; A[i,j] is the preconditioned image, i=0,1,..,M-1; j=0,1,..,N-1, G is the gray level, the preconditioning operations are defined as.
a. Preconditioning 1 (P-1):
(1)
b. Preconditioning 2 (P-2):
(2)
Where
c.Preconditioning 3 (P-3):
(3)
(4)
d. Preconditioning 4 (P-4):
(5)
(6)
(7)
Color features are also known as first order statistical feature obtained with the following operation. Firstly, the preconditioned image A[i,j] should be represented as a gray scale image, then the histogram p[i] (i=0,1,..,G-1) is extracted and normalized with the following equation.
(8)
[image:3.595.52.285.219.523.2]Although many features can be extracted from the normalized histogram P[i], this study only focuses on 9 color features, namely feature of energy (F1), entropy (F2), mean (F3), variance (F4), skewness (F5), kurtosis (F6), smoothness (F7), standard deviation (F8), and spot (F9), defined in Table-1.
Table 1. Color features extracted from normalized
histogram.
These color features will be combined to the second order features extracted from GLCM analysis. The GLCM analysis is started by representing the image A into a co-occurrence matrix CM [i,j] which defined as a matrix whose elements contains of a number of relative couples of color intensity in the analyzed image with certain distance of d and direction of ɵ. Since an image with G-gray level obtains a G-1xG-1 size of CM, it is considered too large for analysis, thus, for simplification, the original G-gray level of the initial image needs to be converted into a new image A'[i,j] with a lower H-gray level defined as.
(9)
Generally, the use of 16-gray level [0..15] is sufficient for this analysis. Then the new co-occurrence matrix obtained from A'[i, j] is formulated as follows.
(10)
Where Z is the pair number of k-l color-level at the distance of d and direction of ɵ. k and l is the new gray level of the scaled image A', so that the value of k,l are 0,1,2,...,H-1. The CM matrix is then normalized as following equation.
(11)
www.arpnjournals.com
Table-2. Textural features extracted from GLCM analysis.
c) Support vector classifier (SVC)
SVC is known as powerful data classification algorithm working to optimize the best partition vector (hyperplane) called as a support vector (SV). The description of the SVC algorithm for such classification task can be found in [12-14]. In simple explanation, the algorithm can be rewritten as follows. Suppose P is a set of two-class data consisting of k-pairs, written as follows.
(12)
Where 𝒙𝑖 is nf-dimensional input vector and 𝒚𝑖 is the target of two-classes data [-1,1]. For linearly separable data, classification of the data can be performed by obtaining a classifier vector 𝑓(𝒘, 𝑏) = 𝒘 ∙ 𝒙𝑖+ 𝑏, by which the data can be separated as
(13)
For simplify analysis, assuming that the data lies in the function, then two boundary vector are obtained, namely as function 𝒘 ∙ 𝒙𝑖= 1 − b for 𝑦𝑖= 1 and function of 𝒘 ∙ 𝒙𝑖= −1 − b for 𝑦𝑖= −1. In this case, a diverse function of hyperplane 𝑓(𝑤, 𝑏) can be obtained from a range of the both boundary vectors. Supposing the best hyperplane is defined as a function located on the centre of both functions, determining the origin can be obtained by
computing the margin (𝑑𝑀) from both functions, which is defined as
(14)
Therefore, the distance of the boundary to the origin can be calculated as 𝑑𝑂=
1
‖𝒘‖. Because the hyperplane is on the origin, the vector can be computed by maximizing the distance 𝑑𝑂. Algorithmically, the best classifier can be determined from any function which is then optimized by maximizing the distance 𝑑𝑂. Mathematically, it can be wrote as the following optimization functions
Minimize
(15)
(16)
In fact, many classification tasks are conducted for non-linearly separable data. In this case, the margin will never be found. Thus, the grouping task practically requires a tolerance for accommodating some infeasible data. This strategy can be done by modifying the function of boundary into softer equation which can be conducted by adding a variable of tolerance, known as non-negative slack variable {𝜉𝑖}𝑖=1𝑘 . Therefore, the new boundary function can be written as
(17)
Since the amount of data being accommodated on the slack variable needs to be determined, it requires a non-negative constant of C as a multiplier. Thus, the optimization problem becomes the following function. Minimize
(18)
(19)
Optimization problem with objectives can be formulated into a non-constrained quadratic programming function by the non-negative Lagrange multipliers ⍺i, μi which can be written as follows.
Minimize
(20)
Solving of the optimization problem can be done by minimizing the function to the variable of 𝒘, 𝑏, 𝝃𝑖 and simultaneously it should be maximized to the variable of
⍺i, μi. At the saddle points where the partial derivatives of the function to the variable 𝒘, 𝑏, 𝜉𝑖 are equal to zero, this optimization problem can be easily solved into dual problem. Thus it can be written as follows.
(21)
(22)
By providing optimum limits of the Lagrange multipliers, we can calculate the optimum weighting vector w with
𝒘 = ∑𝑘𝑖=1⍺𝑖𝒚𝑖𝒙𝑖, then
(23)
Since the number of non-zero points lie on the SV is smaller than the amount of the training data, the value of b can be determined from any support vector data as follows
(24)
In addition, the SVC algorithm offers a possibility for transforming the input data space into a feature space with higher dimension. Suppose that a linear classifier vector is not found in the input space, the SVC offers a way to extend the analysis of non-linear input vectors into a higher dimensional feature space. Since a linear classifier vector is obtained in the feature space, it can be used to separate the non-linear separable data in the initial input space. This solution can be done by modifying the multiplication of dot product of the input vectors with a specific function known as kernel trick illustrated as.
(25)
This kernel is then used to modify the equation-21. Some functions of K have been applied by researchers, namely function of linear, polynomial, radial basis, and exponent. Among them, the radial basis function (RBF) has advantages when applied for such non-linearly separable data. Thus, this study uses the RBF defined as follows
(26)
For such real problem, the classification issue is not only limited on the two-class data as well as on this experimental task. Since this study is conducted to classify sample in multi-classes data (7-grades of Arabica and 8-grades for Robusta), modification of two-classes classifier is necessary. There are three-methods widely applied, namely with methods of against-one (OAO), one-against-all (OAA), and q-class SVM. Since its possibility to be simply applied, this study uses the OAA method which can be described as follows. The OAA applies q-classifiers to separate q-different classes of data. Each classifier functions to separate one class with the other retained classes. Therefore, the ith-classifier separates the
ith-class data with the other (q-1)-classes data.
Mathematically, the decision function of ith-classifier is
(27)
Minimize:
(28)
(29)
Where
(30)
Finally the class of unknown sample x is recognized from the highest value of 𝑓𝑗(𝒙).
GA based feature optimization
A genetic algorithm is one of heuristic searching methods based on the mechanism of biological evolution. In this process, the probability of an organism to survive and reproduce strongly depends on the level of its fitness. Adopting to the terminology of genetic evaluation, finding a solution from a number of possible answers known as population is conducted through to series of genetic operations, namely selection, crossover, mutation, and elitism. In early stages, population containing a number of initial solutions is determined randomly, while in the next generation, members of the population are obtained from the evolution procedure. By the evolution routing, the population at a certain generation will be dominated by fit-individuals potentially applied as solution of the problem being solved.
Implementation of GA for optimization the feature subset potentially applied on the quality estimation system of the coffee grains is conducted as follows. Initially, combination of features is represented as chromosome. The GA operation is used to optimize the chromosomes, by which, optimal identification accuracy can be obtained. Design of the GA for this optimization can be described as follows. For example, there are nf
-features potentially to make up a solution expressed as F=[F1,F2,F3…,Fnf].
a. Chromosome design and initial population Chromosome is group of genes representing subset of features, so that, each chromosome consists of nf-genes. Supposing that each feature has an equal chance
to be selected as member of the subset, the chromosome is represented as binary code ('1' is for selected feature and '0' for others). For this study, the population is fixed at 80 chromosomes which is initialized by randomly function.
b. Evaluation function
www.arpnjournals.com
(31)
Where the Acc is the accuracy of the SVC for classifying the training data set, nf is the number of features, and s is
the number of selected features. c. Searching algorithm
Searching optimum feature subset with GA is performed by a series of process including selection, crossover, mutation, and elitism. In this study, selecting feasible individuals is conducted by a roulette wheel selection procedure. After that, the genetic process is continued by selective crossover, which begins with selection of the parent-candidates. Selected couple-parent is crossed each other to generate a new chromosome (off-spring) containing a gene-combination from both parents. The new chromosome is then used to substitute the corresponding parental chromosome in the new population. After crossover, the process is continued with mutation applied by changing the randomly selected genes. Then, the next step is known as elitism which is conducted by duplicating some high-fitness chromosomes. Finally, the new population obtained after the four-genetic operators is used to replace the previous population. The new population is called as next generation of the evolution. The genetic operation is repeated to the new population until such termination operator stops the process. After the algorithm is terminated, the fitness of the last population is then evaluated. The highest fitness of chromosome is selected as the problem solution by decoding it into a feature subset.
The subset containing a number of selected features is then used to simulate such quality estimation system of the coffee green beans. A feature subset extracted from the training data set is then trained to the corresponding SVC. A similar extraction method is also applied to the testing data set. The testing feature set is then projected into the trained SVC. The classification accuracy is obtained from the true-classified testing data.
3. RESULT AND DISCUSSION
a) Selection process
This research is focused on optimizing the combination of 26 features consisting of color and GLCM features extracted from gray channel as feature descriptors of bulk grain image of coffee bean. This optimization was conducted by searching the best feature subset, by which, such designed quality estimation system can achieve high classification performance of the green coffee bean. Based on the procedure, searching of the subset working at a feature space by applying a machine learning system can be categorized as wrapped technique [15]. As a machine learning algorithm, the GA requires some input parameters that influence its convergence. For this reason, in order to evaluate all treatments regarding to the appropriate feature extraction method, the GA was designed with constant input parameters, i.e. population size of 80 chromosomes, length of chromosome of the number of features (26),
selection, crossover, mutation, and elitism probability are 80%, 25%, 1%, and 2% sequentially. While the fitness function is formulated from combination of SVC accuracy and the number of non-selected features. Since obtaining a hyperplane as classifier vector using SVC may be completed with some methods, we consider to apply a sequential optimization proposed by [15]. For all data sets, the SVC was run under constant parameters including the RBF for kernel operation, 1 for lambda, 0.05 for gamma, 100 for C, and 1000 epochs for training iteration. While searching, the number of feature regarding to the formed subset is listed. The change in feature composition considering to the feature number at specified generation of the GA is listed on Table-3, while the average amount of feature subset at the entire generation is presented in Figure-2.
Table-3. Feature number of selected subset at different
generation.
(a)
(b)
Figure-2. Feature number of the selected subset in all
The result shows that the algorithm can optimize the subset demonstrated from its ability to minimize the number of selected features. The result also appears that no applied treatment effects on the ability of the algorithm to find the best combination subset. The algorithm ability on optimizing the feature subset is also showed from the accuracy of the fitness function. At the last iteration of searching (20th generation), with the composition of the
selected subset, the fitness function can classify the training data sets with accuracy of upper than 80% for all treatments and data sets. As final solution of this searching, the highest value of the fitness obtained at the last generation is selected. The accuracy of the system extracted from the selected fitness value for the entire data set is listed in Table 4, whereas Table-5 shows the number of feature subset obtained from the same generation. Based on distribution of the accuracy level, it is known that the preconditioning does not affect to the ability of the selected subset for classifying grades of coffee sample.
Table-4. The classification accuracy extracted from the
fitness value at 20th generation.
Table-5. Feature number of the selected subset at the 20th
generation.
Estimation accuracy
After the searching process is completed (20th
-generation), the obtained subset is then tested as an input feature vector for developing the quality estimation system. The SVC as a pattern recognition algorithm is then trained to classify the training data set based on the selected subset. To demonstrate the subset ability as
feature descriptor for the quality estimation system, the trained SVC is then tested to recognize the corresponding testing data set. The recognizing procedure is started by extracting the feature subset from the testing data set using the appropriate preconditioning. The subset is then projected on the trained SVC. The identification accuracy from the testing illustrates the performance of such selected subset for estimation of bulk coffee grain when it is applied as feature descriptor on such quality estimation system. The estimation result for recognizing the testing data set is listed in Table-6. Based on the data, it appears that preconditioning treatments influence on the accuracy of the system. Generally, it can be concluded that the best accuracy can be obtained when the feature extraction is conducted directly from the initial image. In other word, there is no preconditioning treatment needed for the feature extraction. It may be caused due to several reasons. Supposing that the fixed illumination installed in the imaging system is able to yield homogenous image samples, by which, a reliable feature is generated, thus the initial process is not required. In addition, since that the statistical features is computed from the color differenced with specified distance and angle, the applied preconditioning may obtains several vague surface properties that potentially effect on the extracted features.
Computation time
Although the searching method is easily applied, selecting a subset from highest feature space potentially causes some problems. This is especially caused by the load of computational searching. The time cost for this selection per each data set is listed on Table-7. Table-7 illustrated how much time is required for finding subset from only 26 features. It becomes one drawback of this searching method.
Table-6. Identification accuracy of the quality estimation
www.arpnjournals.com
Table-7. The average of searching time (s).
4. CONCLUSION AND FUTURE WORK
This study has applied the GA-based heuristic search method to optimize the subset of features on the machine vision-based-quality estimation system of bulk coffee grains. This wrapped searching method is able to find the appropriate feature subset. The result shows that in average of 5-7 feature combination is selected from 26 input spaces for all data sets. With the subset, a fairly high fitness value is obtained. The evaluation shows that the application of those obtained subsets for classifying the testing data sets reaches highest performance for directly preprocessing (without anything preconditioning treatments). With the process, a machine vision system for quality estimation of coffee grains in bulk is able to recognize the grades with accuracy in average of 86-87% for Arabica and Robusta coffee.
Although this method is generally easy to be applied, it needs a high computational cost. Although the number of the population can be reduced in further experiments, it certainly will affect to the ability of the algorithm in achieving the expected solution, especially when it is applied for selecting a subset from a higher feature space. In line to the recent development of such feature extraction method, for obtaining an optimal result, feature subset selection from a large number of feature spaces is required. Therefore, our next study is focusing on searching feature subset particularly by applying a combination of wrapper and filtered methods.
ACKNOWLEDGEMENTS
Some contributors supported this research, therefore we would like to grateful to Indonesian Higher of Education (DIKTI), LPDP-Kemenkeu, Gadjah Mada University, and PT. Aneka Coffee Industry (PT. ACI) Indonesia. We are also thank for any contribution from Prof. T. Nakamoto (Tokyo Institute of Technology, Japan) and his Laboratory’s member, Ms. Lily Sujiati (QC and QA Manager of PT. ACI) and hers Laboratory’s member, and member’s of Industrial Electronic Laboratory, ITS.
REFERENCES
[1] Sri M., Edy S. and Kaswanto. 2010. Products Development of Coffee. Indonesian Coffee and Cocoa Research Institute. Jl. PB. Sudirman No. 90, Jember 68118 - Indonesia:
[2] H. Golnabi and A. Asadpour. 2007. Design and application of industrial machine vision systems. Robotics and Computer-Integrated Manufacturing. Vol. 23, No. 6, pp. 630–637.
[3] D.J. Lee, R. Schoenberger, J. Archibald, and S. McCollum. 2008. Development of a machine vision system for automatic date grading using digital reflective near-infrared imaging. Journal of Food Engineering. Vol. 86, No. 3, pp. 388–398.
[4] R. M. Haralick, K. Shanmugam and I. Dinstein. 1973. Textural Features for Image Classification. IEEE Trans. Syst. Man Cyber. SMC, Vol. 3, No. 6, pp. 610–621.
[5] F. Faridah, G. O. F. Parikesit and F. Ferdiansjah. 2011. Coffee Bean Grade Determination Based on Image Parameter. TELKOMNIKA. Vol. 9, No. 3, pp. 547–554.
[6] X. Chen, Y. Xun, W. Li, and J. Zhang. 2010. Combining discriminant analysis and neural networks for corn variety identification. Comp. and Elec. in Agriculture. Vol. 71(Supplement 1). pp. 48–S53.
[7] P. Zapotoczny. 2011. Discrimination of wheat grain varieties using image analysis and neural networks. Part I. Single kernel texture. Journal of Cereal Science. Vol. 54, No. 1, pp. 60-68.
[8] A. Pourreza, H. Pourreza, M.-H. Abbaspour-Fard and H. Sadrnia. 2012. Identification of nine Iranian wheat seed varieties by textural analysis with image processing. Comp. and Elec. in Agriculture. Vol. 83, pp. 102-108.
[9] A. Manickavasagan, G. Sathya, D. S. Jayas, and N. D. G. White. 2008. Wheat class identification using monochrome images. Journal of Cereal Science. Vol. 47, No. 3, pp. 518-527.
[10] C. Zheng, D.-W. Sun, and L. Zheng. 2006. Recent applications of image texture for evaluation of food qualities—a review. Trends Food Sci. Technol. Vol. 17, No. 3, pp. 113–128.
matrices. IEEE Trans. Geosci. Remote Sens. Vol. 37, No. 2, pp. 780-795.
[12] Sethu V. and Si W. 1999. Sequential support vector classifiers and regression. In Proc. International Conference on Soft Computing (SOCO’99). pp. 610-619.
[13] E. Phaisangittisagul, H. T. Nagle and V. Areekul. 2010. Intelligent method for sensor subset selection for machine olfaction. Sens. Actuators B Chem., Vol. 145, No. 1, pp. 507-515.
[14] Y. Liu and Y. F. Zheng. 2006. FS_SFS: A novel feature selection method for support vector machines. Pattern Recognition. Vol. 39, No. 7, pp. 1333-1345.
[15] Jinjie H., Yunze C. and Xiaoming X. 2006. A Wrapper for Feature Selection Based on Mutual Information. In 18th International Conference on