Georgia State University Georgia State University
ScholarWorks @ Georgia State University
ScholarWorks @ Georgia State University
Public Health Theses School of Public Health
Summer 8-7-2012
An Analysis of Geography Project Data to Determine HIV and
An Analysis of Geography Project Data to Determine HIV and
Behavioral Risk for High Risk Zip Codes and Low Risk Zip Codes
Behavioral Risk for High Risk Zip Codes and Low Risk Zip Codes
in Fulton County, GA
in Fulton County, GA
Jamaal B. Marshall Georgia State University
Follow this and additional works at: https://scholarworks.gsu.edu/iph_theses
Recommended Citation Recommended Citation
Marshall, Jamaal B., "An Analysis of Geography Project Data to Determine HIV and Behavioral Risk for High Risk Zip Codes and Low Risk Zip Codes in Fulton County, GA." Thesis, Georgia State University, 2012. https://scholarworks.gsu.edu/iph_theses/234
An Analysis of Geography Project Data to
Determine HIV and Behavioral Risk for
High Risk Zip Codes and Low Risk Zip
Codes in Fulton County, GA
Jamaal B. Marshall
Recommended Citation
ABSTRACT Jamaal B. Marshall
An Analysis of Geography Project Data to Determine HIV and Behavioral Risk for High Risk Zip Codes and Low Risk Zip Codes in Fulton County, GA
(Under the direction of Richard Rothenberg, MPH, MD)
INTRODUCTION: The HIV epidemic continues to face new challenges as antiretroviral therapy contributes to the increased prevalence of HIV. HIV disease in the Atlanta, GA area is thought to be clustered in specific areas of the metropolitan area, rather than evenly distributed. A study to show a significantly higher HIV risk in certain geographical areas would be beneficial to the many agencies of the area that allocate significant resources based on zip codes and other geographic factors.
AIM: The purpose of this study is to describe the demographics of the study population, describe the demographics of those participants that tested HIV-positive, and perform univariate and multivariate logistic regression analysis to determine the associations between zip code of residence, HIV infection, and risky behavior
METHODS: Data were collected by Georgia State University’s Center of Excellence for Health Disparities Research for The Geography Project. HIV disease was determined for each case using data from preliminary and confirmatory tests. Statistical analysis was performed using SPSS. A univariate and multivariate binary logistic regression analysis was performed on select variables. A p-value of < 0.05 and a 95% confidence interval (CI) were used to determine significance.
RESULTS: Participants in high risk zip codes were roughly 6.7 times more likely to have been given an HIV-positive result prior to interview when compared to participants in low risk zip codes (OR=6.717, CI=1.989-22.683, p=.000). Furthermore, these same participants were about 4.4 times more likely to be infected with HIV at the time of interview (OR=4.402, CI=2.109-9.187, p=.000), and 1.4 times more likely to have more than 3 sex contacts in the 6 months prior to the interview (OR=1.425, CI=1.075-1.890, p=.014). Participants in high risk zip codes were less likely to have experienced incarceration when compared to participants in low risk zip codes (OR=.551, CI=.390-.778, p=.001). The association between HIV and persons that identify as transgender was extremely significant (OR= 28.335, CI=8.305-96.678, p=.000). There was also a significant association between HIV and the high risk zip code group (OR=2.875, CI=1.330-6.217, p=.007).
DISCUSSION: The results indicated that participants in the high risk zip codes group were at a higher risk for HIV infection and having 3 or more sex contacts in the 6 months prior to the interview. Further analysis is suggested to determine if there is a significant association between geographic distance and partner selection.
An Analysis of Geography Project Data to Determine HIV and Behavioral Risk for High Risk Zip Codes and Low Risk Zip Codes in Fulton County, GA
by
Jamaal B. Marshall
B.A., Georgia State University
A Thesis Submitted to the Graduate Faculty of Georgia State University in Partial Fulfillment
of the
Requirements for the Degree
MASTER OF PUBLIC HEALTH
An Analysis of Geography Project Data to Determine HIV and Behavioral Risk for High Risk
Zip Codes and Low Risk Zip Codes in Fulton County, GA
by
iii
ACKNOWLEDGMENTS
I want to thank all of my professors at the Institute of Public Health at Georgia State University who have contributed to the public health knowledge that has allowed me to complete this thesis. I am extremely grateful to my committee member, Dr. Dajun Dai, and to my committee chair, Dr. Richard Rothenberg for their direction with the completion of this thesis.
iv
Author’s Statement Page
In presenting this thesis as a partial fulfillment of the requirements for an advanced
degree from Georgia State University, I agree that the Library of the University shall make it available for inspection and circulation in accordance with its regulations governing materials of this type. I agree that permission to quote from, to copy from, or to publish this thesis may be granted by the author or, in his/her absence, by the professor under whose direction it was written, or in his/her absence, by the Associate Dean, College of Health and Human Sciences. Such quoting, copying, or publishing must be solely for scholarly purposes and will not involve potential financial gain. It is understood that any copying from or publication of this dissertation which involves potential financial gain will not be allowed without written permission of the author.
v
Notice to Borrowers
All theses deposited in the Georgia State University Library must be used in accordance with the stipulations prescribed by the author in the preceding statement.
The author of this thesis is:
Jamaal Marshall
621 N. Highland Ave. #9 Atlanta, GA 30306
The Chair of the committee for this thesis is:
Richard Rothenberg Institute of Public Health Health and Human Services Georgia State University P.O. Box 3995
Atlanta, Georgia 30302-3995
Users of this thesis who are not regularly enrolled as students at Georgia State University are required to attest acceptance of the preceding stipulation by signing below. Libraries borrowing this thesis for the use of their patrons are required to see that each user records here the
information requested.
NAME OF USER ADDRESS DATE TYPE OF USE
(EXAMINATION ONLY
vi
Jamaal Marshall 621 N. Highland Ave #9
Atlanta, GA 30306 404-561-1546
Education
Georgia State University, Atlanta, GA
Master of Public Health, Prevention Sciences – Summer 2012
Georgia State University, Atlanta, GA Bachelors of Arts, Journalism - Fall 2009
Work Experience
Georgia State University, Institute of Public Health, Atlanta, GA January 2011 - Present Center of Excellence for Health Disparities Research; Graduate Research Assistant
Fulton County Department of Health, Atlanta, GA June 2006 – January 2011 Communicable Disease Prevention Branch; Disease Investigator
Skills
SPSS, SAS, Microsoft Excel, Microsoft Word, Microsoft PowerPoint, Public
vii
TABLE OF CONTENTS
Page
ACKNOWLEDGMENTS ...v
LIST OF TABLES ...xi
LIST OF ABBREVIATIONS………...xii
CHAPTERS 1. INTRODUCTION ...1
1.1 Background………...1
1.2 Purpose of the Study………...2
1.3 Hypotheses...………...3
2. REVIEW OF THE LITERATURE...4
2.1 STD/HIV Prevalence in the US…...………...4
2.2 STD/HIV Prevalence in Georgia and Fulton County, GA ………...8
2.3 The Impact of Socioeconomic Status on STD/HIV Transmission...………...10
2.4 The Impact of Geography on STD/HIV Transmission………....11
2.5 Spatial Distribution of Disease………....12
2.6 Using Zip Codes as Predictors of Risk…………..….……….14
3. METHODS………17
3.1 Data Source………..………..…..17
3.2 Inclusion/Exclusion Criteria………...18
3.3 HIV Disease Assessment Criteria……….………...19
3.4 Definitions………..………..……....20
3.5 Analysis………....20
4. RESULTS………..21
4.1 Demographics………...………...21
4.2 Univariate and Multivariate Analyses………...………...30
5. DISCUSSION……….…………...32
5.1 Discussion of Results……….…….….32
5.2 Limitations……….……...34
5.3 Recommendations………...…...34
5.4 Public Health Significance……….………..35
5.5 Conclusion……….………..35
viii
LIST OF TABLES
Table 4.1 Frequency and Percent of Qualified Participants by Demographic Category,
Metropolitan Atlanta, GA………...………...21
Table 4.2 Frequency and Percent of Demographic Variables by Zip Code Risk Group,
Metropolitan Atlanta, GA………..………24
Table 4.3 Mean, Median, and Std. Deviation of Participants’ Drug Contacts in Last 6 Months by Zip Code Risk Group, Metropolitan Atlanta, GA……….……….25
Table 4.4 Mean, Median, and Std. Deviation of Participants’ Sex Contacts in Last 6 Months by Zip Code Risk Group, Metropolitan Atlanta, GA ……….……….………...27
Table 4.5 Univariate Analysis of the Association between Selected Independent Variables and Zip Code Risk Group for Geography Project Participants, Metropolitan Atlanta, GA …..……..30
ix
LIST OF FIGURES
Figure 4.1 Map of High Risk and Low Risk Zip Codes……….………...………...22
Figure 4.2 Low Risk Zip Code Group, Number of Drug Contacts in 6 Months …………...…26
Figure 4.3 High Risk Zip Code Group, Number of Drug Contacts in 6 Months …………...…27
Figure 4.4 Low Risk Zip Code Group, Number of Sex Contacts in 6 Months …………...…28
x
LIST OF ABBREVIATIONS
AIDS – Acquired Immune Deficiency Syndrome
BBI – Blood Borne Infection
CBG – Census Block Group
CD4 – Cluster of Differentiation 4
CDC – U.S. Centers for Disease Control and Prevention
CMC – Centers for Medicare and Medicaid Services
CoEx – Center of Excellence for Health Disparities Research
CDC – Centers for Disease Control and Prevention
GIS – Geographic Information Systems
HAART – Highly Active Antiretroviral Therapy
HIV – Human Immunodeficiency Virus
HIV-ELISA – Human Immunodeficiency Virus – Enzyme Linked Immunosorbent Assay
MSM – Men that Have Sex with Men
PCP – Pneumocystis Carinii Pneumonia
SES – Socioeconomic Status
STD – Sexually Transmitted Disease
STI – Sexually Transmitted Infection
TB – Tuberculosis
USPS – United States Postal Service
ZCTA – Zip code tabulation area
1
CHAPTER I - INTRODUCTION
1.1 Background
The number of persons living with HIV in the United States continues to increase
annually. The U.S. Centers for Disease Control and Prevention (CDC) estimated that there was a
4% increase (30,000-40,000 cases) in HIV prevalence per year from 1996 until 2006 (Hall et al.,
2010). A major cause for this continuous rise in HIV prevalence was the introduction and
continued use of highly active antiretroviral therapy (HAART), and a relatively stable HIV
incidence (Hall et al., 2007; Hall et al., 2010; Campsmith et al., 2010). Adherence to HAART
decreases viral load, which also decreases the infectiousness of an HIV-positive person (Li et al.,
1998). However, increases in risky behavior by HIV-positive persons may counteract the
benefits of HAART (Hall et al., 2007). Because risky behavior is often geographically associated
with neighborhoods housing persons below the poverty line, persons of low socioeconomic
status are often at higher risk for HIV infection. Although African-Americans are often reported
as the group most burdened by HIV in the U.S., Hixson et al. (2010) found that HIV was more
associated with poverty than race. One recent study resulted in HIV being detected in about
2.4% of the persons living below the federal poverty level (Hixson et al., 2010). Hixson et al.
(2010) also states that “residents in impoverished areas may have a greater chance of
encountering others who participate in illegal drug use, engage in prostitution, or have other
experiences which put them at higher risk for HIV acquisition.” Indeed, Atlanta, GA, a city with a
poverty rate of about 21%, reports a large amount of new HIV infections every year (Kalichman
et al., 2010). In 2006, the state of Georgia was ranked eighth in the U.S. for its numbers of AIDS
cases. The metropolitan Atlanta area, which reported 21,354 cases of HIV in 2007, accounted
for 64% of all cases in the state (Hixson et al., 2010). Regarding distribution, a large percentage
2
and Dekalb counties in the Atlanta metropolitan area (Hixson et al., 2010). Clusters may be
described as “defined geographic areas in which the prevalence of disease is disproportionately
higher compared to neighboring areas (Hixson et al., 2010).” Gaining a clear understanding of
the spatial distribution of HIV in Atlanta is very important. With a heightened awareness of
where high prevalence clusters of HIV are located, it is possible that resources and services may
be allocated in a more efficient way to enhance HIV-prevention efforts (Hixson et al. 2010).
1.2 Purpose of the Study
Due to the relatively high prevalence of HIV in Atlanta, GA, as well as the high percentage of
persons in the metropolitan Atlanta area living below the poverty line, an association between
high risk zip code groups and risk of HIV infection would be significant. If high risk zip codes are
determined as a risk factor, more resources could be allocated toward specific areas in hopes of
increasing prevention for those most at risk. This study will focus on factors that may influence
HIV risk, such as area of residence and frequency of sex and drug contacts, among a population
of participants interviewed in the Atlanta, GA from 2007 until 2010.
The purpose of this study is to:
1) describe the demographics of the study population
2) describe the demographics of those participants that tested HIV-positive
3 1.3 Hypotheses
It is hypothesized that:
1) Participants in a high risk zip codes group were more likely to test positive for HIV disease at the time of the survey than participants in a low risk zip codes group
2) Participants in a high risk zip codes group were more likely to have been given an HIV-positive result prior to the survey than participants in a low risk zip codes group
4
CHAPTER II - REVIEW OF THE LITERATURE
2.1 STD/HIV Prevalence in the U.S.
The introduction of highly active antiretroviral therapy (HAART) was largely responsible for the
decline in new HIV infections and HIV-related deaths during the 1990’s (Hall, Byers, Ling, & Espinoza,
2007). This may be in part because HAART decreases the infectivity of HIV-infected persons, thereby
decreasing the chance that they will infect others (Hall et al., 2007). However, adherence to HAART has
been demonstrated as difficult for those of low socioeconomic status, who also tend to be at higher risk
for infection. A study of 188 HIV-positive persons performed by Kalichman and Grebler (2010) showed
that half of the participants took less than 75% of their prescribed HAART. Not surprisingly, lack of
adherence by the participants was determined to be strongly associated with food insecurity and
poverty-related occurrences (Kalichman & Grebler, 2010).
Although great strides have been made in educating the public on how the HIV virus is
transmitted, there has been less success with informing people on how it is not, and so HIV/AIDS stigma
continues to exist (Herek, Capitanio, & Widaman, 2002). Data from one survey shows that proportions
of respondents “overestimating the risks posed by some forms of casual social contact were higher in
1997 and 1999 than in 1991 (Herek et al., 2002).” And so Herek et al. (2002) consequently conclude that
promoting how HIV is transmitted may be just as important to stigma eradication as promoting how it is
not.
Although marketing the effectiveness of abstinence and condom use is significant for
HIV-prevention campaigns, it is also imperative to encourage the alternatives of having one partner at a
time, or the use of condoms with additional partners (Morris, Kurth, Hamilton, Moody, and Wakefield,
5
in the prevention of HIV, but their effects were demonstrated in a campaign launched in Uganda in the
1990’s.
The campaign’s intent was to convince Ugandan men that concurrent partnerships were the
primary cause of the country’s HIV epidemic. Following the campaign, the percentage of Ugandan men
reporting three or more non-marital partners decreased from 15% in 1989 to 3% in 1995, and the HIV
prevalence rate in Uganda fell from 15% in 1991 to 5% in 2001 (Morris et al., 2010). Morris et al. (2010)
conclude that because connectivity is low, the spread of infection is reduced in groups where serial
monogamy is the norm; however, in groups with certain levels of concurrency, spread of infection rises
due to increased connectivity.
Although behavior certainly plays a large role in STD transmission on an individual level,
socioeconomic factors are of great importance as community-level risk factors. Walker & Sweet (2011)
state that history of incarceration and education levels are highly associated with risk of STD infection.
Though it would seem obvious than those with less education were linked to higher STD infection rates,
Walker & Sweet (2011) state that this association is only present when comparing members of the same
race, as Black women who are college-educated have exhibited higher infection rates of STDs that White
women who did not finish high school (Walker & Sweet, 2011). Morris et al. (2010) believes that
assortative mixing, defined as forming partnerships between members of the same socioeconomic or
racial groups, rather than between members of different socioeconomic or racial groups may explain
the consistently high prevalence (relatively speaking) of STDs and HIV among African-Americans and
those of low socioeconomic status. Assortative mixing may also help explain the high incidence of HIV
6
The percentage of HIV prevalence in MSM has shifted the brunt of the epidemic toward males,
as they constituted an estimated 74.8% of the HIV prevalence in the U.S. in 2006 (Campsmith, Rhodes,
Hall, & Green, 2010). In one study of convenience samples of MSM in 5 U.S. cities, 48% of the MSM that
tested HIV-positive were not previously aware of their status (Hall et al., 2007). In fact, Campsmith et al.
(2010) estimated that at the end of the year 2006, 21% of the 1,106,400 adults living with HIV in the U.S.
were undiagnosed. A late diagnosis of HIV is undesirable, as it may lead to initiation of treatment during
later stages of HIV infection. This, in turn, may reduce the effectiveness of HAART (highly active
anti-retroviral therapy) (Hall et al., 2007). The study by Hall et al. (2007) demonstrated that the percentage
of unrecognized HIV infections differ greatly across the racial spectrum. In the study, only 18% of
HIV-positive White MSM were previously unaware of infection, compared to 48% for Hispanics and 67% for
Blacks. Consequently in a study performed by Hall et al. (2007) which examines HIV progression in
MSM, the percentage of Black MSM that did not convert from HIV to AIDS in three years is 66.8%,
compared to 68.1% for Hispanic MSM and 74.7% for White MSM. Hall et al. (2007) also reports that 3
years after an AIDS diagnosis, 80.6% of Black MSM were still alive, compared to 85.2% of Hispanic MSM
and 84.5% of White MSM.
Hall et al. (2007) suggests that “integrating HIV screening into routine medical care would serve
to detect HIV in the large number of MSM who are unaware of their HIV status and to detect HIV
infection early for timely intervention to slow disease progression.” According to another study, over
half of new HIV infections from 2003 to 2006 occurred in MSM (Hall et al., 2008). This study, which
examined incidence rates for HIV in the U.S., also noted that “incidence estimates continue to
demonstrate the disproportionate distribution of HIV infection among blacks (incidence rate, 83.7/100
7
Regarding syphilis prevalence in the U.S., it is estimated to be .71% in 18 to 49 year olds, which
would mean a relatively low prevalence of syphilis in the U.S. population (Gottlieb et al., 2010). While
Gottlieb et al. (2010) reports Non-Hispanic blacks as having the highest seroprevalence of all groups
(4.3%), they also state as a possibility that “Blacks may be more likely to attend public clinics where case
reporting is thought to be most complete, and may be overrepresented at the limited sites where
screening occurs (Gottlieb et al., 2010).” However, Gottlieb et al. (2010) also counters that case
reporting would not be a likely explanation for the differences in prevalence among races. Gottlieb et
al. (2010) also states that an indicator of risk for infection was the age that participants first experienced
sex.
Gottlieb et al. (2010) found syphilis seroprevalence to be higher among people who experienced
intercourse before the age of 15 (1.5% vs. 0.45%, P = 0.006). However, Gottlieb et al. (2010) notes that
the degree of the difference in syphilis seroprevalence between Non-Hispanic Blacks and Non-Hispanic
Whites has decreased dramatically. According to 1992 surveillance data, the ratio of Non-Hispanic
Blacks to Non-Hispanic Whites with current syphilis was 62:1, while 2005 surveillance data shows that
the ratio had decreased to 5.4:1 (Gottlieb et al., 2010). While the differences in racial disparities
regarding syphilis in the U.S. have been reduced to a large extent, MSM have become the group that
disproportionately experiences a higher prevalence than other groups. It is estimated that more than
60% of new syphilis infections occur in MSM (Gottlieb et al., 2010).
However, Tao et al. (2012) states that because the nationwide prevalence for gonorrhea is low,
the practice of dual screening should be re-evaluated so that resources for healthcare may be used
more in a more cost-effective manner. “Centers for Medicare and Medicaid Services (CMS) reimburse
$102 for dual chlamydia and gonorrhea nucleic acid amplification testing, compared to $51 for
8
that because women who are infected with gonorrhea are frequently co-infected with chlamydia,
treatments that eradicate both infections should be given to infected persons.
Gonorrhea is the second-highest reported STD in the United States and it results from infection
with Neisseria gonorrhoeae (Walker & Sweet, 2011). The CDC estimates that there are 700,000 new
cases of gonorrhea every year in the U.S (Walker & Sweet, 2011). However, this is a far cry from
historical rates as gonorrhea rates have reportedly fallen 74% between 1975 and 1997 in response to a
program aimed at gonorrhea control in the United States (Walker & Sweet, 2011).
Regarding demographic factors and geographic distribution of gonorrhea in the U.S., adolescent
black women in urban areas in the South are at the highest risk for infection (Walker & Sweet, 2011).
“In 2009, gonorrhea rates per 100,000 population by state ranged from 7.2 in Utah to 246.4 in
Mississippi (Walker & Sweet, 2011).” Walker and Sweet (2011) also state that the 50 most populous
metropolitan areas reported 60% of all U.S. gonorrhea cases to the CDC in 2009. It is also worth noting
that in 2009, the rate of gonorrhea in Black women was 17 times higher than in White women (Walker &
Sweet, 2011).
2.2 STD/HIV Prevalence in the Georgia and Fulton County, Georgia
The bulk of sexual transmitted disease has been detected most frequently in inner-city
populations in the United States ever since the U.S. population migrated into large metropolitan areas
during the industrial age. As of July 2008, the Atlanta-metropolitan area was “comprised of 31 counties
with an estimated population of 5,376,285 persons (Hixson et al., 2011).” The city of Atlanta’s
population is relatively small in comparison, with a population of 437,105 persons in 2010 according to
the U.S. Census Bureau. Also, 55.8% of this population consists of African Americans (Hixson et al.,
9
del Rio, & Frew, 2011). Kalichman and Grebler (2010) stated in their study that “Atlanta has over 23,000
reported cases of AIDS and an HIV/AIDS case rate of 23 per 100,000 population, exceeding the average
rate of 15 per 100,000 population in other major US cities.”
The Ponce de Leon Center located in Atlanta, GA serves over 4,000 HIV-infected patients, and is
one of the largest HIV-care centers in the U.S. (Hixson et al., 2011). “The Georgia Department of Human
Resources estimates that over 70% of HIV-infected patients who live in Atlanta reside within 2 miles of
the clinic (Hixson et al., 2011).” Hixson et al. (2011) discuss that community-level variables are
important to consider when determining risk factors for HIV infection. These community-level variables
hold such influence because residents in impoverished areas may have a greater chance of encountering
persons that participate in high risk HIV activities such as illegal drug use and prostitution (Hixson et al.,
2011). Hixson et al. (2011) also states that there may be an association to race and ethnicity as
African-Americans and Hispanic people are more likely to live in impoverished areas than their White
counterparts.
In a similar study, Kalichman et al. (2010) examine food-related issues amongst 344 participants
infected with HIV/AIDS in Atlanta, GA. Comparably, half of the participants “lacked sufficient food, and
food insufficiency was associated with multiple indicators of poor health, including higher HIV viral
loads, lower CD4 cell counts, and poorer treatment adherence (Kalichman et al., 2010).” The
Atlanta-based study also demonstrated that a lack of sufficient food was more predictive of HAART
non-adherence than education, employment, housing and income (Kalichman et al., 2010). About 25% of
the participants indicated that they have had to decide between paying for HAART and purchasing food
in the past year, results that were consistent with Kalichman and Grebler’s 2010 study. Atlanta has a
10
to state that food can impede HIV wasting, and is necessary for the proper absorption of some HAART
medications (Kalichman et al., 2010).
2.3 The Impact of Socioeconomic Status on HIV/STD Transmission
Although it is important to establish poverty’s strong association with STDs, it is important to
examine the mechanisms responsible for this association as well (Fichtenberg, Jennings, Glass, & Ellen,
2010). Fichtenberg et al. (2010) attempts this by performing a study which examines the association
between living in a lower poverty census block group (CBG) and the level of risk based on having
multiple partners or having a partner with multiple partners. Those that were considered low risk
individuals in this study were participants that were in conformed dyads (monogamous pairs). Medium
risk individuals were defined as persons with a single partner that had multiple sex partners, or persons
with a single partner whose partner was not interviewed, and therefore may or may not have had
multiple partners. High risk individuals were those who have multiple sex partners. The study
determined that “living in a higher poverty CBG was associated with increased likelihood of being in a
non-dyadic sexual network component, controlling for age and sex (Fichtenberg et al., 2010).”
Comparably, another study using data from The 1992 Youth Risk Behavior
Survey/Supplement shows that for adolescents, living in a 2 parent family was independently associated
with never having been sexually active (Santelli, Lowry, & Brener, 2000).
Sullivan et al. (2011) states that STDs have a tendency to cluster in geographically definable
areas with residents of low socioeconomic status (SES). While prevalence of HIV/STDs can be influenced
by several factors, prevalence has a direct impact on new infections because “as STI prevalence
increases, the likelihood of finding a sexual partner that has an STI also increases (Sullivan et al., 2010).”
11
Sullivan et al. (2010) state that the amount of single mothers in neighborhoods and the amount of
African-Americans were strongly correlated, suggesting that neighborhoods with a large amount of
single, African-American mothers may be responsible for a large amount of the disease burden. They
also reached the conclusion that “census tracts with more women than men were associated with
increased gonorrhea rates (Sullivan et al., 2010).” This finding is consistent with the results of a study
performed by Rothenberg (1983) examining the gonorrhea occurrence in New York State. Furthermore,
Sullivan et al. (2010) suggested that low SES may be a barrier to treatment for infected persons due to
an inability to acquire a means of transportation.
2.4 The Impact of Geography on STD/HIV Transmission
Jennings et al. (2011) state that “geographic areas may have a higher incidence of infection
because they have a greater percentage of residents who are demographically and/or behaviorally at
higher risk for STIs. For example, a high STI area may contain a greater proportion of adolescent girls or
a greater proportion of people who do not use condoms. This would suggest that neighborhood of
residence is just a proxy for individual characteristics of the residents and not in of itself an independent
risk factor.”
However, Jennings et al.’s (2011) Baltimore-based study aims to determine if the prevalence of
STDs/HIV in the available pool of partners in a neighborhood is an independent individual-level risk
factor for STD/HIV infection. They also note that local sex networks, while defined as consisting of
people close in proximity, may include both residents and non-residents of an area. The study did
indeed determine that individuals who tested positive for chlamydia and gonorrhea were more likely to
12
In another study based in Baltimore involving attendees at an STD clinic, Grindi et al. (2011)
similarly conclude that the clinic patients were likely to seek partners that lived nearby, as geography
and proximity of partner are very important factors in partner selection.
In a study examining the difference between demographic and geospatial risk factors for
chlamydia, gonorrhea, genital herpes, and genital warts in Leeds, England, the researchers concluded
that “31% of all disease occurred in the four inner city census wards, representing 15% of the population
(Monteiro, Lacey, and Merrick, 2005).”
Rothenberg (1983) also discusses demographic risk factors in his New York based-study
regarding core groups and the distribution of gonorrhea transmission. The study shows that gonorrhea
is “neither randomly nor uniformly distributed in Upstate New York (Rothenberg, 1983)” and that it is
actually “a tightly clustered illness, producing high rates of infection in small definable, geographic areas
(Rothenberg, 1983).”
2.5 Spatial Distribution of Disease
As Krieger et al. (2003) demonstrated, determining the distribution of disease in order to link
causes to geographic associations can be very helpful when determining the etiology of disease. Fede,
Stewart, Hardin, Mayfield-Smith, & Sudduth (2011) state that “information about the spatial distribution
of disease rates and rate disparities can be useful in targeting at-risk populations, allocating resources
for HIV prevention, and allocating resources for HIV/AIDS care and service delivery.“ Bernstein et al.
(2004) attempted using spatial data to identify likely areas in Baltimore, Maryland with high risk sexual
activity and transmission. Bernstein et al. (2004) describes STD transmission in communities “as a
function of three components: the efficiency of transmission of disease between individuals, the rate of
13
define core groups as “individuals who are consistently infectious and able to transmit disease to large
numbers of sexual partners”, and states that the presence of such individuals in a community ensures
the continued reproduction of STDs. Per Bernstein et al. (2004), these individuals remain infectious by
going untreated for extended periods or constantly experiencing reinfection. In the analysis of the 9,910
gonorrhea cases reported to Baltimore City Health Department in 2001 and 2002, 15.3% of the cases
were persons with repeat infections (Bernstein et al., 2004). Bernstein et al. (2004) also stated that
Rothenberg (1983), in a previous study, provided an operational definition for core, defining it as census
tracts that account for more than 50% of the morbidity in a major urban area.
An important matter mentioned by Decker, Sharpe, and Dillon (1997) in regards to showing
spatial distribution of disease is the maintenance of confidentiality. Because the six-digit postal code in
their Toronto-based study defines a more specific area, the authors make mention of the possibility of
being able to identify individuals represented by the data. However, the authors conclude that
“confidentiality would not have been compromised because six-digit codes are only locational estimates
centered on one side of a street of a city block (Decker et al., 1997).” The authors also cite Peter Gould,
who models disease spread, as stating that “in all studies of mathematical modeling [sic], geographers
have never identified any one person, have no need to do so and would not know what to do with the
information if they had it (Decker et al., 1997).”
Fede et al. (2011) also look at the distribution of syphilis, gonorrhea, chlamydia, and HIV rates in
South Carolina. The analysis reveals large disparities in race and gender regarding HIV. Law, Serre,
Christakos, Leone, and Miller (2004) examine the spatial distribution of chlamydia, gonorrhea, syphilis,
and HIV in Wake County, North Carolina to decide risk of infection in certain areas. They determined
that the core areas of transmission should be targeting with STD prevention strategies, rather than
14
healthcare providers tend to be located outside of the core areas where population density is high, but
STD infection rate is relatively low. Consequently, Law et al. (2004) concludes that the availability of STD
services should be increased in core areas.
2.6Using Zip Codes as Predictors of Risk
Grubesic and Matisziw (2006) state that Zone Improvement Plan (zip) codes “originated as a way
of classifying street segments, address ranges and delivery points to expedite the delivery of mail.”
Krieger et al. (2003) also state that zip codes are established by the U.S. Postal Service for efficient mail
delivery. The size of zip codes can range from “large areas cutting across states to a single building or
company with a high volume of mail (Krieger et al., 2003).” However, zip codes are typically designated
for areas that people inhabit, meaning that desolate areas such as parts of Arizona’s Sonora desert
would not be represented by a zip code (Grubesic & Matisziw, 2006). It is also important to note that
zip codes can be altered, expanded, or discontinued every few months to meet the needs of the U.S.
Postal Service, making evaluations difficult for researchers performing zip-code based analyses (Grubesic
& Matisziw, 2006; Krieger et al., 2003). However, the treatment of zip codes as units of analysis has
increased substantially in the field of epidemiology in the past few years (Grubesic, 2008). Using zip
codes may be beneficial comparable to county-level analysis as it would provide greater detail. Also,
using zip codes rather than smaller units of analysis may be advantageous as zip code analysis increases
the likelihood that confidentiality of participants would be maintained.
In order to monitor socioeconomic characteristics in relation to STD infection, Sullivan et al.
(2010) believes that the census tract is the best geographic unit of measurement for this task. Krieger,
Waterman, Chen, Soobader, & Subramanian (2003) perform a study to determine whether census tract,
15
According to Krieger et al. (2003), zip codes usually contain about 30,000 individuals on average. By
contrast, census tracts typically contain about 4,000 individuals on average, while census block groups
contain about 1,000 individuals, and are the smallest unit of measure for which data is collected (Krieger
et al., 2003). Krieger et al. (2003) determine that census tract measures and census block groups are
both adequate units of measure when assessing socioeconomic characteristics of population groups.
They also find that using zip codes as a measure of socioeconomic inequality may be inadequate
considering that different geographical sections within the zip code may exhibit different socioeconomic
characteristics.
Grubesic and Matisziw (2006) also discuss another alternative to zip codes for looking at disease
risk. This alternative is referred to as Zip code tabulation area (ZCTA). ZCTAs “were developed as spatial
units by the U.S. Census Bureau for the 2000 decennial census (Grubesic & Matisziw, 2006),” are not
manipulated by the U.S. Postal Service (USPS), and thus have more defined boundaries that zip codes.
The U.S. Census Bureau defines ZCTAs as “generalized area representations of U.S. Postal Service (USPS)
ZIP Code service areas (http://www.census.gov/geo/ZCTA/zcta.html)” and states that ZCTAs represent
the five-digit ZIP Code most often found in a given area.
Grubesic and Matisziw (2006) go on to list the numerous differences between zip codes and
ZCTAs. Major differences include the assignment of ZCTAs to large undeveloped areas while zip codes
are usually not assigned to such an area with no need for mail delivery. Also, zip codes are usually
contiguous (sharing at least two borders), while ZCTAs consist of two or more discontiguous areas. The
study concludes that both ZCTAs and zip codes should be analyzed with caution. It goes on to say that
the inability to definitively establish borders for zip codes may create errors in data analysis, whereas
topographical features such as rivers and lakes, which would be included in ZCTA analysis, may create
16
In a zip-code based analysis, Acevedo-Garcia (2001) examines the association between zip
code-level risk factors and high tuberculosis rates amongst different ethnicities. Acevedo-Garcia (2001)
concluded that zip code-level risk factors such as high exposure to poverty, high contact with
immigrants, and high exposure to dilapidation have a strong association with high rates of TB infection.
A study performed in San Francisco examining Pneumocystis carinii pneumonia (PCP) in
HIV-infected persons, the conclusion was reached that persons living in the 94103 zip code had a much
lower risk of developing PCP than participants living in the other five zip codes used for examination
(odds ratio = 0.2, 95% confidence interval 0.1-0.6, p < 0.01) (Morris, Swanson, Ha HuAn, & Huang, 2000).
It is also worth noting that the effect was present despite controlling for prophylaxis use, antiretroviral
therapy, CD4 cell count, and HIV RNA level. A comparison of the socioeconomic status in the different
zip codes warrants an examination, and a look at the median annual household income for 94103 was
$18,411, the lowest of the six zip codes. The average median annual household income of the other 5
zip codes was $29,094 (Morris et al., 2000). However, the authors state that P. carinii DNA has been
discovered in water and air samples, and that patients with a history of PCP were more likely to be
involved in activities that increase the likelihood of soil exposure (Morris et al., 2000). Such activities
included gardening or hiking/camping (OR 5.38, 95% CI 1.39–20.8 for gardening; OR 7.68, 95% CI 1.34–
44.1 for hiking/camping) (Morris et al., 2000)”. Morris et al. (2010) go on to conclude that living in
94103, the poorest of the six zip codes, may have been a protective factor due to the limited access of
residents to camping, gardening, and similar activities, adding weight to the argument that zip codes
may have an association with disease incidence and prevalence.
17
CHAPTER III - METHODS
3.1 Data Source
Secondary data was obtained from the Center of Excellence for Health Disparities Research (CoEx)
located in the Institute of Public Health at Georgia State University. The primary objective of the CoEx is
conducting research that investigates health disparities in communities burdened by disease in Atlanta,
GA. In 2005, the CoEx initiated a research undertaking called The Geography Project. This research
project was based on the idea that continuous transmission of HIV, STDs, and BBIs (Blood-Borne
infections) requires several exposures experienced through multiple avenues, a network structure that
expedites infectious disease transmission, and geographic proximity that increases the likelihood of
partner selection from a pool of high-risk persons. A chain-link study design was used for this research,
and all interviews took place between 2007 and 2010 in the metropolitan Atlanta, GA area. The CoEx
agreed to allow use of their encoded dataset for the purpose of this thesis. Based on the distribution of
HIV and STDs in Atlanta, five urban zip codes in the metropolitan area of Atlanta were identified as
having a low burden of HIV/STD, while five other metro Atlanta zip codes were identified as having a
high HIV/STD burden. Research participants were selected from these 10 zip codes. Each participant
received a standard questionnaire which included questions about sociodemographic, behavioral,
geographic, and medical questions. Participants also received examinations for seven STDs and BBIs,
including HIV, Herpes Simplex Virus-2, Hepatitis C, Syphilis, Gonorrhea, Chlamydia, and Trichomoniasis
(only women received testing for Trichomoniasis). Each participant was assigned an individual
18 3.2 Inclusion/Exclusion Criteria
Original Geography Project Dataset Inclusion Criteria -- The dataset used for these analyses represents
information collected from participants in the metropolitan Atlanta area. Initially, 30 participants were
selected as seeds. Participants selected as seeds for the study were men and women who were at least
18 years of age, and reported risky drug use and/or sexual activity. Also, seeds were required to be
residents of one of the following metropolitan Atlanta area zip codes: 30308, 30310, 30311, 30314,
30315, 30318, 30331, 30337, 30344, and 30349. Other participants were men and women of at least 18
years of age who were either named by a seed or one of the seeds’ contacts. Participants were to be
interviewed 3 times over a 3 year period. The total N for the dataset was 927 before inclusion/exclusion
parameters were applied.
Residence – Cases in which data for the current living situation, mailing address, or center of activities
did not place the participant in one of ten metropolitan Atlanta area zip codes (30308, 30310, 30311,
30314, 30315, 30318, 30331, 30337,303441 and 30349) and did not link the participant to a seed
residing in one of those zip codes were excluded. Participants listed for 30308, 30310, 30314, 30315,
and 30318 were assigned to a high risk zip codes group. Participants listed for 30311, 30331, 30337,
30344, and 30349 were assigned to a low risk zip codes group
Age— All participants were listed in the dataset as 18 years of age or older. No maximum age was
19 3.3 HIV Assessment
Overall HIV assessment was determined by a preliminary HIV-ELISA examination and/or a HIV
Western Blot examination.
Participants were indicated as HIV-negative in the dataset if preliminary HIV-ELISA tests reported
negative, if preliminary HIV-ELISA tests reported positive and confirmatory HIV Western Blot tests
reported negative, or if preliminary HIV-ELISA tests reported inconclusive and confirmatory HIV Western
Blot tests reported negative.
Participants were indicated as HIV-inconclusive in the data set if preliminary HIV-ELISA tests
reported positive and confirmatory Western Blot tests reported inconclusive, if preliminary
HIV-ELISA tests reported positive and participant did not receive a confirmatory HIV Western Blot test, or if
preliminary HIV-ELISA tests reported inconclusive and confirmatory HIV Western Blot tests reported
inconclusive.
Participants were indicated as HIV-positive if preliminary HIV-ELISA tests reported positive and
confirmatory HIV Western Blot tests reported positive, or if preliminary HIV-ELISA tests reported
20 3.4 Definitions
Gender: Gender as reported by participant during interview and indicated in dataset
Highly active antiretroviral therapy (HAART): Therapy administered to HIV-positive persons to improve
the immune system and decrease the HIV viral load
HIV Incidence: Refers to the amount of new HIV infections in a given timespan
HIV Prevalence: Refers to the total amount of existing HIV cases in a given population
HIV Viral Load: Used to measure and refer to the severity of HIV infection in a single person
Race: Race as indicated by interviewer and listed in dataset
Risky behavior: Indicated by multiple sex partners and/or multiple drug use partners.
Socioeconomic status (SES): Used to refer to a person’s social and economic standing relative to any
give population of which that person is a part of.
Spatial distribution: How a population is geographically dispersed and how that dispersion impacts
health
3.5 Analysis
Statistical analysis was performed in SPSS. Univariate and multivariate binary logistic regression analysis
was performed for select variables. A p-value of <0.05 and a 95% confidence interval (CI) were used to
21
CHAPTER IV – RESULTS
4.1 Demographics
The N for The Geography Project data after applying inclusion/exclusion criteria was
897. Zip codes were determined to have low or high risk based on previous reports of HIV
cases in Fulton County, GA. Seeds and their contacts from 30308, 30310, 30314, 30315, and
30318 were placed in a high risk zip codes group. Seeds and their contacts from 30311, 30331,
[image:34.612.71.425.540.715.2]30337, 30344, and 30349 were placed in a low risk zip codes group.
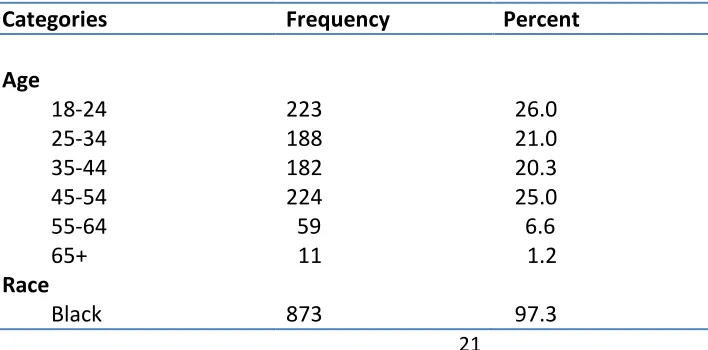
Table 4.1 shows that the sample is well distributed among age and gender (with the
expected exception of persons identifying as transgender), but almost completely consists of
participants that identify as Black (97.3%). The table also shows that 30314 (4.4%) and 30337
(2.2%) may have been underrepresented in the sample, although this is likely affected by a zip
code for one or more of the seeds not being indicated in the dataset, thus leading to omission
of the seed(s) and any of their contacts lacking indication of residence or activity in one of the
high or low risk zip codes of focus.
Table 4.1 Frequency and Percent of Qualified Participants by Demographic Category, Metropolitan Atlanta, GA
Categories Frequency Percent
Age
18-24 223 26.0
25-34 188 21.0
35-44 182 20.3
45-54 224 25.0
55-64 59 6.6
65+ 11 1.2
Race
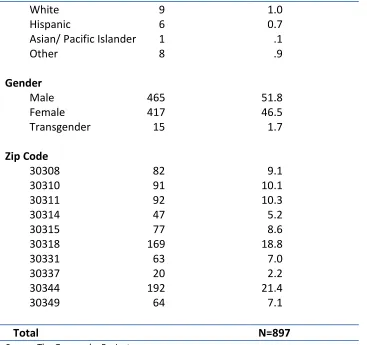
22 White
Hispanic
Asian/ Pacific Islander Other 9 6 1 8 1.0 0.7 .1 .9 Gender Male Female Transgender Zip Code 30308 30310 30311 30314 30315 30318 30331 30337 30344 30349 465 417 15 82 91 92 47 77 169 63 20 192 64 51.8 46.5 1.7 9.1 10.1 10.3 5.2 8.6 18.8 7.0 2.2 21.4 7.1
Total N=897
[image:35.612.67.434.71.416.2]Source: The Geography Project
Figure 4.1 displays the zip codes of interests, with the high risk zip codes group being indicated
23
Figure 4.1 Map of High Risk and Low Risk Zip Codes
*High risk zip codes are distinguished by hash lines.
24
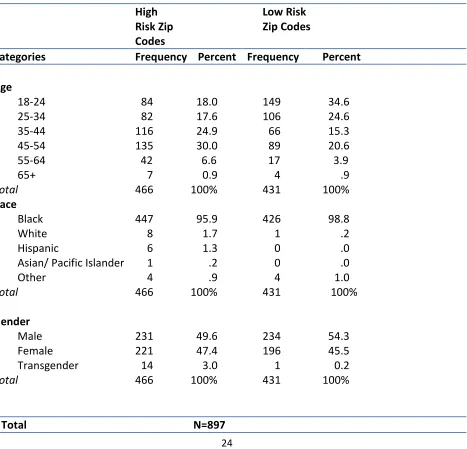
Table 4.2 shows that over a one-third of the sample population for low risk zip codes
were between the ages of 18 and 24. The table similarly shows that almost one-third of the
sample population in high risk zip codes were between the ages of 45 and 54. Also noteworthy
is that 14 of the 15 transgendered persons in the study were listed in the high risk zip codes
group.
Table 4.2 Frequency and Percent of Demographic Variables by Zip Code Risk Group, Metropolitan Atlanta, GA
High Risk Zip Codes
Low Risk Zip Codes
Categories Frequency Percent Frequency Percent
Age
18-24 84 18.0 149 34.6
25-34 82 17.6 106 24.6
35-44 116 24.9 66 15.3
45-54 135 30.0 89 20.6
55-64 42 6.6 17 3.9
65+ 7 0.9 4 .9
Total 466 100% 431 100%
Race
Black White
Hispanic
Asian/ Pacific Islander Other Total 447 8 6 1 4 466 95.9 1.7 1.3 .2 .9 100% 426 1 0 0 4 431 98.8 .2 .0 .0 1.0 100% Gender Male Female Transgender Total 231 221 14 466 49.6 47.4 3.0 100% 234 196 1 431 54.3 45.5 0.2 100%
25
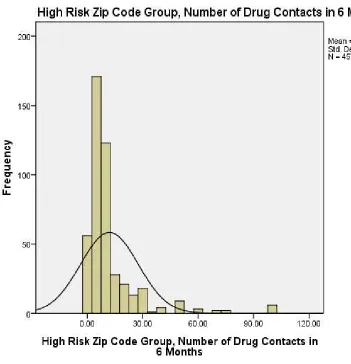
Participants indicated their number of drug and alcohol contacts in the 6 months prior
to the survey. Table 4.3 shows that high risk zip codes have a larger mean (15.25), median
(8.0), and standard deviation (33.94) compared to the mean (11.86), median (6.0), and standard
deviation (21.46) for low risk zip codes. Figure 4.2 and Figure 4.3 show the distributions in low
risk zip codes and high risk zip codes, respectively, for the number of drug contacts in the six
months prior to the survey.
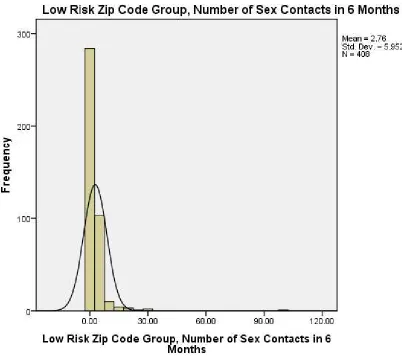
Participants also indicated their number of sex contacts that they had in the 6 months
prior to the survey. Table 4.4 shows that high risk zip codes have a much larger mean (8.09)
and standard deviation (33.28) than the mean (2.76) and standard deviation (5.95) for low risk
zip codes. However, high risk and low risk zip codes do have the same median (2.0). Figure 4.4
and Figure 4.5 show these distributions in low risk zip codes and high risk zip codes,
respectively.
Table 4.3 Mean, Median, and Std. Deviation of Participants’ Drug Contacts in Last 6 Months by Zip Code Risk Group, Metropolitan Atlanta, GA
Categories Mean Median Std. Deviation N
Zip Code Risk Group
26
Figure 4.2
27
Figure 4.3
[image:40.612.83.434.117.481.2]
Table 4.4 Mean, Median, and Std. Deviation of Participants’ Sex Contacts in Last 6 Months by Zip Code Risk Group, Metropolitan Atlanta, GA
Categories Mean Median Std. Deviation N
Zip Code Risk Group
Low Risk Zip Codes High Risk Zip Codes
2.76 8.09
2.0 2.0
5.95 33.28
Total
408 464
872
28
Figure 4.4
[image:41.612.85.487.135.492.2]29
Figure 4.5
[image:42.612.72.476.115.487.2]*Values indicated by participants to be greater than 100 were removed during graphing of this distribution. Mean, median, and standard deviation for this graph were affected as a result
30
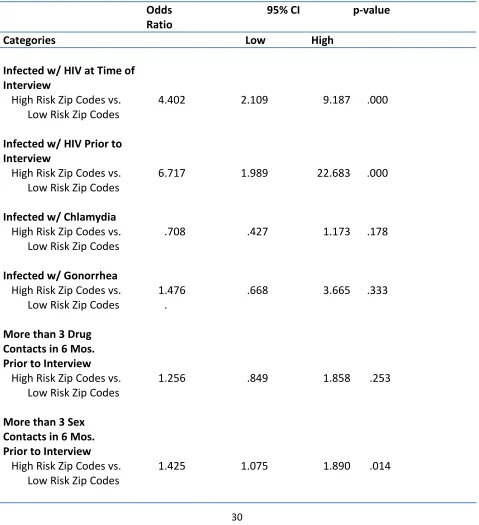
[image:43.612.69.548.195.720.2]4.2 Univariate and Multivariate Analyses
Table 4.5 Univariate Analysis of the Association between Selected Independent Variables and Zip Code Risk Group for Geography Project Participants, Metropolitan Atlanta, GA
Odds Ratio
95% CI p-value
Categories Low High
Infected w/ HIV at Time of Interview
High Risk Zip Codes vs. 4.402 2.109 9.187 .000
Low Risk Zip Codes
Infected w/ HIV Prior to Interview
High Risk Zip Codes vs. 6.717 1.989 22.683 .000
Low Risk Zip Codes
Infected w/ Chlamydia
High Risk Zip Codes vs. Low Risk Zip Codes
.708 .427 1.173 .178
Infected w/ Gonorrhea High Risk Zip Codes vs. Low Risk Zip Codes
More than 3 Drug Contacts in 6 Mos. Prior to Interview
High Risk Zip Codes vs. Low Risk Zip Codes
More than 3 Sex Contacts in 6 Mos. Prior to Interview
High Risk Zip Codes vs. Low Risk Zip Codes
1.476 . 1.256 1.425 .668 .849 1.075
3.665 .333
1.858 .253
31
Ever Incarcerated or Detained
High Risk Zip Codes vs. Low Risk Zip Codes
[image:44.612.63.538.171.686.2].551 .390 .778 .001
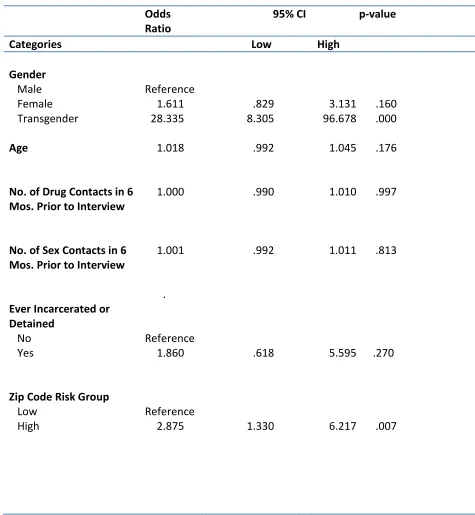
Table 4.6 Multivariate Analysis of the Association between Selected Independent Variables and HIV for Geography Project Participants, Metropolitan Atlanta, GA
Odds Ratio
95% CI p-value
Categories Low High
Gender Male Female Transgender Reference 1.611 28.335 .829 8.305
3.131 .160 96.678 .000
Age 1.018 .992 1.045 .176
No. of Drug Contacts in 6 Mos. Prior to Interview
1.000 .990 1.010 .997
No. of Sex Contacts in 6 Mos. Prior to Interview
1.001 .992 1.011 .813
Ever Incarcerated or Detained
No Yes
Zip Code Risk Group
Low High . Reference 1.860 Reference 2.875 .618 1.330
5.595 .270
32
CHAPTER V - DISCUSSION
5.1 Discussion of Results
It was hypothesized that participants in high risk zip codes would have a higher average
number of drug and alcohol contacts as well as a larger dispersion. Table 4.3 shows that high
risk zip codes have a larger mean (15.25), median (8.0), and standard deviation (33.94)
compared to the mean (11.86), median (6.0), and standard deviation (21.46) for low risk zip
codes. It was similarly hypothesized that participants in high risk zip codes would have a higher
average number of sex contacts as well as a larger dispersion. Table 4.4 shows that high risk zip
codes have a much larger mean (8.09) and standard deviation (33.28) than the mean (2.76) and
standard deviation (5.95) for low risk zip codes. However, high risk and low risk zip codes do
share a median (2.0), which likely means that the values for the number of sex contacts in six
months prior to the interview are not normally distributed for high risk zip codes. This also may
be indicative of some of the participants from high risk zip codes indicating extremely high
values when asked about their number of sex partners in the past 6 months.
Analysis indicated that participants in high risk zip codes were roughly 6.7 times more
likely to have been given an HIV-positive result prior to interview when compared to
participants in low risk zip codes (OR=6.717, CI=1.989-22.683, p=.000). Furthermore, these
33
interview (OR=4.402, CI=2.109-9.187, p=.000), and 1.4 times more likely to have more than 3
sex contacts in the 6 months prior to the interview (OR=1.425, CI=1.075-1.890, p=.014). These
results are expected considering that the high risk zip codes group is host to the bulk of
Atlanta’s MSM population. 14 of the 15 transgendered participants in this study were listed in
high risk zip code groups. Although it was assumed that the majority, if not all of the persons
that identified as transgender were male-to-female, there is no indication in the dataset if this
is entirely true. This high risk zip code group also hosts Grady Hospital’s Ponce Clinic, one of the
largest HIV care clinics in the U.S. (Hixson et al., 2010). “The Georgia Department of Human
Resources estimates that over 70% of HIV-infected patients who live in Atlanta reside within 2
miles of the clinic (Hixson et al., 2011).” Unexpectedly, participants in high risk zip codes were
less likely to have experienced incarceration when compared to participants in low risk zip
codes (OR=.551, CI=.390-.778, p=.001). Table 4.6 shows that the association between HIV and
persons that identify as transgender was extremely significant (OR= 28.335, CI=8.305-96.678,
p=.000). There was also a significant association between HIV and the high risk zip code group
(OR=2.875, CI=1.330-6.217, p=.007).
The high risk zip codes seem to have been selected on the basis that persons at higher
risk tend to have residence and/or a high level of activity there. Likewise, low risk zip codes
were selected on the basis that persons with a comparably lower risk tend to have residence
and/or a high level of activity there. Analysis of the data confirms the selection of zip codes
34
This study supports the idea that the HIV spread has focal tendencies and that neighborhood
contacts may play a vital role in HIV risk.
5.2 Limitations
There are several limitations to this study. First, as with many studies based on
secondary data, the nature of the data collection presents challenges, as a chain link study
design coupled with seeking seeds with risky behavior make the likelihood of participants
having risky behavior higher than it would be in a random sample. 97.3% of the study
population identified as Black, which may affect the study’s generalizability. Also, there were
seeds in the dataset for which no zip code was indicated, and this led to the omission of 30
cases. Furthermore, the age distribution was uneven in both low and high risk zip codes.
Roughly one-third of the sample population in the high risk zip codes group were between the
ages of 35 and 44, while about one-third of the sample population for low risk zip codes were
between the ages of 18 and 24.
5.3 Recommendations
To assess if there is a correlation between sex and drug partnerships, future analyses
should include consideration of network configurations and geographic distances between
partners. These analyses would help to determine if there is a significant association between
35
establish if those in high risk areas select partners closer to their residences and/or center of
activities and determine whether high or low risk groups have a higher prevalence of risk
taking.
5.4 Public Health Significance
HIV prevalence continues to increase each year in the United States, aided by a
continued rise in HIV incidence and HAART, which has helped considerably to increase the
survival rate of HIV-infected persons since the 1990’s. Consequently, the health care system’s
workforce may feel a strain as it struggles to care for the ever-increasing number of
HIV-infected individuals. HIV investigation and prevention efforts of the Fulton County Health
Department in Atlanta, GA typically use zip codes as a determination of how to allocate
personnel and resources. If a more effective means of resource allocation can be discovered
through research, this would be a major accomplishment in the fight against HIV and other
STDs. Health services made accessible to the public and positioned in specific areas with higher
HIV prevalence around the country may very well contribute to the decline of annual HIV
incidence rates.
5.5 Conclusion
The rate of HIV-prevalence in Atlanta, GA is one of the highest of all U.S. major cities. It
36
being African-American (Hixson et al., 2010), and a poverty rate of 21% (Kalichman et al., 2010).
Predictably, MSM and those who live below the poverty line tend to have most of their activity
in high risk zip codes. Those in high risk zip codes were more likely to test positive for HIV
during the survey, be infected with HIV prior to the survey, and have more than 3 sex contacts
in the 6 months prior to the survey. Persons identifying as transgender had an extremely
significant association with HIV, and all but one of these persons were listed in the high risk zip
codes group. Further research is needed to determine the significance of geographic location to
37 REFERENCE LIST
Acevedo-Garcia, D. (2001). Zip code-level risk factors for tuberculosis: Neighborhood
environment and residential segregation in new jersey, 1985-1992. American Journal of Public Health 91(5), 734-741.
Bernstein, K.T., Curriero, F.C., Jennings, J.M., Olthoff, G., Erbelding, E.J. & Zenilman, J. (2004). Defining core gonorrhea transmission utilizing spatial data. American Journal of Epidemiology 160(1), 51-58.
Campsmith, M.L., Rhodes, P.H., Hall, H.I., & Green, T.A. (2010). Undiagnosed hiv prevalence among adults and adolescents in the us at the end of 2006. Journal of Acquired Immune Deficiency Syndromes 53(5), 619-624.
Decker, J.F., Sharpe, B., & Dillon, J.R. (1997). Mapping antibiotic-resistant neisseria gonorrhoeae isolates in metropolitan toronto: Issues of scale, positional accuracy and confidentiality. The Canadian Journal of Infectious Diseases 8(5), 273-278.
Elliot, P. & Wartenburg, D. (2004). Spatial epidemiology: Current approaches and future challenges. Environmental Health Perspectives 112(9), 998-1006.
Fede, A.L., Stewart, J.E., Hardin, J.W., Mayfield-Smith, K., & Sudduth, D. (2011). Spatial
visualization of multivariate datasets: an analysis of std and hiv/aids diagnosis rates and socioeconomic context using ring maps. Public Health Reports 126, 115-126.
Fichtenberg,C.M., Jennings, J.M., Glass, T.A., & Ellen, J.M. (2010). Neighborhood socioeconomic environment and sexual network position. Journal of Urban Health (87)2, 225-235.
38
from the national health and nutrition examination surveys (NHANES) 2001-2004. Journal of the American Sexually Transmitted Diseases Association 35(5), 507-511.
Grindi, R.M., Sifakis, F., Sherman, S.G., Towe, V.L., Flynn, C., & Zenilman, J. (2011). The
geography of heterosexual partnerships in Baltimore city adults. Sexually Transmitted Disease (38)4, 260-266.
Grubesic, T.H. & Matisziw, T.C. (2006). On the use of ZIP codes and ZIP code tabulation areas (ZCTAs) for the spatial analysis of epidemiological data. International Journal of Health Geographics 5, 58-72.
Hall, H.I., Byers, R.H., Ling, Q., and Espinoza, L. (2007). Racial/ethnic and age disparities in hiv prevalence and disease progression among men who have sex with men in the united states. American Journal of Public Health 97(6), 1060-1066.
Hall, H.I., Green, T.A., Wolitski, R.J., Holtgrave, D.R., Rhodes, P., Lehman, J.S., Durden,T., Fenton, K.A., & Mermin, J.H. (2010). Estimated future hiv prevalence, incidence, and potential infections averted in the united states: A multiple scenario analysis. Journal of Acquired Immune Deficiency Symdromes(55)2, 271-276.
Hall, H. I., Song, R., Rhodes, P., Prejean, J., An, Q., Lee, L. M., Karon, J., Brookmeyer, R., Kaplan E.H., McKenna, M.T. & Janssen, R. S. (2008). Estimation of hiv incidence in the united states. The Journal of the American Medical Association 300(5), 520-529.
Herek, G. M., Capitanio, J. P., & Widaman, K. F. (2002). HIV-related stigma and knowledge in the united states: Prevalence and trends, 1991–1999. American Journal of Public Health 92(3), 371-377.
Hixson, B.A., Omer, S.B., del Rio, C., & Frew, P.M. (2011). Spatial clustering of HIV prevalence in Atlanta, Georgia and population characteristics associated with case concentrations. Journal of Urban Health 88(1), 129-141.
Jennings, J.M., Taylor, R., Iannacchione, V.G., Rogers, S.M., Chung, S., Huettner, S., & Ellen, J.M. (2010). The available pool of sex partners and risk for a current sexually transmitted infection. Annals of Epidemiology 20(7), 532-538.
39
Krieger, N., Waterman, P.D., Chen, J.T., Soobader, M., & Subramanian, S.V. (2003). Monitoring socioeconomic inequalities in sexually transmitted infections, tuberculosis, and violence: Geocoding and choice of area-based socioeconomic measures. Public Health Reports 118, 240-258.
Law, D., Serre, M., Christakos, G., Leone, P., & Miller, W. (2004). Spatial analysis and mapping of sexually transmitted diseases to optimise intervention and prevention strategies.
Sexually Transmitted Infections (80)4, 294-299.
Monteiro, E., Lacey, C., & Merrick, D. (2005). The interrelation of demographic and geospatial risk factors between four common sexually transmitted diseases. Sexually Transmitted Infections 81(1), 41-46.
Morris, A.M., Swanson, M., Ha HuAn, & Huang, L. (2000). Geographic distribution of human immunodeficiency virus-associated pneumocystis carinii pneumonia in san francisco. American Journal of Respiratory and Critical Care Medicine 162(5), 1622-1626.
Morris, M., Kurth, A.E., Hamilton, D.T., Moody, J., & Wakefield, S. (2009). Concurrent partnerships and hiv prevalence disparities by race: Linking science and public health practice. American Journal of Public Health 99(6), 1023-1031.
Rothenberg, R. (1983). The geography of gonorrhea: Empirical demonstration of core group transmission. American Journal of Epidemiology 117(6), 688-694.
Santelli, J.S., Lowry, R., Brener, N.D., & Robin, L. (2000). The association of sexual behaviors with socioeconomic status, family structure, and race/ethnicity among us adolescents.
American Journal of Public Health 90(10), 1582-1588.
Sullivan, A.B., Gesink, D.C., Brown, P., Zhou, L., Kaufman, J.S., Fitch, M., Serre, M.L. & Miller, W.C. (2011). Are neighborhood sociocultural factors influencing the spatial pattern of gonorrhea in north carolina? Annals of Epidemiology 21(4), 245-252.
Tao, G., Hoover, K. W., & Kent, C. K. (2012). Chlamydia testing patterns for commercially insured women, 2008. American Journal of Preventive Medicine 42(4), 337-341.
Walker, C. K. & Sweet, R. L. (2011). Gonorrhea infection in women: prevalence, effects, screening, and management. International Journal of Women’s Health 3, 197-206.
40